

Leverage Shares 2X Long SPCX Daily ETF stocks have been trading down by -15.51 percent amid worsening SPAC sentiment and outflows
Key Takeaways
- Leverage Shares 2X Long SPCX Daily ETF (SPCH) has retreated from recent highs above $12 to the mid-$8 area, signaling a sharp momentum shift on the daily chart.
- Recent trading shows wide intraday swings, with SPCH bouncing between the high-$7s and mid-$8s, highlighting elevated volatility.
- Key support appears near $7.50–$8.00, while prior resistance sits around $10–$12, giving traders clear reference levels.
- With no fundamental ratios reported, SPCH trades almost purely on technicals and sentiment, rewarding disciplined risk management.
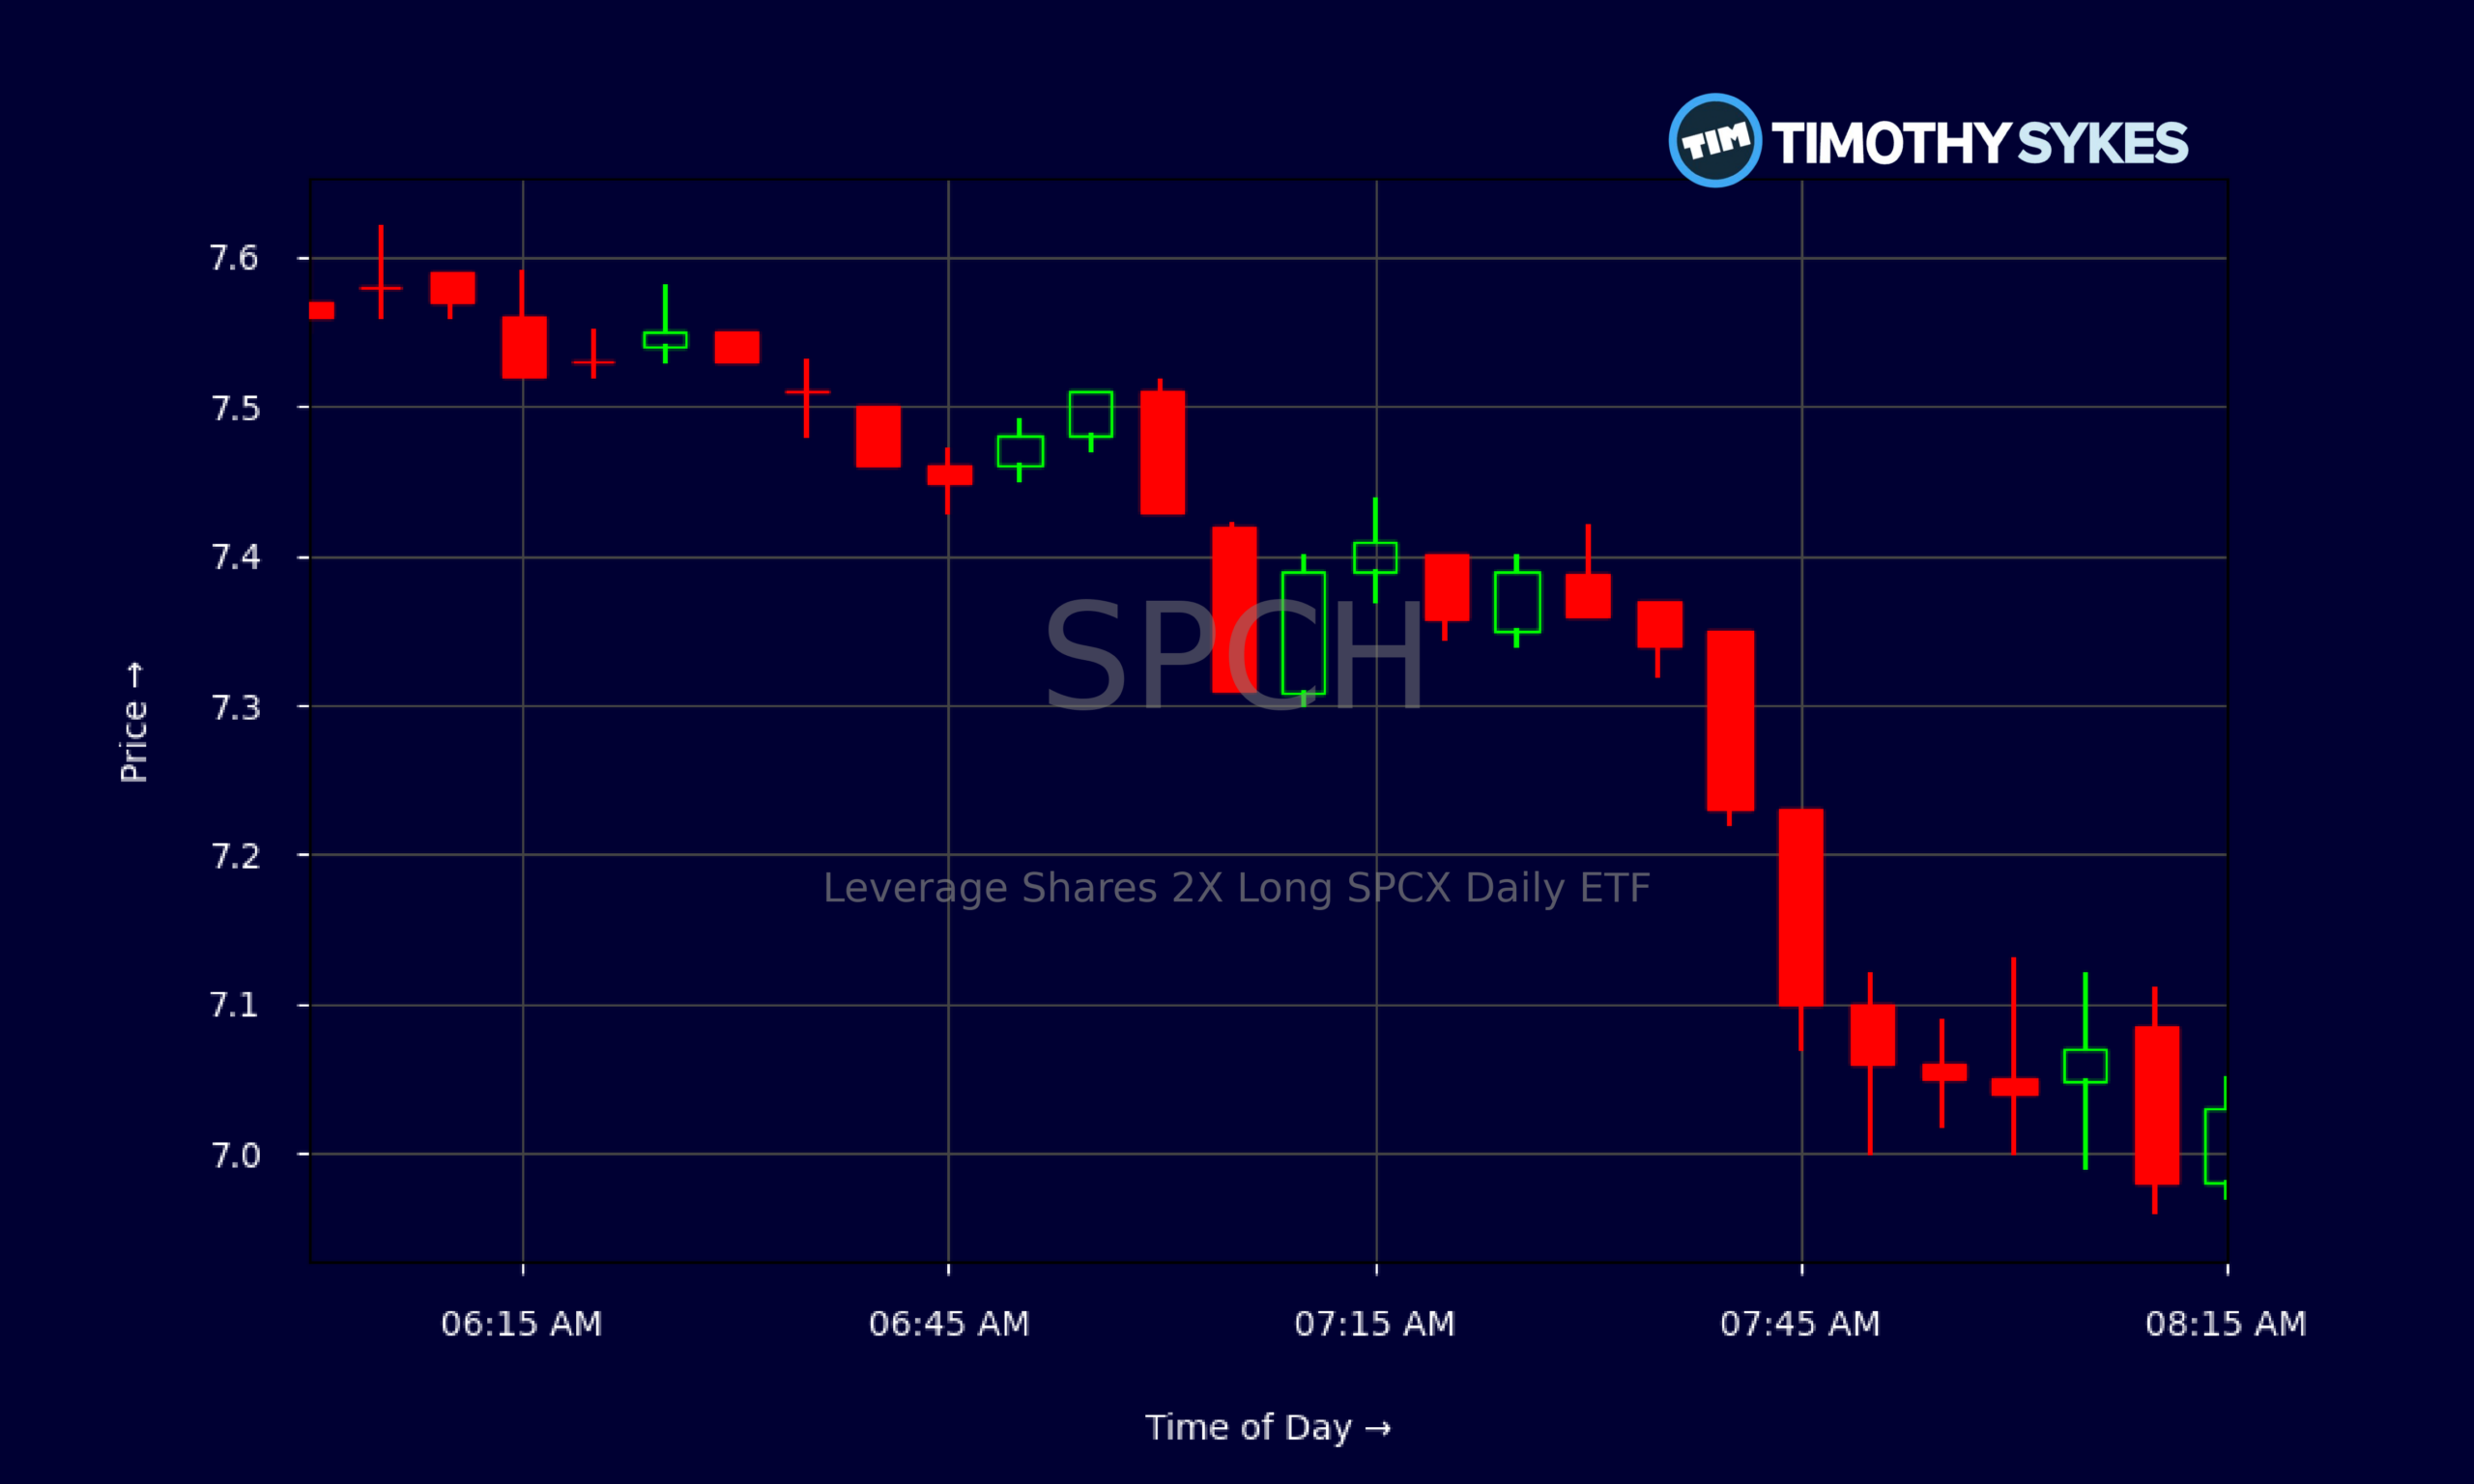
Live Update At 08:19:03 EST: On Wednesday, November 04, 2026 Leverage Shares 2X Long SPCX Daily ETF stock [BATS Global Markets: SPCH] is trending down by -15.51%! Discover the key drivers behind this movement as well as our expert analysis in the detailed breakdown below.
Quick Financial Overview
SPCH, the Leverage Shares 2X Long SPCX Daily ETF, is built for traders who want amplified moves, not quiet charts. This is a leveraged product, so price action matters far more than classic fundamentals right now. The key ratio data are basically blank, which tells traders one thing: you trade SPCH for its chart, not for its balance sheet.
Look at the recent daily candles. SPCH ran to the $12 area in mid-October, then steadily slid into the high-$8s and mid-$7s. That is a heavy pullback in a short window, and for a 2X ETF, it signals a strong reversal in the underlying specialty finance exposure.
More Breaking News
Over the last several sessions, SPCH has closed between roughly $7.50 and $8.50, with frequent tests of both ends of that range. That behavior shows compression after a big drop. Intraday, SPCH has been printing tight but active five‑minute candles around $7.50–$7.60, with quick pushes above $7.60 and dips toward $7.50. For short‑term traders, this is a textbook “volatility box” where planning entries and exits matters more than guessing long‑term value.
Why Traders Are Watching SPCH Price Action
SPCH has the kind of chart that gets day traders’ attention. In mid-October, Leverage Shares 2X Long SPCX Daily ETF was trading above $12. Over the next couple of weeks, SPCH bled down into the $8–$9 zone, eventually printing closes around $7.59–$8.32. That steady fade, without any clear fundamental anchors, tells traders that sentiment flipped hard in the underlying theme.
When a leveraged ETF like SPCH breaks from a strong uptrend and fails to bounce quickly, it often becomes a hunting ground for both short-biased traders and dip-buyers. The run from $11.78–$12.09 highs down to sub-$8 closes offers a wide “story arc” on the chart: euphoria, breakdown, then indecision. SPCH now trades like a cleanup zone where late longs are trapped and nimble traders look to play the emotional swings.
Zoom into the intraday five‑minute data and you see that SPCH is not dead; it’s coiling. Pre‑market and early trading show price clustering around $7.50–$7.60 with repeated tests of both sides. That kind of tight, choppy band can break sharply once a new trend catches.
For momentum traders, SPCH above $8 opens the door for pushes toward $9–$10 if volume steps in. On the downside, repeated closes below $7.50 warn that sellers are still in control. In short, SPCH is a pure technical sandbox — clean levels, strong leverage, and fast feedback for anyone trading the moves instead of hoping for a story.
Conclusion
SPCH, the Leverage Shares 2X Long SPCX Daily ETF, is doing exactly what a leveraged product is designed to do: magnify the underlying swings. It ripped toward $12, then gave back a big chunk of that run and now wanders in the high‑$7s to mid‑$8s. That rollercoaster is not for casual market watchers. It is for traders who accept that volatility cuts both ways. As millionaire penny stock trader and teacher Tim Sykes, says, “You must adapt to the market; the market will not adapt to you.”. That mindset is crucial when dealing with a leveraged product like SPCH, where flexibility and discipline can make the difference between a solid trade and a painful lesson.
Right now, SPCH offers a clear technical framework. Recent highs above $11.50–$12.00 mark the ceiling from the last wave. The $7.50–$8.00 band acts as a battle zone where bulls and bears fight for control. Breaks and holds outside that range will likely define the next short‑term trend in SPCH. With fundamental metrics largely absent, price and volume are the only real guides.
For active traders studying SPCH, the message is simple: respect the leverage, respect your stops, and let the chart lead. Tim Sykes says it best — “The market doesn’t care about your opinion, it cares about your discipline.” SPCH is a live test of that idea. This ETF can be a powerful educational tool for learning how momentum, risk management, and clear setups matter far more than predictions, especially in fast, leveraged trading vehicles.
This is stock news, not investment advice. Timothy Sykes News delivers real-time stock market news focused on key catalysts driving short-term price movements. Our content is tailored for active traders and investors seeking to capitalize on rapid price fluctuations, particularly in volatile sectors like penny stocks. Readers come to us for detailed coverage on earnings reports, mergers, FDA approvals, new contracts, and unusual trading volumes that can trigger significant short-term price action. Some users utilize our news to explain sudden stock movements, while others rely on it for diligent research into potential investment opportunities.
Dive deeper into the world of trading with Timothy Sykes, renowned for his expertise in penny stocks. Explore his top picks and discover the strategies that have propelled him to success with these articles:
- Penny Stocks Trading Guide
- Best Penny Stocks Under $1 to Buy Today
- Top 8 Penny Stocks to Watch on Robinhood
Once you’ve got some stocks on watch, elevate your trading game with StocksToTrade the ultimate platform for traders. With specialized tools for swing and day trading, StocksToTrade will guide you through the market’s twists and turns.
Dig into StocksToTrade’s watchlists here:





Leave a reply