

SANGRIX INC. stocks have been trading up by 39.59 percent amid heightened optimism from its most recent breakthrough news.
Key Takeaways
- Recent SGRX trading shows a sharp spike above $1 followed by a pullback, signaling hot momentum but fragile conviction.
- Daily SANGRIX INC. chart reveals a big surge from sub-$0.50 levels toward $0.85, then consolidation near $0.74.
- Balance sheet shows roughly $1.6M in cash against $12.1M in total liabilities, so runway is limited.
- With a price near $0.74 against book value per share of $4.69, SGRX trades at a deep discount to stated equity.
Live Update At 08:19:29 EST: On Tuesday, November 03, 2026 SANGRIX INC. stock [NASDAQ: SGRX] is trending up by 39.59%! Discover the key drivers behind this movement as well as our expert analysis in the detailed breakdown below.
Quick Financial Overview
SGRX is trading like a classic low-priced momentum play. On the daily chart, SGRX ran from around $0.39 on 2026/10/29 to intraday highs above $1.20 on 2026/10/16, before settling back to the $0.70–$0.80 range. That kind of move grabs day traders’ screens fast. It also reminds everyone how brutal the reversals can be when the music stops.
Financially, SANGRIX INC. is tiny. Enterprise value sits near $12.1M, with total assets of about $21.2M and equity of roughly $9.8M. Cash is just under $1.6M, while total liabilities top $12.1M. That tells traders this is not a cash-rich story; it’s a balance-sheet tightrope.
More Breaking News
One key metric jumps off the page: book value per share of $4.69 versus a sub-$1 share price. On paper, SGRX trades at roughly 0.5x book. For deep-value and speculative traders, that discount can be attractive, but the negative retained earnings and weak profitability metrics signal real business pressure. In simple terms, SANGRIX INC. is cheap for a reason, and the tape is where traders confirm if the story has legs.
Why Traders Are Watching SGRX Price Action
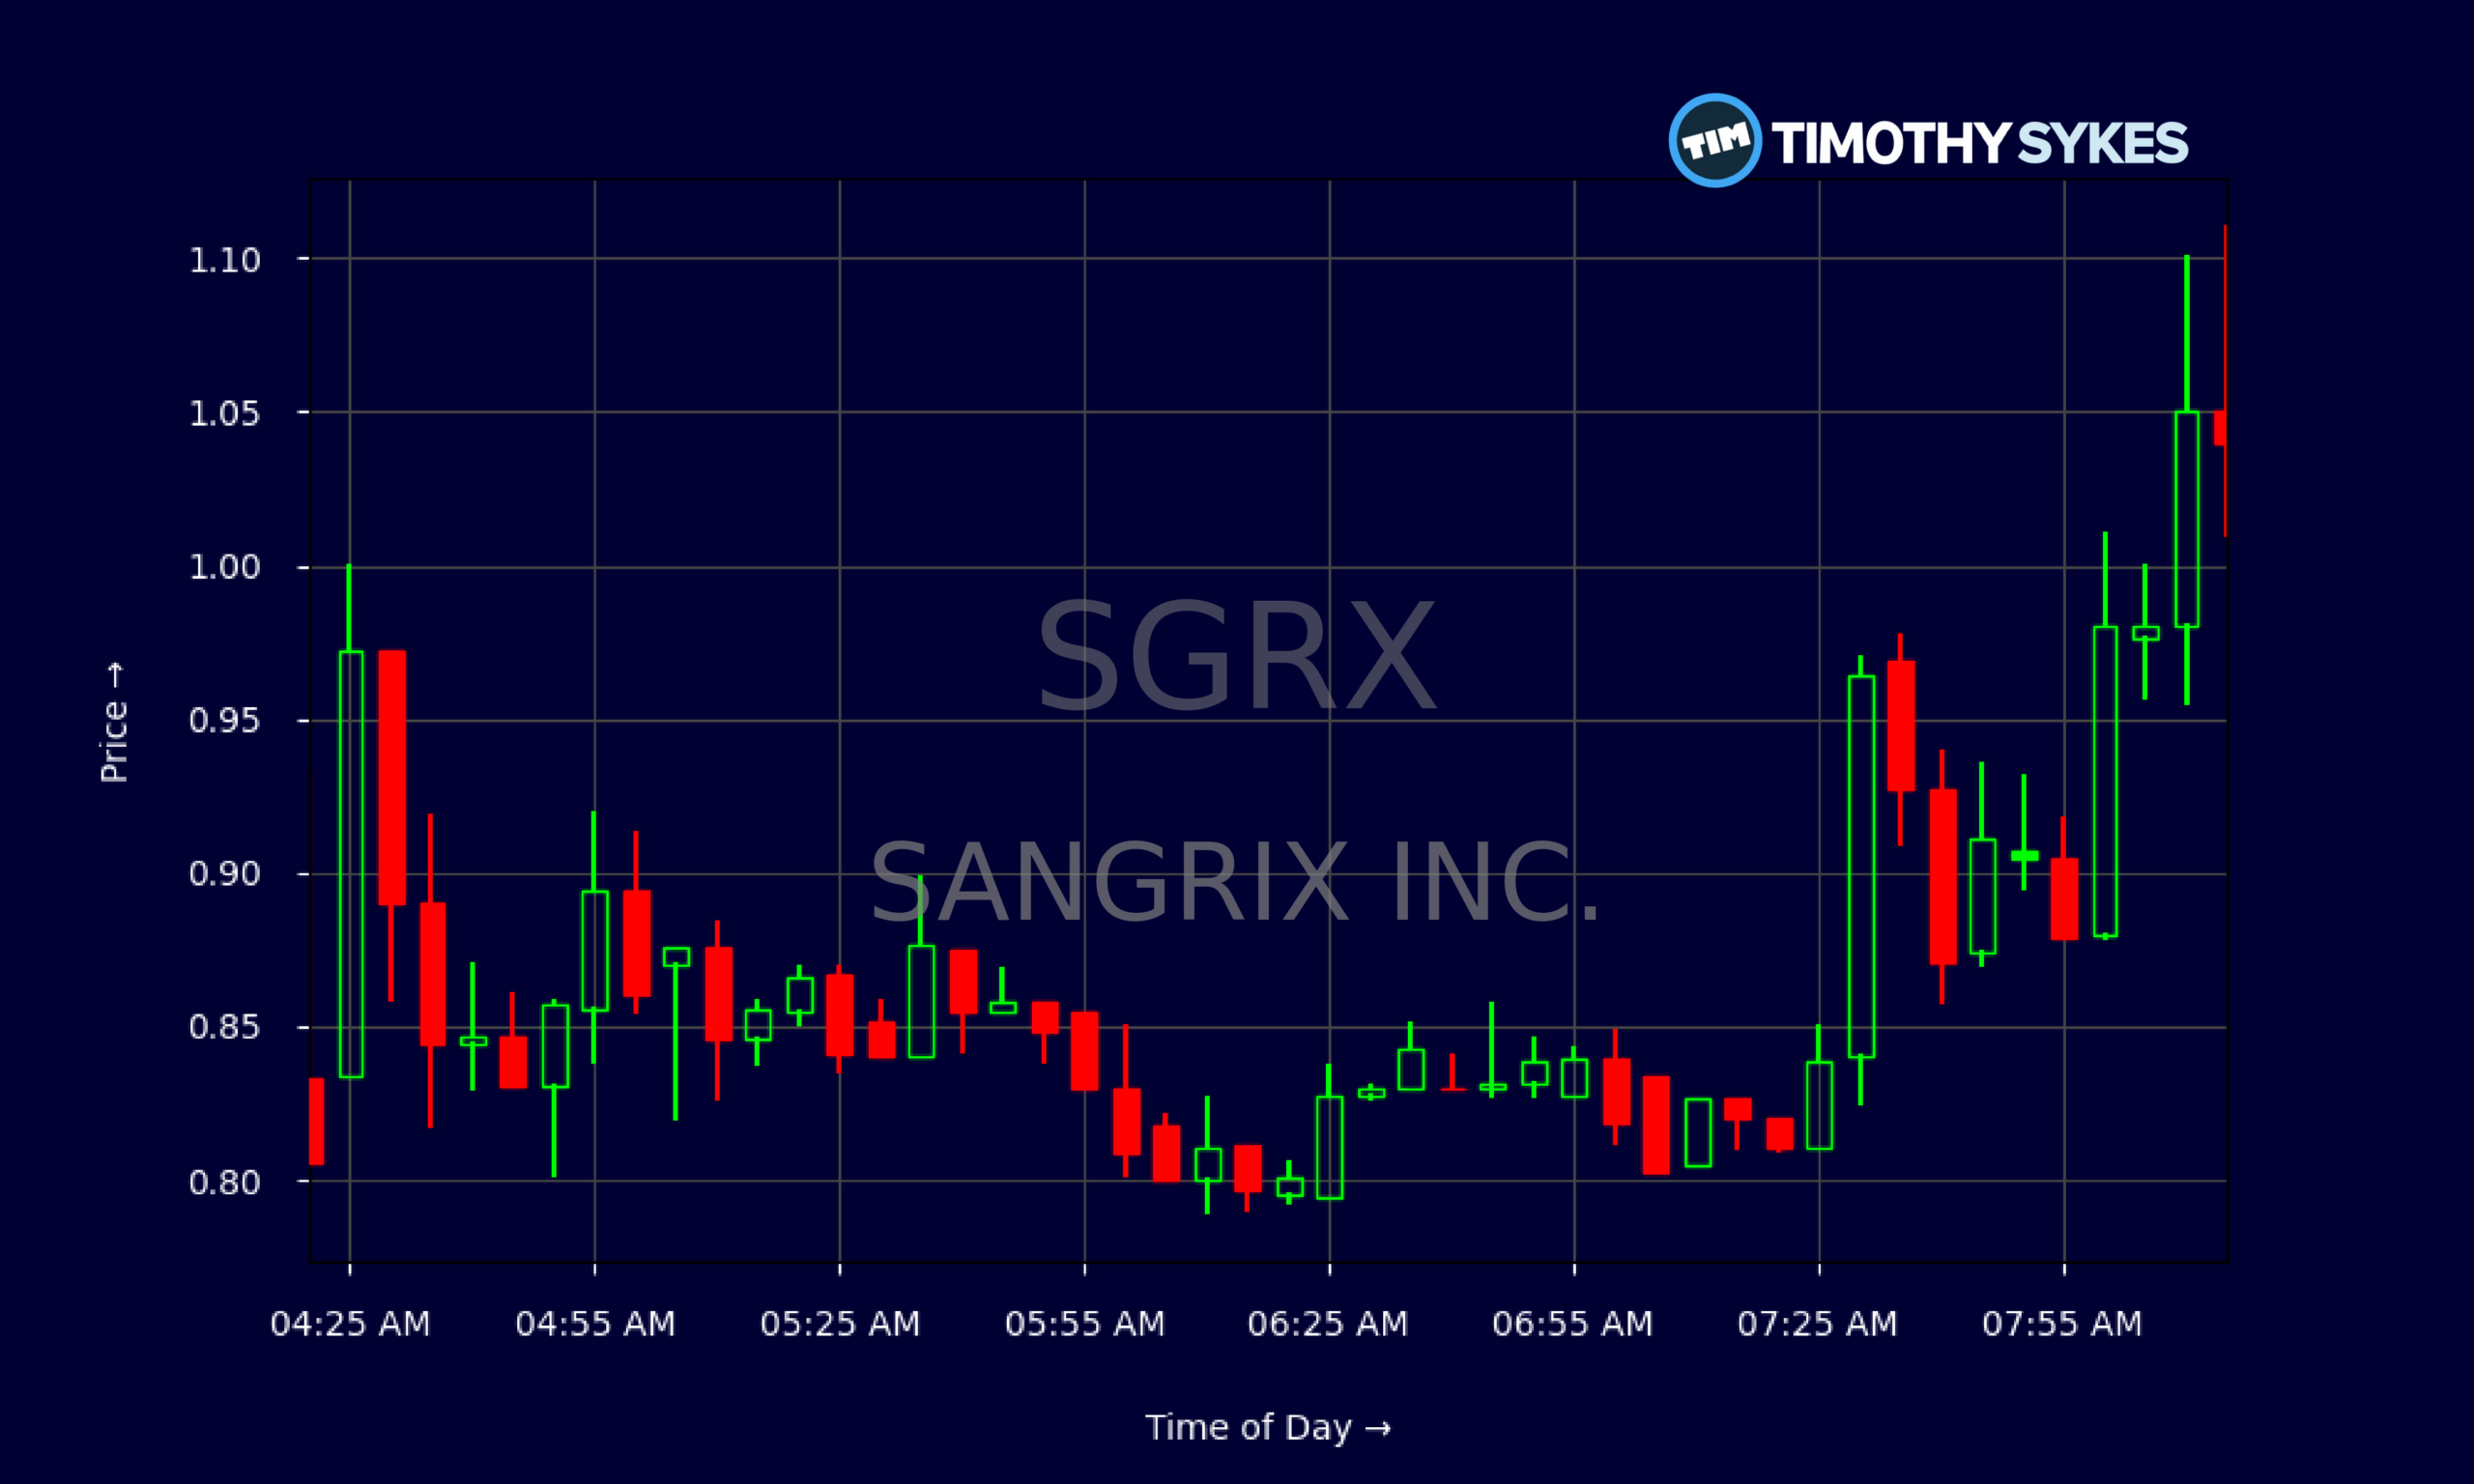
The recent SGRX chart is the main story. On 2026/10/30, the stock opened near $0.41, ripped as high as $1.11, and closed around $0.73. That’s a huge intraday range for SANGRIX INC. and exactly the kind of volatility momentum traders hunt. A few days earlier, on 2026/10/16, SGRX opened above $1.03, spiked to $1.21, then cratered to a low near $0.64 before finishing around $0.87. Those are wild swings in both directions.
Zooming into the intraday data, SGRX churned between roughly $0.75 and $1.11 with frequent 5-minute candles showing long wicks. That tells traders there’s active tug-of-war between aggressive buyers and profit-takers. Liquidity is thin enough for sharp spikes, but strong enough for fast in-and-out trades if you respect your stops.
Technically, SANGRIX INC. has shifted from a down-and-sideways grind near $0.37–$0.40 into a higher range, now closing at $0.738 on 2026/11/02 after touching $0.85. The key question for short-term traders: does SGRX build a higher base above roughly $0.70, or does it round-trip back into the $0.40s?
When a low-float name like SGRX shows repeated pushes over $1 and then fails, it often turns into a “battle zone” level on future moves. Many day traders will mark $1.00–$1.10 as a major breakout line. If SANGRIX INC. eventually clears and holds that zone with volume, momentum traders will likely swarm again. Until then, SGRX remains a reactive, pattern-driven ticker where discipline matters more than predictions.
Conclusion
SGRX sits at the crossroads of ugly fundamentals and exciting price action. On one hand, SANGRIX INC. shows negative recent returns on capital, shrinking revenue trends, and limited cash compared with its liabilities. On the other hand, the stock trades at about 0.5x book value with a history of sharp runs from below $0.50 to above $1.00. That split is exactly why experienced traders pay attention to both the chart and the filings.
For short-term players, SGRX is all about risk management around those key levels: support in the mid-$0.60s to $0.70s, and overhead trouble every time it approaches $1. Intraday, the 5-minute data shows quick whipsaws, so chasing late can be costly. SANGRIX INC. rewards traders who plan their entries and exits, not those who react emotionally. As millionaire penny stock trader and teacher Tim Sykes, says, “Consistency is key in trading; don’t let emotions dictate your trades.”
Tim Sykes’ core rule applies directly here: “Cut losses quickly; that’s how you stay in the game long enough to catch the big winners.” With a volatile name like SGRX, that mindset is not optional. It’s survival. For educational and research-focused traders, this ticker is a live case study in how tiny companies with stressed balance sheets can still offer explosive, but dangerous, trading setups.
This is stock news, not investment advice. Timothy Sykes News delivers real-time stock market news focused on key catalysts driving short-term price movements. Our content is tailored for active traders and investors seeking to capitalize on rapid price fluctuations, particularly in volatile sectors like penny stocks. Readers come to us for detailed coverage on earnings reports, mergers, FDA approvals, new contracts, and unusual trading volumes that can trigger significant short-term price action. Some users utilize our news to explain sudden stock movements, while others rely on it for diligent research into potential investment opportunities.
Dive deeper into the world of trading with Timothy Sykes, renowned for his expertise in penny stocks. Explore his top picks and discover the strategies that have propelled him to success with these articles:
- Penny Stocks Trading Guide
- Best Penny Stocks Under $1 to Buy Today
- Top 8 Penny Stocks to Watch on Robinhood
Once you’ve got some stocks on watch, elevate your trading game with StocksToTrade the ultimate platform for traders. With specialized tools for swing and day trading, StocksToTrade will guide you through the market’s twists and turns.
Dig into StocksToTrade’s watchlists here:





Leave a reply