
What do fashion, food, and finance all have in common? True … they all start with the letter “f,” but, more importantly, they’re all subject to trends.
Just as skinny jeans or avocado toast can quickly pop into the public eye and become the next big thing, stocks can also experience this kind of quick and meteoric rise in popularity.
Here’s the deal with trends: they don’t last forever. What goes up must come down. With stocks, that means if a price goes up rapidly, it’s likely to fall at some point.
And actually, this isn’t such a bad thing for traders. If you’re savvy and willing to do your research on stocks, both uptrends and downtrends can provide awesome opportunities to potentially grow your account.*
Ready to learn how to make the most of stock market trends? In this post, I’ll introduce you to both uptrends and downtrends, including what they are and how to trade in each scenario.
Table of Contents
What Is a Stock Trend?
Just like any other trend, a stock trend is largely based on public sentiment, novelty, and the demand for different products and services.
In the stock market, a trend can occur either in the market at large, with individual stocks, or both. Generally, a trend moves up or down until something changes and alters the trajectory.
There are three ways that the market can move: up, down, or sideways. A sideways trend means little price movement or change and doesn’t require much explanation. So let’s focus on uptrends and downtrends.
What Are Uptrends and Downtrends?

Uptrends and downtrends are pretty simple. Here’s the definition for each:
Uptrend: This describes when the price of a stock is moving upward or getting higher. An uptrend is characterized by the chart’s peaks and troughs reaching new highs as the trend progresses.
So, if you look at the chart over time, it may be zigzagging, but it’s generally going up.
Downtrend: As you probably already guessed, a downtrend is the opposite of an uptrend. It’s when a stock price is moving downward or getting lower.
The downtrend is characterized similarly to an uptrend — but in the opposite direction. The peaks and troughs in the chart continue to drop as the trend goes on.
Over time the chart may zigzag, just like the uptrend, but its general direction is down.
Uptrend Stocks vs. Downtrend Stocks
Aside from the obvious, what’s the real difference between uptrends and downtrends? Here are some key points:
Uptrends give traders the opportunity to buy low, sell high, and hopefully continue to profit until the trend reverses. Usually, traders sell the stock when the peaks and troughs no longer break new highs.
Downtrends won’t lead to profits if you like to go long, but they can be a short seller’s dream.
The process involves short selling by borrowing then quickly selling shares. The idea is that you can repurchase the shares at a lower rate as the price continues to dive, netting the difference as a profit.
Examples of Uptrend Stocks
What does an uptrend stock actually look like on a chart? Here are two examples:
#1
In this two-day chart featuring one-minute candlesticks, you can see a short-term (one-day) uptrend, with a Fibonacci retracement (the green lines) showing support and resistance at certain levels. The trend lines are shown in white.
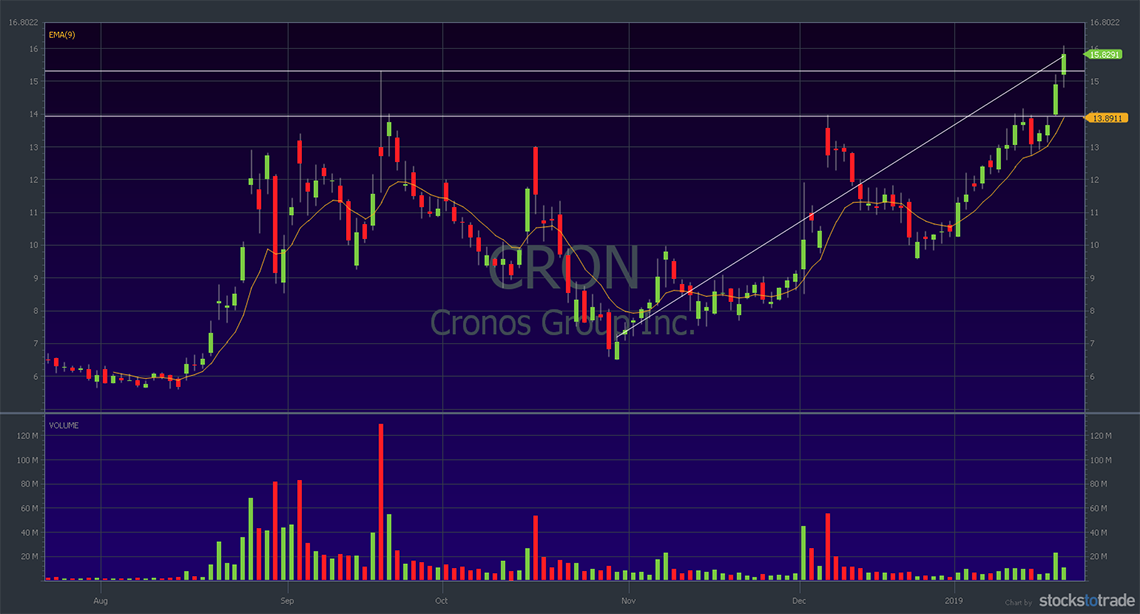
In this six-month chart featuring daily candles, you can see that the top resistance finally breaks after a few attempts (the two horizontal lines at the top). This is a longer-term uptrend, trending up last three months. The 9-period EMA (exponential moving average) is marked by the brown line, and the trend lines are in white.
Examples of Downtrend Stocks
Now, let’s look at a few examples of downtrend stock charts …
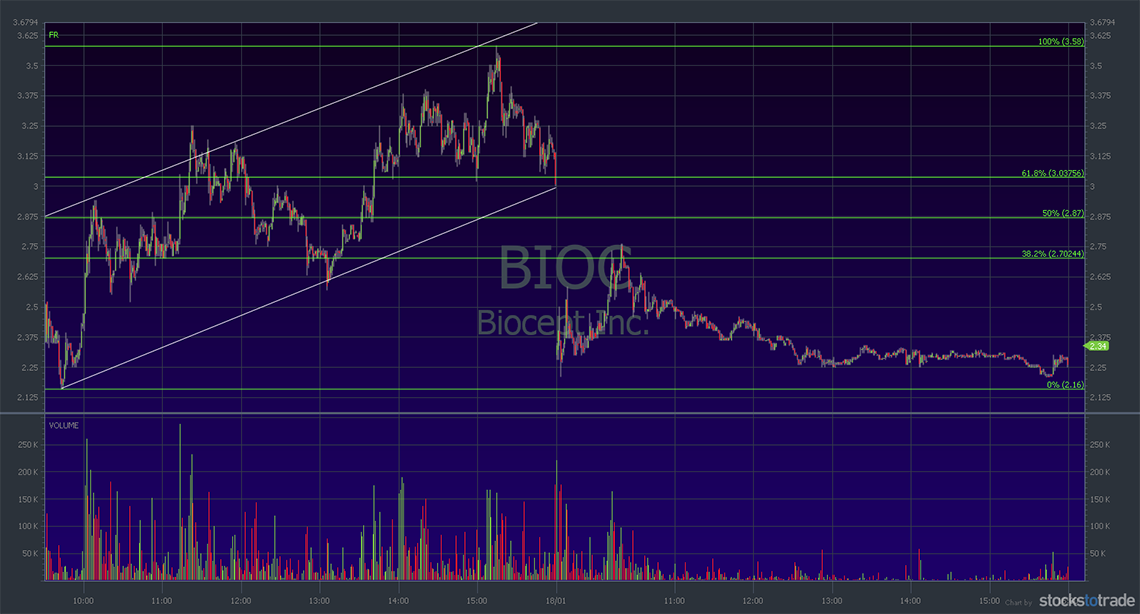
#1
This is a great example of a short-term downtrend, and you can also see a good example of support and consolidation at the 43.20 level. It’s a one-day chart featuring one-minute candlesticks and a 20-period SMA (simple moving average — the green line). The trend lines are shown in white.
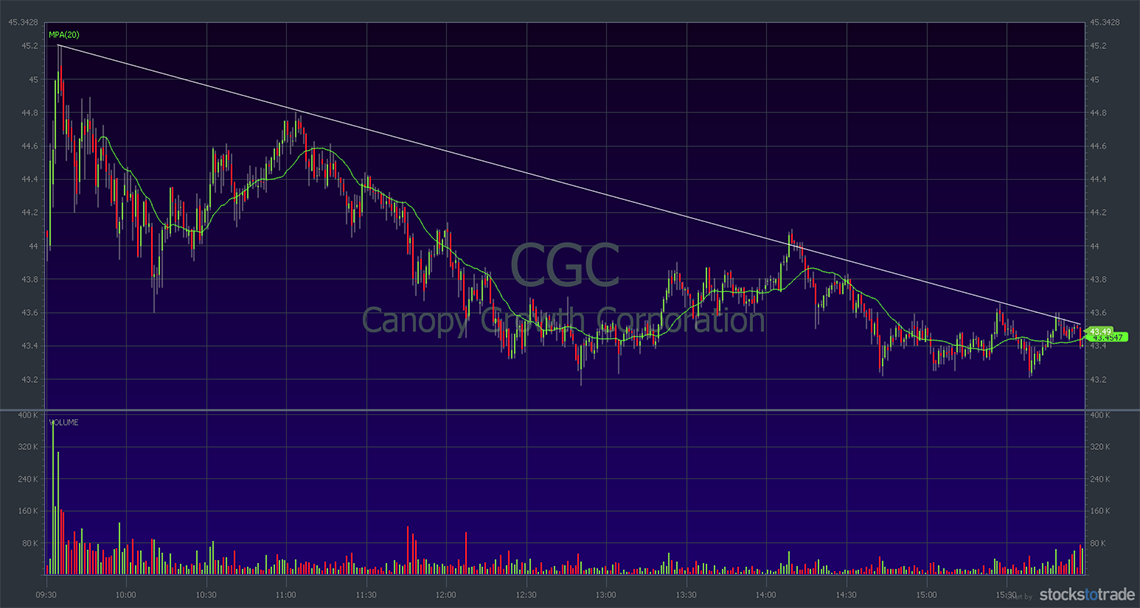
#2
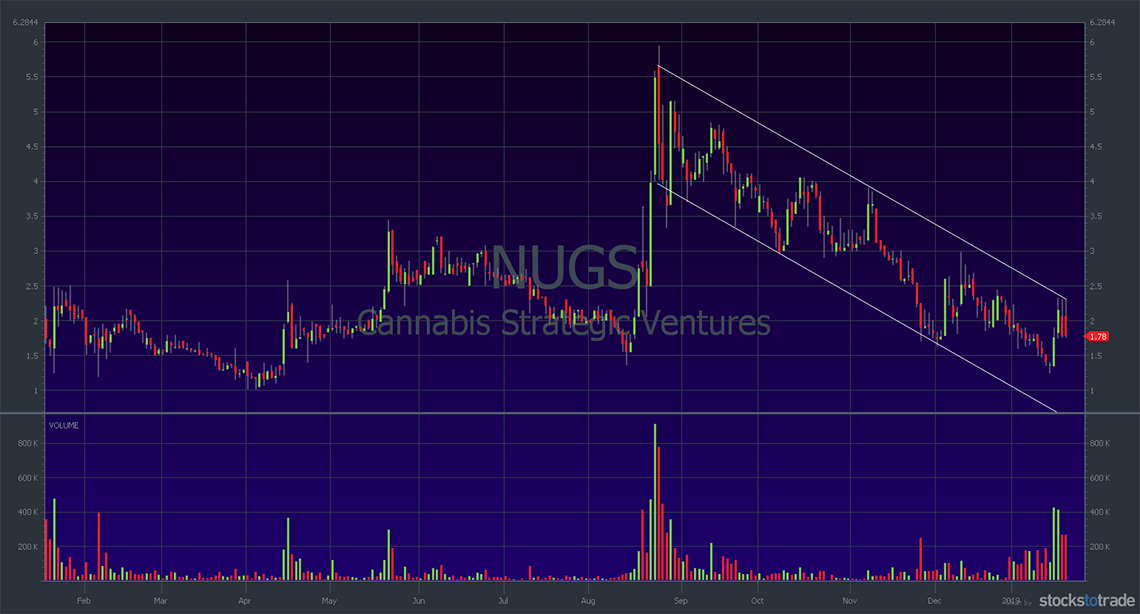
Here’s an example of a longer-term downtrend on Canopy Growth’s one-year chart with daily candlesticks. The downtrend is apparent following the August highs. The trend lines are shown in white.
How to Trade Uptrend and Downtrend Stocks
Wondering how to start trading stocks that are trending up or down? Follow these tips.
Use a Stock Screener to Find Great Stock Opportunities
How can you identify a trend? There isn’t necessarily a single uptrend stock screener tool or a “Find downtrends now” button. But there are several ways you can use a stock screener to find trends in stocks and in the market.
Downtrend and Uptrend Stock Indicators
To figure out trends, here are some of my favorite uptrend and downtrend indicators.
Higher Highs and Lower Lows Indicator
Traditionally, the way to spot an uptrend is to look for higher highs, as well as higher lows. That’s because buyers are active and driving up the price. They’re also quicker to buy in on dips.
During a downtrend, the lows tend to be lower. There are too many sellers and too little demand, so the price goes down. The highs are also lower because sellers are motivated to get rid of their stock, and buyers aren’t as keen to hold their positions.
Here are some ways to figure out if this is happening:
Line Graph: Perhaps the easiest, most readily available indicator of a trend can be found by simply looking at a stock’s chart, and particularly in line graph format.
When you look at the line graph over various periods of time, do you see a trend emerging? The timeline can vary depending on the stock, so be sure to look at a few different time frames. Ultimately, what you want to see in a line graph is definitive movement up or down.
There will be peaks and troughs in the chart, meaning it will zigzag quite a bit in short time periods. There may not appear to be any rhyme or reason to it.
But when you take a step back and look at the chart over longer periods of time, you’ll notice in an uptrend that the peaks and troughs are occurring at new highs and generally ascending upward. The opposite is true for a down-trending graph.
Moving Averages: The moving average is a super-popular indicator on platforms like StocksToTrade and with good reason: It can be very helpful in identifying trends.
During an uptrend, the price action tends to stay above the moving average. If it crosses or is very close to the moving average, the stock may be performing well, but it’s probably not in an uptrend.

However, the moving average shouldn’t be the only tool that you use. For one thing, if the trend or the market has already reversed, the moving average may not give you the best information.
Trend Lines: A lot of traders like to use trend lines as part of their trend analysis.
A trend line is a line that you create over a chart’s high pivot points or under the pivot low points to get a better read on the general direction of the price.
It may sound overly simple, but this can be a great visual indicator of support and resistance and a clue to the speed and direction of the price change.
It can also alert you to mini patterns within the pattern. Trend lines are generally better once the trend is already established — they can help you plot out your entry and exit points. They can also signal changes in a trend’s direction.
Average Directional Index: Also called ADX for short, this is a way to measure a trend’s strength.
The ADX is kind of like a three-in-one indicator. It comes with three different lines: The ADX, which can alert you to the strength of a trend, and what are called the +DI and -DI lines. DI means directional indicator.
A +DI line shows bullish strength, and a -DI line indicates bearish strength.
When you run the ADX on a stock, the general consensus is that a result of 25 and over can indicate an uptrend is happening. And a result below 25 can mean the stock may be starting to trend downward.
Pay Attention to News Catalysts
I rely mostly on charts and technical analysis to make my final trading decisions regarding trades. But that doesn’t mean I can ignore what’s happening in the news.
You have to pay attention to news catalysts. They can clue you into what might kick off a trend or what might cause it to change direction.
A news catalyst is basically any big development that can move a stock’s price, such as:
- A major news event: Right now, we’re seeing a great example of this in the medical marijuana/CBD sector. Recently, the U.S. Farm Bill passed legislation to legalize growing industrial hemp. This means that CBD or cannabidiol products (the non-psychoactive compound from the marijuana plant) are poised for massive national growth. A lot of people also view this as a harbinger of marijuana legalization. This news catalyst has had a huge effect on medical marijuana and CBD stocks. Now, this news doesn’t mean you should run out and buy any and every CBD stock out there. But it can alert you to sectors or stocks that might experience an uptrend. This can also work on the flip side if there’s a big negative catalyst. As a hypothetical example, if prohibition were put back into effect (let’s hope that never happens), it would likely have a massive negative impact on alcohol-related stocks.
- Earnings reports: Money talks. So what are the earnings like for a given stock? Many traders wait with bated breath for companies to release their quarterly earnings reports. In fact, it’s such a popular pastime that the period directly following common earnings releases is referred to as ‘earnings season.’ Earnings reports can have a big impact on stock prices and set trends in motion — or reverse them in their tracks. For instance, if a stock performs 30% better this quarter than it did the same time last year, it can cause a flurry of activity around the stock and make it trend upward. But if they report 30% lower sales with no good reason, it can quickly cause a downtrend.
- Contract winners: Partnerships and contracts can be trend makers. For example, did XYZ Tech Company just sign a contract for a big job with Apple? Did Target just make a nationwide buy for XYZ Beverage Company’s products? These are things that can have a big impact on stocks. Scan the news for noteworthy partnerships and contracts. There’s a chance they can affect stock prices, and it’s better to be the early bird to catch the worm.
- Changes in management: If a company’s C-suite (executive leaders with C in the title — CEO, CFO, CIO, etc.) experiences any big changes, it can have a big effect on a company’s stock price. And it can move in either direction. For example, say a tech company hires a former high-ranking employee from Google or other notable company. This can inspire lots of optimism and move the stock price up. But the loss of a public figure in the company can have a negative effect. For example, when longtime Starbucks CEO Howard Schultz stepped down, it made the stock trend downward for a while.
Trade Volume and Volatility

No matter how strong the uptrend or downtrend may appear based on your stock screener, you can’t just judge it by the peaks and troughs in the chart. You’ve got to consider volume and volatility, too.
Volatility refers to how fast a stock price moves up and down. The more rapid the movement, the greater the volatility.
So why does volatility matter when it comes to trending stocks? Because like any fad, a stock trend can beat a quick retreat just as fast as it started.
Remember fidget spinners or Tickle Me Elmo? They were all the rage, and then they were gone. It’s just the way trends work, and stocks aren’t necessarily any different.
Penny stocks, which I focus on, will be more volatile than higher-priced stocks as a general rule. That’s because the companies are smaller, less proven, and might be in emerging fields. They generally don’t have the stability of large-cap companies.
The volatility in price is important — it’s part of what can help you earn profits as a trader. But it’s also part of what makes trading these stocks very risky. The pendulum can swing in either direction.
When we talk about volume, that refers to the number of shares traded each day. And this can have a big effect on a stock’s liquidity.
Volatility and volume are not the same, but you need to look at them together.
You want enough volatility that you can consider making a profit in a trade, but you don’t want to get into a volatile stock that doesn’t have enough volume.
If not enough people are buying and selling shares of the stock, it can make it difficult to exit a position in a stock. This means that by the time you’re able to unload trades, the profits might not be what you were hoping for. Nobody likes getting stuck in a trade!
Don’t Trade Too Big
When it comes to trading with trends, size definitely matters.
Trends are fickle! It doesn’t matter how amazing and strong it appears to be. Never risk too much of your account on any one trade.
That’s particularly true when you’re starting out and have a small account. It can be so tempting to put all your eggs in one basket so that your trades can have an impact.
Avoid this temptation — it will lead to bad habits. That small account can quickly evaporate into nothing. So don’t get greedy.
My best words of wisdom here is to start small and scale up. Even if you move just a few dollars on trades, you’ll learn best practices. Get a solid feel for trading before you increase your position sizes.
Use these smaller trades to build your knowledge account, first and foremost. Remember: You won’t crash your account if you’re taking profits, even if they’re small.
Keep Learning
What if I told you that I have a hot tip that can help you trade trends and improve your trading career in general?
Here’s my super-sage word to the wise: keep learning.
Trading isn’t the type of job where you can memorize a few key facts and master the system. The market is a living, breathing beast. That means if you want to go anywhere near it, you have to constantly stay on your toes. You have to know what’s happening and what’s moving the market.
The best way to do that, of course, is to commit to educating yourself now and for the rest of your trading career.
I’ve been trading for decades, and I would never say that I know everything about the market. I see the power in admitting that I don’t know everything — it keeps me open to change and learning more.
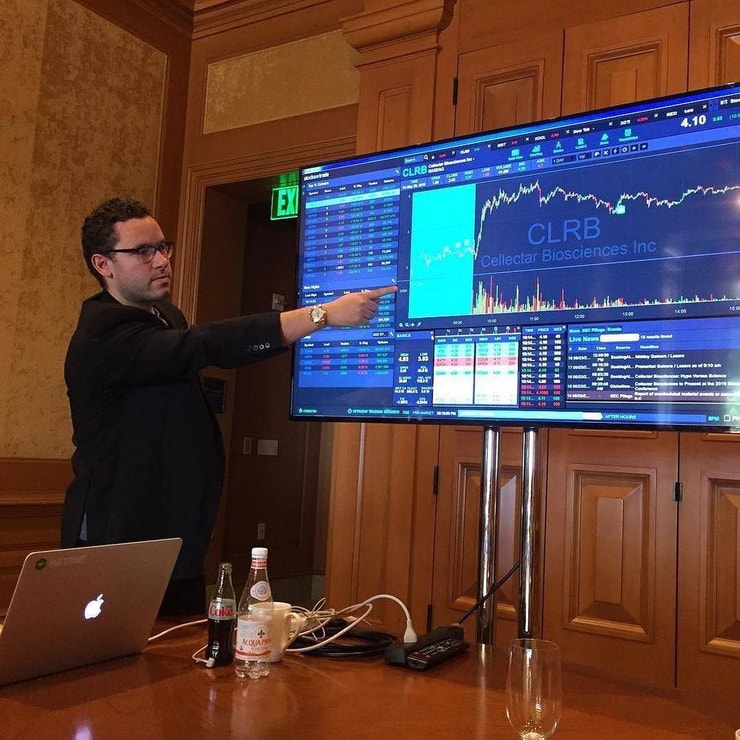
Trading Challenge
When I started out as a trader, I was hungry for knowledge. I wanted to learn as much as I could about what made stocks move so that I could hopefully become rich.
I was successful.* But I have to keep learning because the market never stays the same. To stay relevant, I need to keep learning.
This is part of why I established my Trading Challenge.

In the Challenge, I offer a comprehensive education on the market basics that every trader needs to know.
But more importantly, I teach my students how to think for themselves. I teach them my techniques for things like how to find stocks, how to make a killer watchlist, and what to look for in charts and I do that via my regular watchlist every Sunday night. This allows them to break free from the follower mindset and make intelligent trading decisions on their own.
I could give anyone hot stock tips — but to truly live up to your potential as a trader, you need to gain experience through mentoring, learning, and continuing to learn. Conclusion
Trends are part of just about every industry, from fashion to technology to finance.
In the stock market, both uptrends and downtrends can provide opportunities for traders. This can be a tempting prospect, especially for traders who want to quickly build accounts by capitalizing on these trends.
However, like any other style of trading, choosing stocks or sectors based on trends comes with its fair share of risk.
Because trends tend to be associated with volatility in stock prices, it’s extremely important to do thorough research before executing any trade. Always be cautious … you don’t want to get caught on the wrong side of the trend!
How do you trade in an uptrend or downtrend? Leave a comment and tell me about your experience!

Leave a reply