

Verra Mobility Corporation faces heightened investor concern after news, with stocks have been trading down by -16.47 percent.
What Traders Need To Know
- Multiple law firms are investigating potential corporate wrongdoing at Verra Mobility (VRRM) tied to shareholders who owned stock before 2026/02/24.
- Bronstein, Gewirtz & Grossman, LLC is probing conduct by Verra Mobility Corporation officers and directors, sharpening focus on governance risk.
- Repeated investigation headlines through October 2026 add sustained legal and reputational overhang for VRRM.
- Legal scrutiny centers on past disclosures, raising the chance of litigation that could pressure valuation.
- Short-term price action already shows sharp downside volatility that traders must factor into risk management.
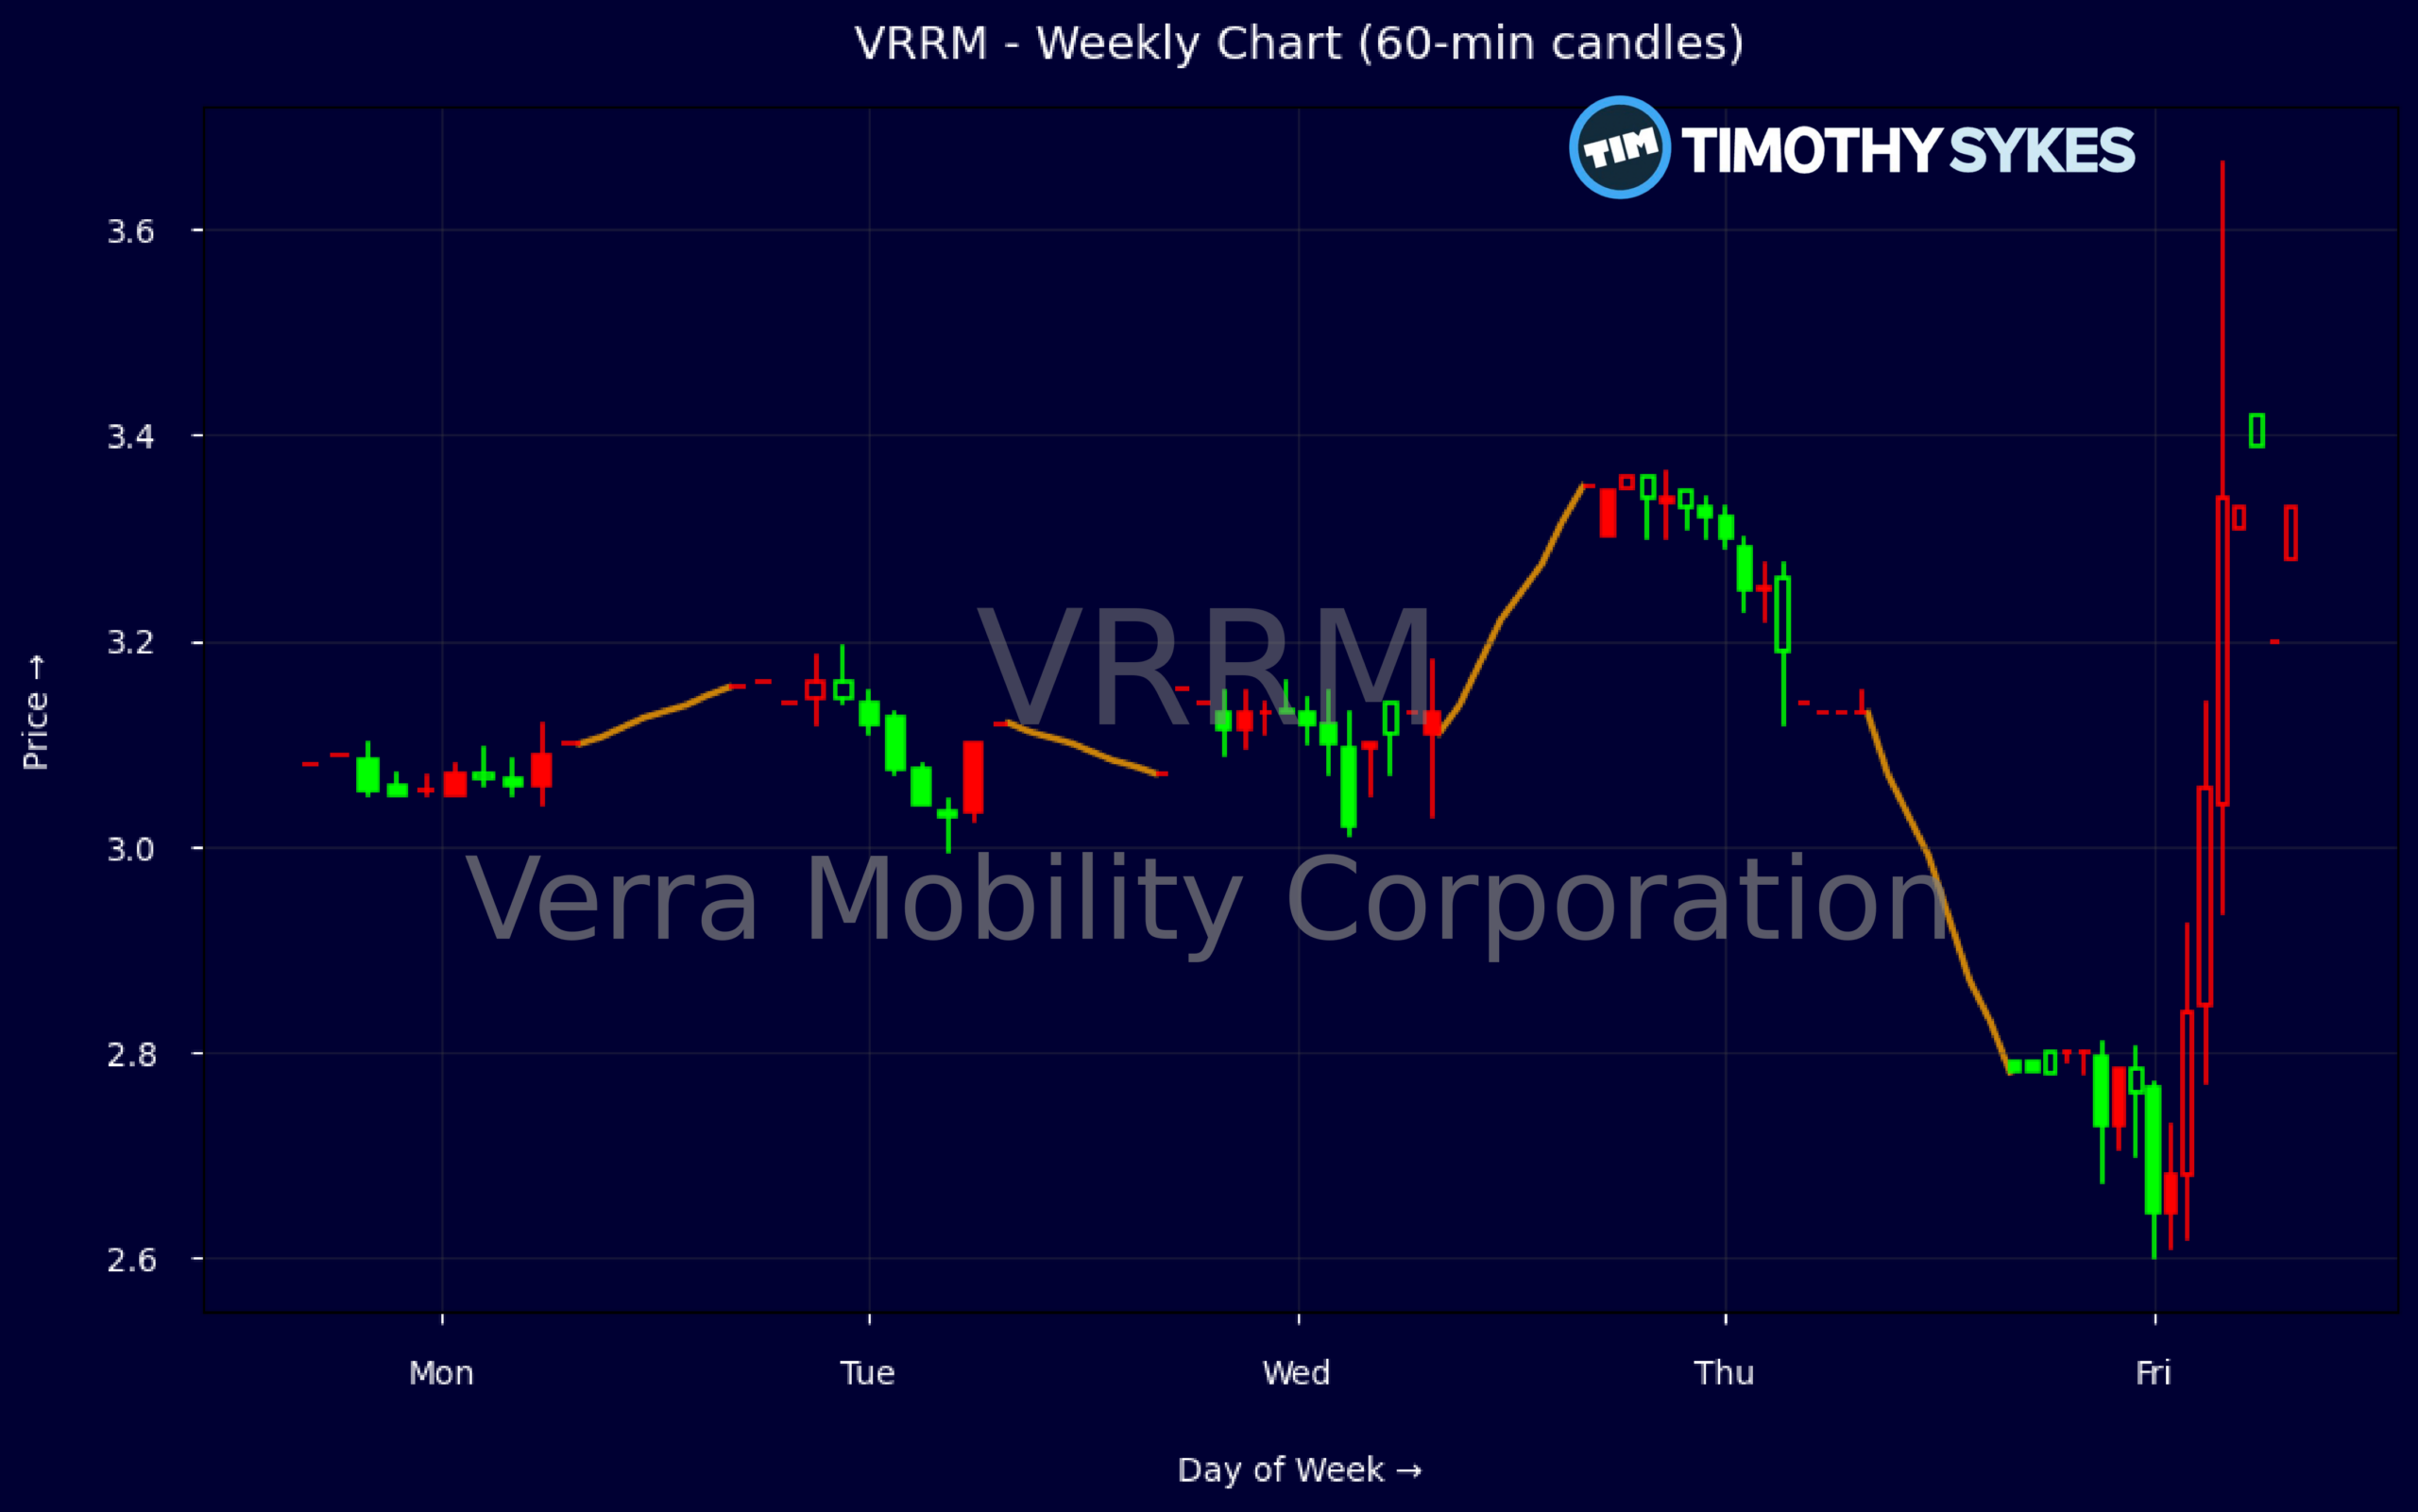
Weekly Update Oct 26 – Oct 30, 2026: On Sunday, November 01, 2026 Verra Mobility Corporation stock [NASDAQ: VRRM] is trending down by -16.47%! Discover the key drivers behind this movement as well as our expert analysis in the detailed breakdown below.
Technology industry expert:
Analyst sentiment – negative
Verra Mobility operates a niche tolling and traffic enforcement platform with quasi-recurring revenue and exceptional 90%+ gross margins, but only modest net margin (~4–5%) due to interest and below-the-line costs. Cash generation is a clear strength: Q3 operating cash flow of ~$115M and free cash flow of ~$89M versus an enterprise value of ~$1.37B implies an extremely low FCF multiple (~2–3x). However, leverage is heavy (total debt/equity ~4.9x, LT debt/capital ~83%), with intangibles and goodwill dominating assets, constraining strategic flexibility despite attractive ROE and ROIC.
Technically, the weekly tape shows a failed breakout: price jumped from ~3.07 to 3.35 then violently reversed to 2.79, indicating aggressive supply and likely headline-driven liquidation. The sharp range extension on elevated intraday volume near 3.30–3.35 now marks clear resistance and a reference zone for trapped longs. Dominant near-term trend is down. For tactical traders, 2.70–2.80 is the first high-conviction buy zone, with a tight stop just below 2.70 and a rebound target back toward 3.10.
Multiple securities-law investigations around possible corporate wrongdoing create real governance overhang and raise downside scenario risk relative to Technology and Software & IT Services peers that typically trade on growth and visibility. VRRM’s valuation discount versus sector multiples is justified until investigations are clarified or resolved. Base case: range-bound to slightly negative bias, with technical support near 2.70 and resistance at 3.30. Only speculative capital should engage; institutional-quality entry requires regulatory clarity or a durable reclaim of 3.30 on strong volume.
More Breaking News
Quick Financial Overview
Verra Mobility Corporation is facing a clash between solid operating numbers and a heavy legal overhang. On the income side, the company printed quarterly revenue around $258.9M with EBITDA near $97.1M and net income of about $40.4M as of 2026/09/30. That translates into an EBIT margin of 15.7% and an eye-catching gross margin of 90.7%, which signals a high-margin, asset-light model. For traders, these margins explain why VRRM could normally justify a reasonable earnings multiple when sentiment is clean.
On valuation, VRRM carries a price-to-earnings ratio of 11.31 and a price-to-sales ratio around 0.44, which looks cheap compared with many software-style or services peers. Enterprise value is roughly $1.37B against annual revenue of about $979.1M, underscoring that the market is not paying a rich premium for this cash flow. Free cash flow of about $89.4M in the latest quarter and operating cash flow of $114.5M support that view, with price-to-free-cash around 2.2 suggesting the stock is being discounted.
The balance sheet tells a more cautious story. Total debt to equity sits at 4.86 and the leverage ratio at 7.2, so Verra Mobility Corporation is clearly using heavy debt financing, even though interest coverage of 4.4 and a current ratio of 2.1 show it is still comfortably servicing obligations for now. Return on equity near 19.9% and ROIC near 13.6% confirm management has historically squeezed strong returns out of this structure. But with investigations into governance and disclosure practices hanging over VRRM, traders must ask whether those returns will command the same multiple going forward.
Price action is already reflecting this uncertainty. The weekly chart shows VRRM slipping from a 3.34–3.36 high down to a 2.79 close, a fast, high-range decline that lines up with October 2026 investigation headlines. The most recent candle opened at 2.8 and held a tight 2.78–2.8 range before closing at 2.79, hinting at a short-term attempt to stabilize after a sharp drop. Intraday, a 5‑minute bar with a low spike to 2.6 and a close back at 2.8 shows aggressive selling met by dip buying, a classic volatility signature around legal news.
Conclusion
This is stock news, not investment advice. Timothy Sykes News delivers real-time stock market news focused on key catalysts driving short-term price movements. Our content is tailored for active traders and investors seeking to capitalize on rapid price fluctuations, particularly in volatile sectors like penny stocks. Readers come to us for detailed coverage on earnings reports, mergers, FDA approvals, new contracts, and unusual trading volumes that can trigger significant short-term price action. Some users utilize our news to explain sudden stock movements, while others rely on it for diligent research into potential investment opportunities.
Dive deeper into the world of trading with Timothy Sykes, renowned for his expertise in penny stocks. Explore his top picks and discover the strategies that have propelled him to success with these articles:
- Penny Stocks Trading Guide
- Best Penny Stocks Under $1 to Buy Today
- Top 8 Penny Stocks to Watch on Robinhood
Once you’ve got some stocks on watch, elevate your trading game with StocksToTrade the ultimate platform for traders. With specialized tools for swing and day trading, StocksToTrade will guide you through the market’s twists and turns.
Dig into StocksToTrade’s watchlists here:





Leave a reply