

ClearOne Inc. surges as strong earnings outlook fuels bullish sentiment, and its stocks have been trading up by 66.57 percent.
Key Takeaways
- CLRO has exploded from the low $2s to above $6 in days, then faded toward the mid-$3s, signaling extreme volatility and active day trading flows.
- Daily candles on CLRO show big wicks and wide ranges, a classic sign of momentum blow‑off and profit taking after a parabolic spike.
- ClearOne Inc. financials reveal shrinking revenue, negative equity, and ongoing losses, so recent CLRO strength is driven more by trading momentum than fundamentals.
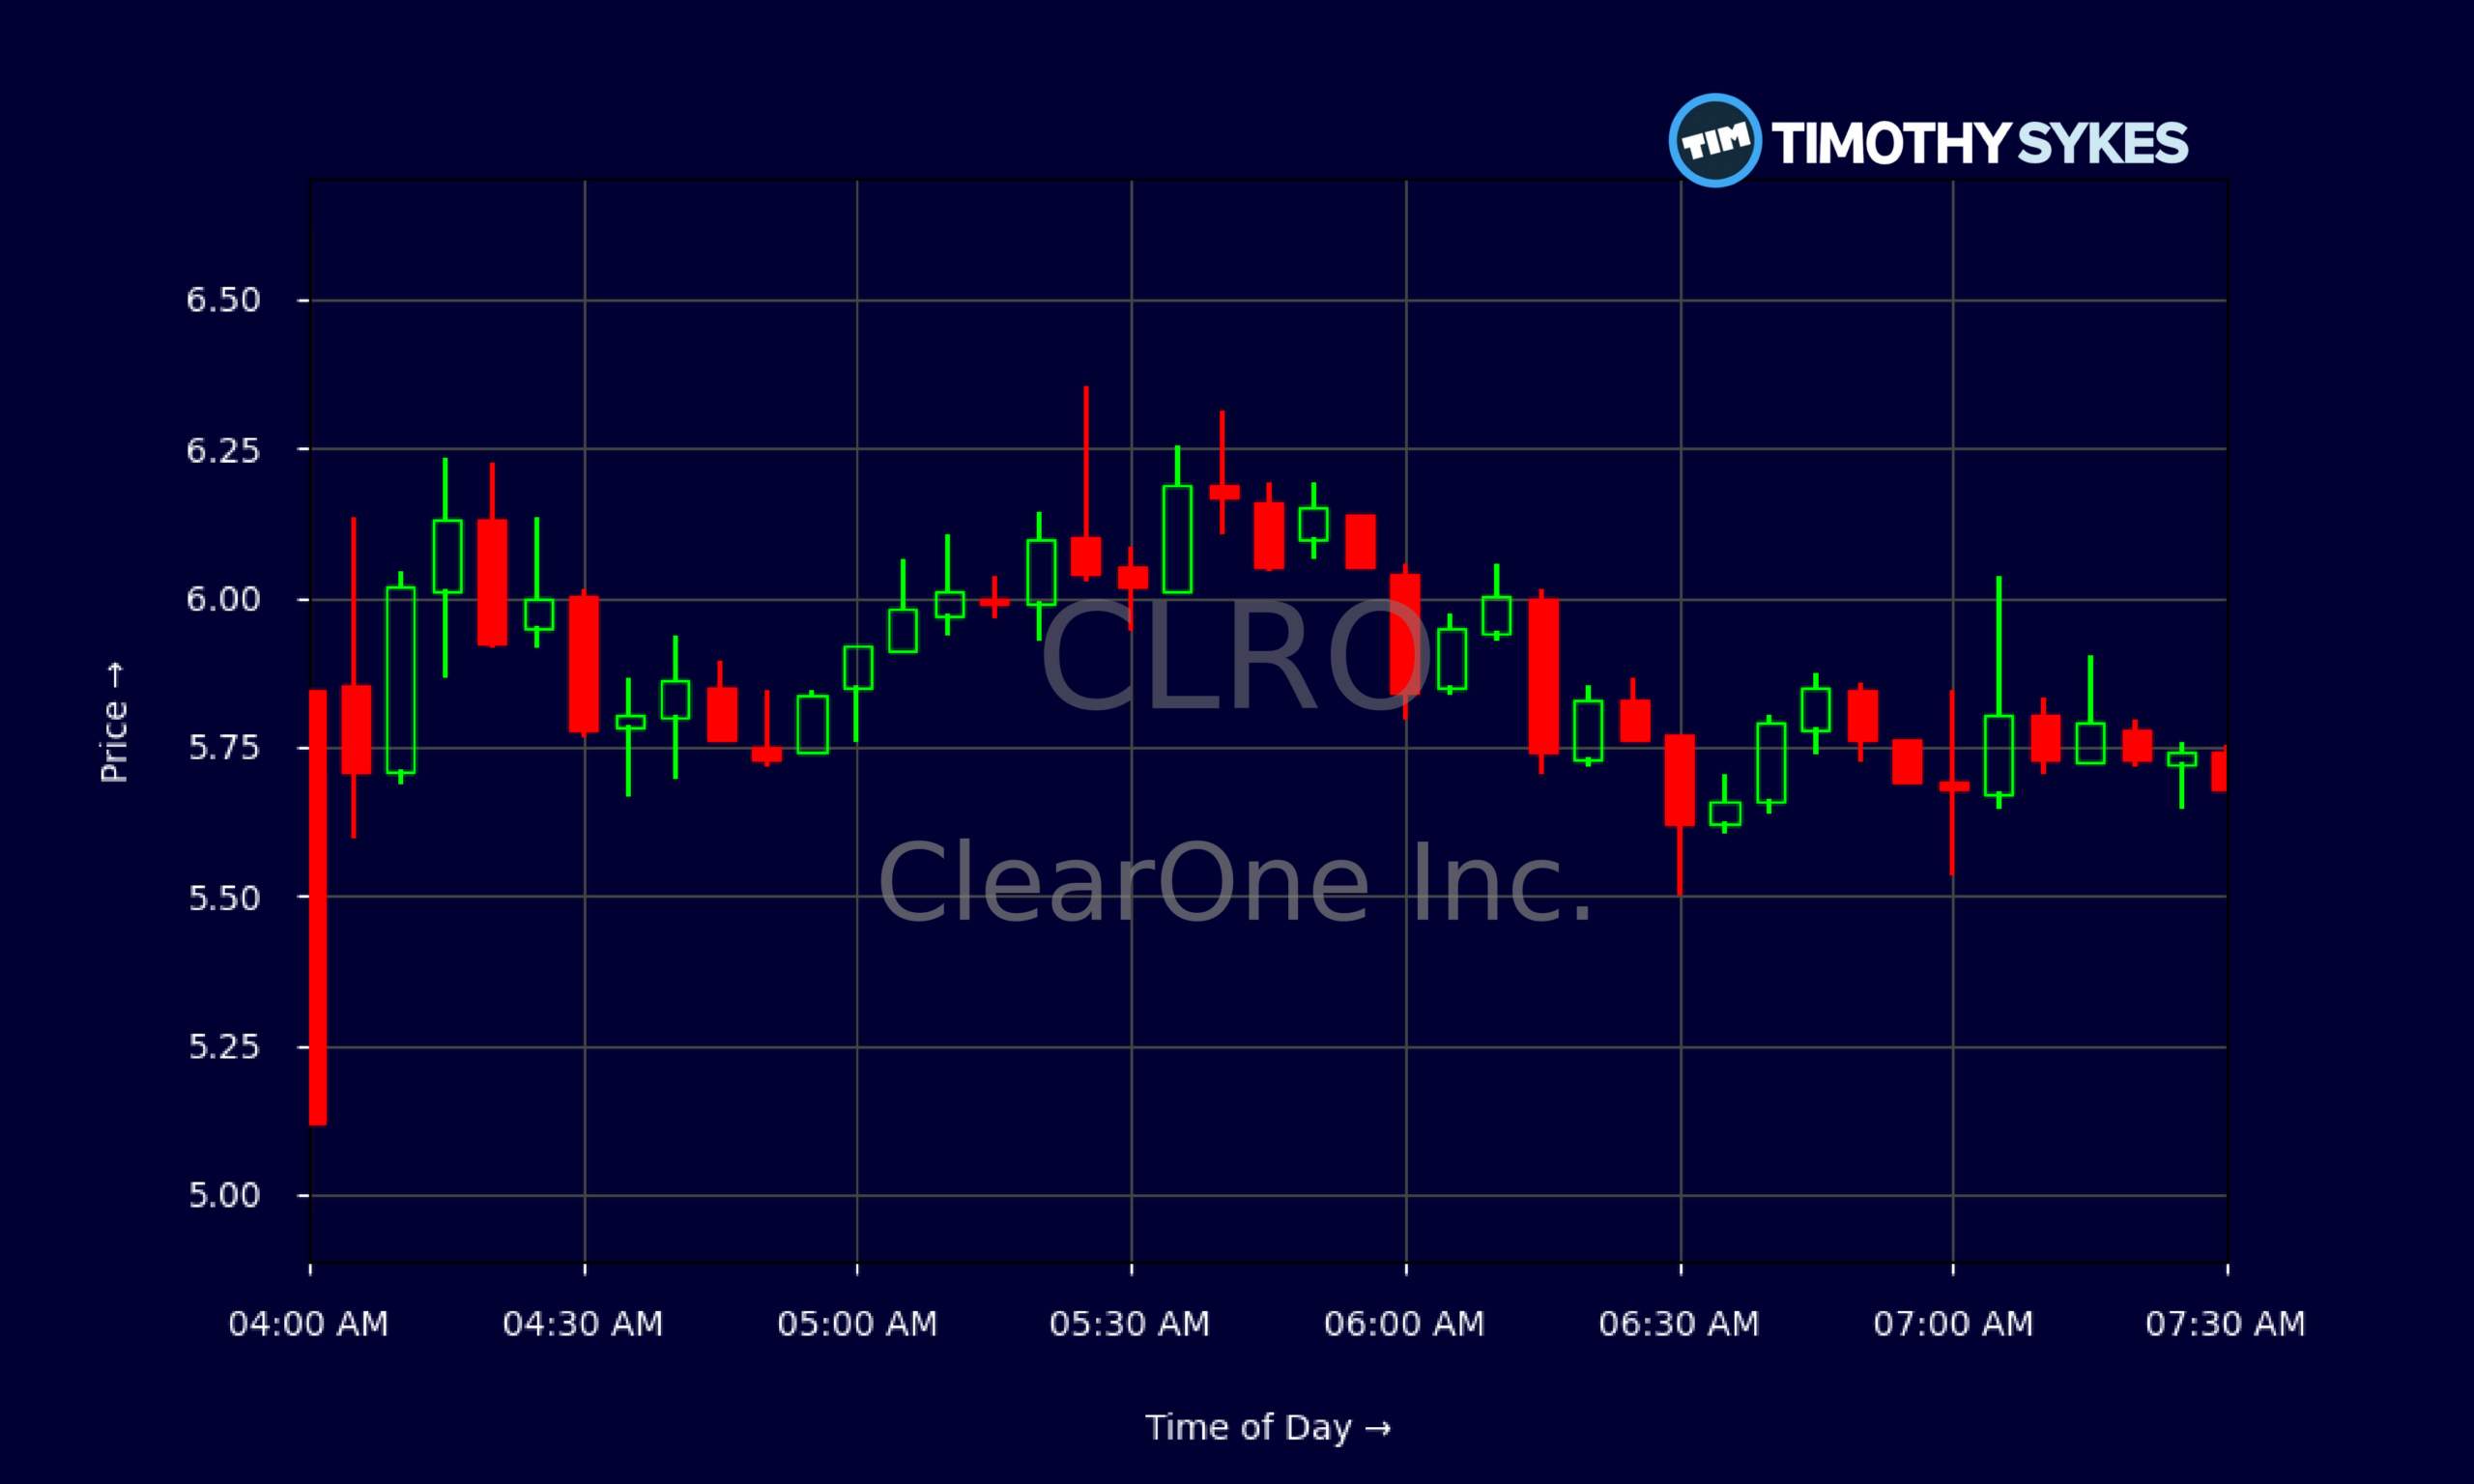
- Intraday CLRO action shows sharp moves between $5.50 and $6.30, offering opportunities for disciplined scalpers but punishing late chasers.
- Traders are watching whether CLRO can hold above recent breakout zones or retest prior support near $3 as momentum cools.
Live Update At 07:33:12 EST: On Monday, November 02, 2026 ClearOne Inc. stock [NASDAQ: CLRO] is trending up by 66.57%! Discover the key drivers behind this movement as well as our expert analysis in the detailed breakdown below.
Quick Financial Overview
ClearOne Inc., traded as CLRO, is acting like a pure momentum play on the chart, but the financials tell a tougher story. The latest quarterly report shows CLRO posting about -$0.34 in earnings per share, with net income of roughly -$914,000. That is not a small loss for a company with only about 2,675,412 shares outstanding.
Revenue trends look weak. Key ratios show revenue growth over 3 and 5 years at roughly -100%, meaning CLRO has seen a major sales collapse over time. Gross profit last quarter was actually negative, around -$70,000, which means ClearOne Inc. did not even cover its direct costs of producing and delivering its products.
More Breaking News
On the balance sheet, CLRO shows total assets near $990,000 and total liabilities around $1,371,000, leaving stockholders’ equity at roughly -$381,000. That negative equity is a red flag for longer‑term stability. Current assets of about $976,000 barely cover current liabilities of $929,000, giving a current ratio near 1.1. Cash is tight, with only about $75,000 in cash and $447,000 in restricted cash, while short‑term debt sits at $500,000. For traders, that mix screams “speculative,” not “steady.”
Why Traders Are Watching CLRO Price Action
CLRO has turned into a classic momentum battleground. On the daily chart, ClearOne Inc. sprinted from under $2 on 2026/10/22 to intraday highs above $6 just a few sessions later. That is a multi‑hundred‑percent move in a tiny float name with weak fundamentals. Traders are not buying CLRO for its balance sheet; they are trading the volatility.
Look closely at the daily candles. On 2026/10/23, CLRO opened near $1.97 and closed at $3.25 after tagging $4.685 — a monster range and proof of aggressive dip buying. Over the next days, ClearOne Inc. pushed to highs of $6.23 on 2026/10/27, only to close under $5 on some sessions and eventually slide to $3.41 by 2026/10/30. That pattern — big run, tall wicks, and then lower closes — usually signals momentum exhaustion and increased selling pressure.
The intraday 5‑minute data backs that up. CLRO swung between roughly $4.97 and $6.62 in a single session, with constant moves of $0.30 to $0.60 in minutes. Scalpers love this. Late buyers get smoked. ClearOne Inc. keeps offering sharp pops toward $6+ that fail quickly, suggesting shorts are active and longs are taking profits into strength.
For active traders, the key zones are clear. Recent highs above $6.50 mark heavy resistance. The $5 area has acted as a short‑term pivot. Below that, prior support in the $3s from the first big surge becomes the line in the sand. CLRO remains on many watchlists because this type of chart often delivers secondary spikes — but only for those who respect the risk.
Conclusion
CLRO is the kind of stock that rewards preparation and punishes hope. ClearOne Inc. shows shrinking revenue, negative equity, and quarterly losses, so any sustained uptrend must fight against a weak fundamental base. Yet CLRO’s chart is exactly what short‑term traders hunt: huge percentage swings, big intraday ranges, and clear technical levels to trade around.
The recent surge from sub‑$2 to above $6, followed by a fade back into the $3s and $5s, tells a simple story. Early, disciplined traders in CLRO who bought near support and sold into strength had a field day. Chasers near the highs are now bag‑holding or forced to cut for steep losses. That is the textbook pattern around parabolic moves in thin names like ClearOne Inc. As millionaire penny stock trader and teacher Tim Sykes says, “Embrace the journey, the ups and downs; each mistake is a lesson to improve your strategy.” In volatile setups like CLRO, that mindset helps traders treat every win and loss as data to refine their trading edge.
Going forward, traders will be tracking whether CLRO can build a base above $3–$4 and stage another push, or whether supply overwhelms demand and drags price back toward earlier levels. As Tim Sykes loves to say, “Patterns repeat, but you have to study them before the spike, not after.” For anyone watching CLRO, the lesson is clear — focus on the chart, respect the volatility, and always manage risk first.
This is stock news, not investment advice. Timothy Sykes News delivers real-time stock market news focused on key catalysts driving short-term price movements. Our content is tailored for active traders and investors seeking to capitalize on rapid price fluctuations, particularly in volatile sectors like penny stocks. Readers come to us for detailed coverage on earnings reports, mergers, FDA approvals, new contracts, and unusual trading volumes that can trigger significant short-term price action. Some users utilize our news to explain sudden stock movements, while others rely on it for diligent research into potential investment opportunities.
Dive deeper into the world of trading with Timothy Sykes, renowned for his expertise in penny stocks. Explore his top picks and discover the strategies that have propelled him to success with these articles:
- Penny Stocks Trading Guide
- Best Penny Stocks Under $1 to Buy Today
- Top 8 Penny Stocks to Watch on Robinhood
Once you’ve got some stocks on watch, elevate your trading game with StocksToTrade the ultimate platform for traders. With specialized tools for swing and day trading, StocksToTrade will guide you through the market’s twists and turns.
Dig into StocksToTrade’s watchlists here:





Leave a reply