

Tidewater Inc. stocks have been trading up by 8.2 percent after positive offshore energy contract wins boosted investor optimism.
Key Takeaways
- TDW is grinding higher, closing at $86.07 after a steady multi-day uptrend from the low $80s.
- Strong cash of about $613.5M and moderate debt near $647.5M give Tidewater Inc. solid financial flexibility for offshore cycles.
- TDW shows healthy profitability, with roughly 18% net margins and double-digit returns on equity, backing the current valuation.
- Intraday TDW trading showed tight action between $80 and $86, signaling consolidation after a strong push.
- Traders are tracking TDW’s $80–$88 range as a key battleground for the next momentum move.
Live Update At 16:46:58 EDT: On Friday, October 23, 2026 Tidewater Inc. stock [NYSE: TDW] is trending up by 8.2%! Discover the key drivers behind this movement as well as our expert analysis in the detailed breakdown below.
Quick Financial Overview
Tidewater Inc. is not trading like a weak name. TDW has climbed from around $80 to just over $86 in recent days, holding near the top of its recent range. That price action tells traders the market respects the underlying numbers.
Revenue over the last year sits near $1.35B, and TDW is turning that into solid profit. Net margins around 18% and an EBIT margin near 5% show Tidewater Inc. is not just growing sales, it is keeping a meaningful slice as earnings. For a cyclical marine and offshore player, that matters.
On valuation, TDW trades at a price-to-earnings ratio near 17 and a price-to-sales ratio around 3.2. Those are not penny-stock numbers; the market is pricing TDW like a real business with staying power. The price-to-book ratio around 3 and price-to-cash-flow near 16 confirm that traders are willing to pay a premium for Tidewater Inc.’s current cash generation and asset base.
More Breaking News
Add a current ratio of 3.6 and quick ratio of 3.4, and TDW looks well-positioned to handle rough waters while still funding growth.
Why Traders Are Watching TDW Price Action
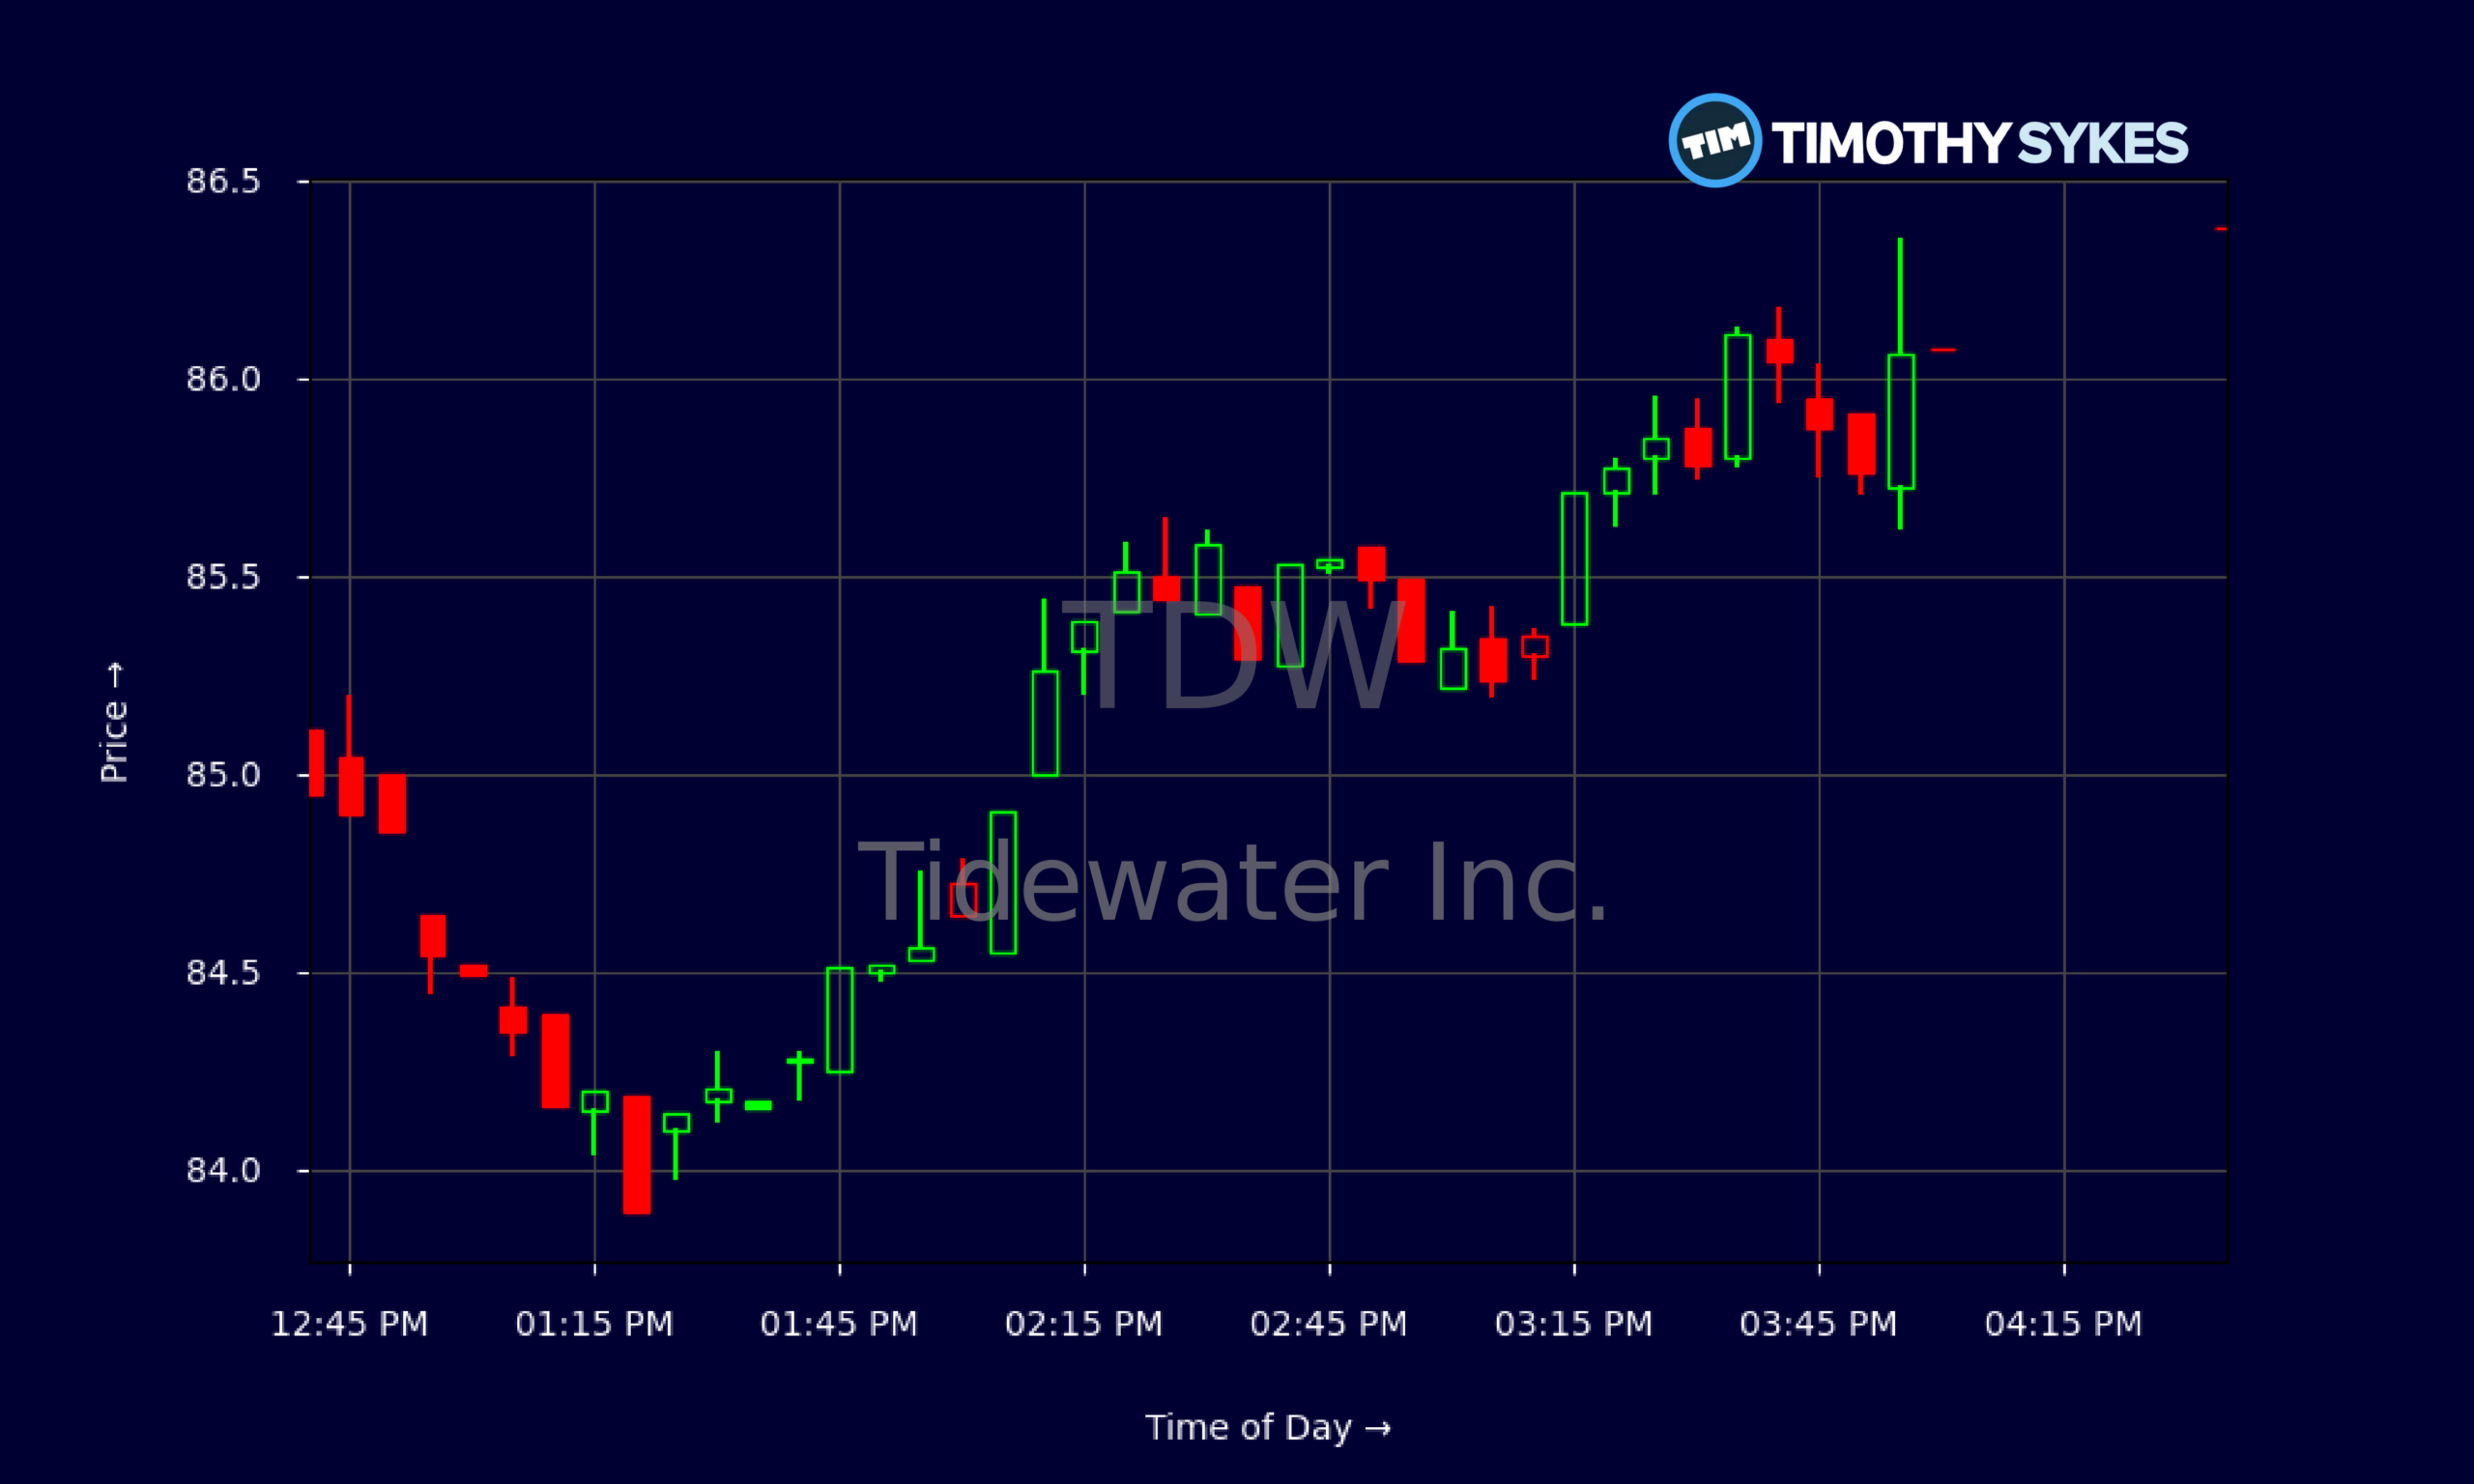
TDW’s chart is doing exactly what experienced traders like to see after a strong run. Tidewater Inc. has pushed from the low $80s to the mid-$80s, with the most recent close at $86.07 after tagging an intraday high of $86.35. That new push above prior closes around $82–$84 shows follow-through buying, not just a one-day spike.
Zoom in to the 5-minute chart and the story becomes clearer. TDW opened near $79.61, dipped briefly, then reclaimed $80 and never looked back. From late morning through the close, Tidewater Inc. stair-stepped higher in a controlled grind, trading mostly between $83 and $86, with higher lows and measured pullbacks. That is classic consolidation after strength, not panic-driven volatility.
For short-term traders, that intraday structure in TDW suggests dip-buyers are active and shorts are not in control. For swing traders, the multi-day pattern is a tight channel from roughly $80 on the downside to $88 on the upside. Every time TDW has tested the high $70s or low $80s, demand has shown up.
Underneath that chart, the fundamentals back the move. Tidewater Inc. just printed quarterly revenue of about $342.3M with net income around $21.7M. EBITDA north of $100M and free cash flow near $52.1M for the quarter show TDW is turning operations into real cash, not just accounting profit. That combination of sturdy price action and improving cash flow is exactly why traders keep TDW on their watchlists.
Conclusion
The real edge with TDW right now is the alignment between the numbers and the chart. Tidewater Inc. is throwing off cash, growing revenue at a solid clip, and producing double-digit returns on equity. At the same time, TDW is trading near the upper part of its recent range, grinding instead of chopping wildly. That usually signals accumulation, not distribution.
Tidewater Inc. ended the quarter with roughly $616M in cash and short-term investments and about $648M of long-term debt. The debt-to-equity ratio around 0.47 and interest coverage of 2.4 times show TDW is leveraged, but not dangerously. For a capital-heavy business, that is a workable structure, especially with operating cash flow around $67M for the quarter.
For active traders, the key levels are clear. On the downside, the low $80s area is the first line in the sand. On the upside, recent highs around $88 are the breakout zone. TDW holding above $80 while revenue trends and margins stay strong keeps the bullish thesis intact.
As Tim Sykes often says, “The chart tells you the truth long before the press release ever does.” As millionaire penny stock trader and teacher Tim Sykes, says, “Preparation plus patience leads to big profits.”. With TDW, Tidewater Inc.’s chart and cash flows are telling the same story. Traders who respect risk, study this price action, and react to what TDW actually does — not what they hope it will do — will be best positioned to learn from this setup.
This is stock news, not investment advice. Timothy Sykes News delivers real-time stock market news focused on key catalysts driving short-term price movements. Our content is tailored for active traders and investors seeking to capitalize on rapid price fluctuations, particularly in volatile sectors like penny stocks. Readers come to us for detailed coverage on earnings reports, mergers, FDA approvals, new contracts, and unusual trading volumes that can trigger significant short-term price action. Some users utilize our news to explain sudden stock movements, while others rely on it for diligent research into potential investment opportunities.
Dive deeper into the world of trading with Timothy Sykes, renowned for his expertise in penny stocks. Explore his top picks and discover the strategies that have propelled him to success with these articles:
- Penny Stocks Trading Guide
- Best Penny Stocks Under $1 to Buy Today
- Top 8 Penny Stocks to Watch on Robinhood
Once you’ve got some stocks on watch, elevate your trading game with StocksToTrade the ultimate platform for traders. With specialized tools for swing and day trading, StocksToTrade will guide you through the market’s twists and turns.
Dig into StocksToTrade’s watchlists here:





Leave a reply