

Mosaic Company (The) stocks have been trading up by 3.3 percent after upbeat fertilizer demand news lifted investor confidence.
What Traders Need To Know
- USDA announced $1.34B in fertilizer investments to expand U.S. supply, which may indirectly affect The Mosaic Company ecosystem and future pricing.
- Barclays cut its price target on MOS to $22 from $26, while the broader analyst group still sits overweight with a mean target near $26.
- Mizuho also trimmed its MOS target to $22 from $25, reinforcing $22 as a key sentiment line even as consensus stays around $25.99.
- The company is keeping its quarterly dividend at $0.22 per share, payable on 2026/12/18 to holders of record on 2026/12/04.
- Leadership is shifting as EVP of Operations Karen Swager transitions toward a 2027 retirement, with Walt Precourt taking the EVP role on 2026/12/01 and Swager staying on as senior advisor.
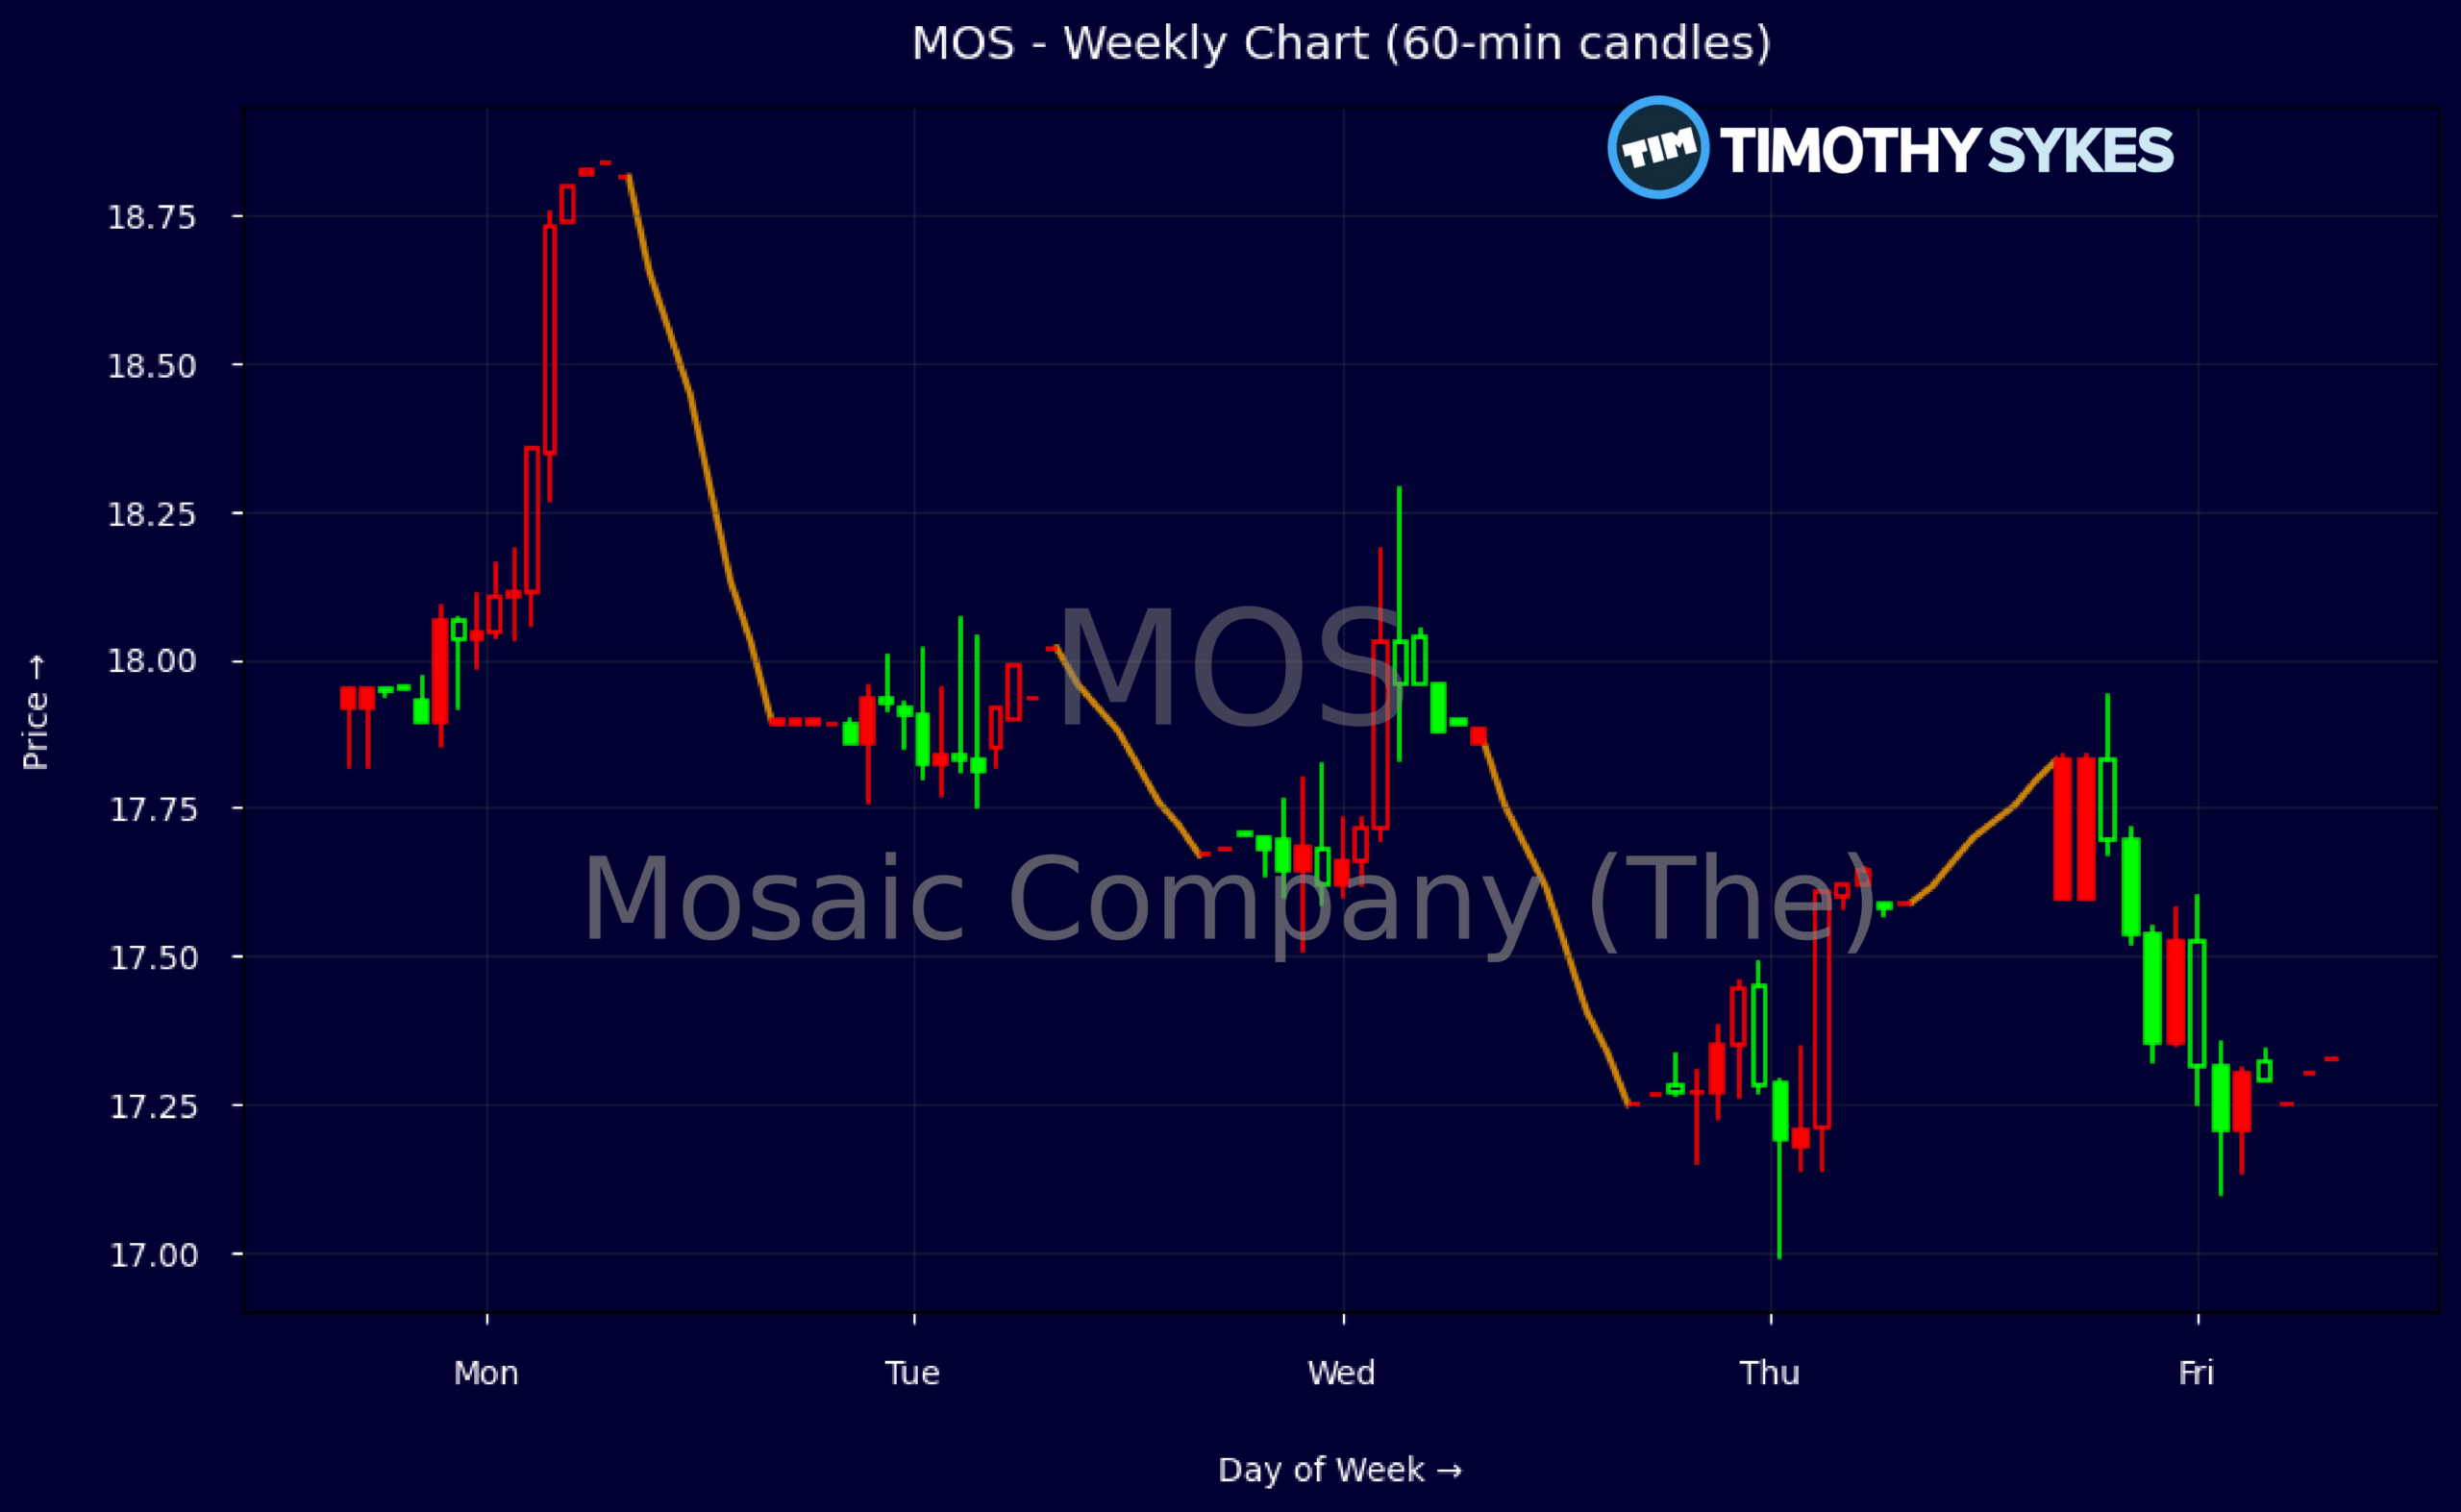
Weekly Update Oct 19 – Oct 23, 2026: On Friday, October 23, 2026 Mosaic Company (The) stock [NYSE: MOS] is trending up by 3.3%! Discover the key drivers behind this movement as well as our expert analysis in the detailed breakdown below.
Materials industry expert:
Analyst sentiment – positive
Mosaic is a scale phosphate and potash producer trading at distressed valuation levels: ~0.5x sales and ~0.5x book, with EV well below replacement value of its asset base. Fundamentals are cyclically weak: gross margin ~11%, EBIT margin negative on an LTM basis with quarterly EBIT of -$224M and net loss of $273M. Revenue has contracted ~10% over three years, and ROE/ROIC have slipped negative, though leverage is manageable (D/E 0.54, interest coverage 6.3x) and liquidity adequate but tight (current ratio 1.3, quick ratio 0.1). Free cash flow was negative this quarter due to inventory build and capex, yet the 5.1% dividend yield appears covered by operating cash flow and balance sheet capacity in the near term.
Technically, MOS is in a grinding downtrend with failed attempts to hold the high-$17s. This week’s action shows successive lower closes from $17.92 to $17.25 before a weak bounce to $17.60, indicating persistent supply near $18 and lack of aggressive dip buying. Intraday 5‑minute candles show fading rallies on light-to-moderate volume, suggesting distribution rather than accumulation. The dominant trend is bearish; a specific actionable level is $17.20–17.25 support. Below $17.20 on convincing volume, short setups targeting the mid‑$16s are favored; upside trades should wait for a weekly close back above $18.00 to confirm a reversal.
Near term, sector fundamentals remain pressured by fertilizer pricing, and recent USDA funding for new capacity slightly detracts from long‑run pricing power despite infrastructure benefits. Management transitions (Swager’s phased retirement, Precourt’s expanded role) are orderly and should not disrupt operations, while the maintained $0.22 quarterly dividend underlines financial discipline and income support. Street targets have compressed to ~$22–26 but remain well above spot, reflecting deep value versus Materials and Ag peers. I see risk/reward as skewed positively for patient investors, with tactical resistance at $19.50 and support at $17.00; 12‑ to 18‑month fair value is $23–25 assuming mid‑cycle margins.
More Breaking News
Quick Financial Overview
The Mosaic Company (The) is trading in a tight near‑term range, with recent weekly closes clustered around $17.25–$17.92. Intraday tape on the latest session shows a grind higher from the low $17.20s in the morning to a late‑day push above $17.80, before settling near $17.60. That intraday pattern is a slow accumulation day, not a breakout — higher lows through midday, but clear selling into the high $17.80s.
Fundamentally, MOS sits in a challenged but not broken spot. Trailing 12‑month revenue is about $12.05B, yet profit margins have slipped into the red, with total profit margin a little over -5%. Return on equity and recent return on capital are negative, reflecting pressure on fertilizer pricing and one‑off charges. At the same time, the balance sheet is not distressed: debt‑to‑equity around 0.54, interest coverage above 6, and a current ratio of 1.3 give management some room to work.
Valuation and cash return stand out. With price‑to‑sales near 0.49 and price‑to‑book around 0.52, traders are clearly pricing MOS like a cyclical laggard, not a growth name. The dividend yield is a bit above 5% on an annualized $0.88 rate, and management just affirmed the $0.22 quarterly payout, even after posting a recent quarterly net loss of about $273M and negative free cash flow of roughly $153M. That mix — low multiples, negative near‑term earnings, but a held dividend — helps explain why analysts remain overweight but are trimming price targets.
Conclusion
This is stock news, not investment advice. Timothy Sykes News delivers real-time stock market news focused on key catalysts driving short-term price movements. Our content is tailored for active traders and investors seeking to capitalize on rapid price fluctuations, particularly in volatile sectors like penny stocks. Readers come to us for detailed coverage on earnings reports, mergers, FDA approvals, new contracts, and unusual trading volumes that can trigger significant short-term price action. Some users utilize our news to explain sudden stock movements, while others rely on it for diligent research into potential investment opportunities.
Dive deeper into the world of trading with Timothy Sykes, renowned for his expertise in penny stocks. Explore his top picks and discover the strategies that have propelled him to success with these articles:
- Penny Stocks Trading Guide
- Best Penny Stocks Under $1 to Buy Today
- Top 8 Penny Stocks to Watch on Robinhood
Once you’ve got some stocks on watch, elevate your trading game with StocksToTrade the ultimate platform for traders. With specialized tools for swing and day trading, StocksToTrade will guide you through the market’s twists and turns.
Dig into StocksToTrade’s watchlists here:





Leave a reply