

TeraWulf Inc. stocks have been trading down by -7.84 percent after bearish sentiment over its latest cryptocurrency mining expansion.
Key Takeaways
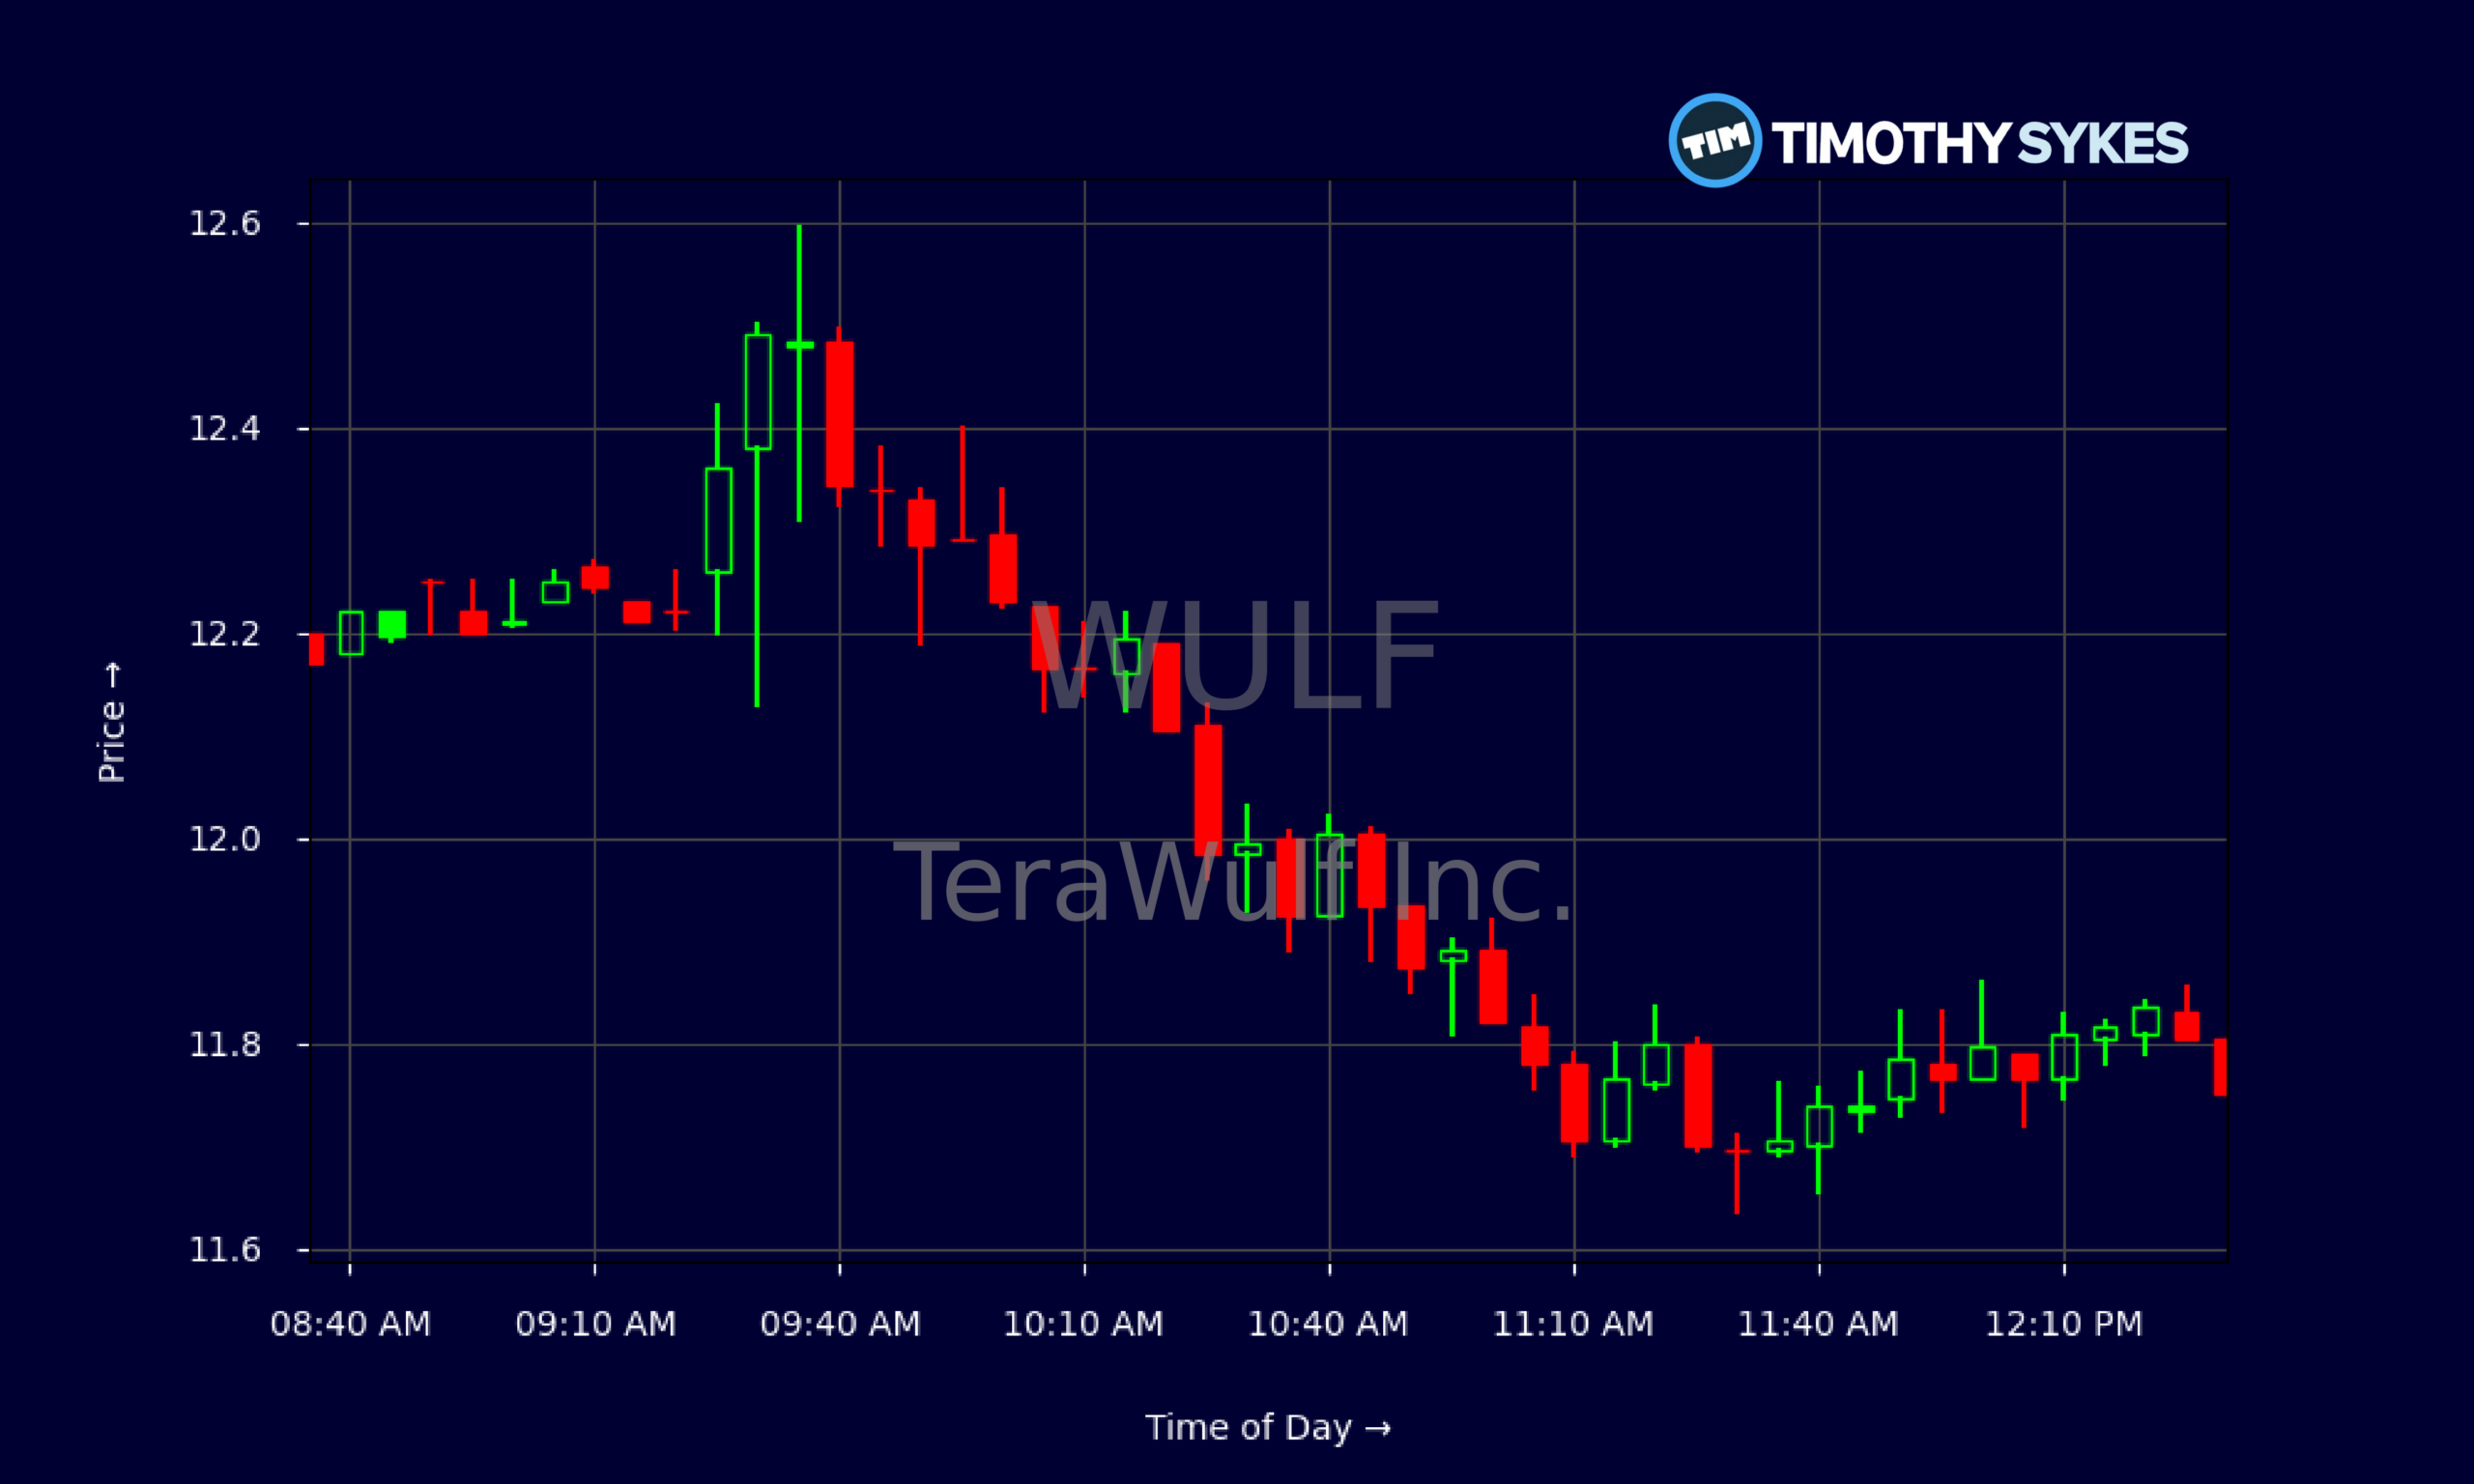
- Price action in WULF shows a steady pullback from early‑month highs, with recent trading stuck in a tight range near $11.75.
- Volatility remains elevated as WULF intraday charts show early selling pressure followed by mid‑day consolidation.
- TeraWulf Inc. posts strong revenue growth but massive net losses, signaling a high‑risk, high‑reward profile for traders.
- Heavy capital spending and negative free cash flow show WULF is still in build‑out mode, not yet in harvest mode.
- Balance sheet data suggests TeraWulf Inc. has cash to operate, but weak liquidity ratios keep risk firmly on the table.
Live Update At 12:32:30 EDT: On Thursday, October 22, 2026 TeraWulf Inc. stock [NASDAQ: WULF] is trending down by -7.84%! Discover the key drivers behind this movement as well as our expert analysis in the detailed breakdown below.
Quick Financial Overview
WULF is trading like a classic high‑beta story stock. Over the last few weeks, TeraWulf Inc. has slid from the mid‑$15s down into the high‑$11s, with the latest close near $11.75. That’s a sharp pullback, but not a crash, and traders who watch WULF daily can see the trend: lower highs, lower lows, and now a fight to find support.
The financials explain why the tape looks this way. TeraWulf Inc. posted about $168.5M in revenue, and three‑ to five‑year growth rates are huge. But WULF is spending much more than it brings in. Net income last quarter was roughly -$939.9M and free cash flow around -$992.3M. That’s a massive burn.
More Breaking News
WULF also shows an 84.3% gross margin, which tells traders the core business can be lucrative if scaled correctly. But profit margins are deeply negative, and returns on equity and assets are buried far below zero. Add a price‑to‑sales ratio above 40 and price‑to‑book in the mid‑40s, and TeraWulf Inc. looks richly valued relative to its fundamentals. For momentum traders, that combination can fuel big moves both ways.
Why Traders Are Watching WULF Price Action
The chart is the truth, and right now WULF is telling a story of exhaustion and consolidation. After topping near $16 earlier in the month, TeraWulf Inc. has marched steadily lower, with daily closes slipping from the $15 area down into the $11–$12 zone. For short‑term traders, that’s a clean downtrend with potential bounce setups if support holds.
Look at the intraday 5‑minute chart. WULF opened strong near $12.49, quickly pushed to an early high around $12.60, then sold off through the morning. By mid‑day, TeraWulf Inc. crawled into a tight band around $11.75–$11.85. That kind of fade‑and‑flat pattern often shows profit taking from longs and cautious short‑covering, not aggressive new buying.
At the same time, WULF still trades with decent liquidity and range, which matters for day‑traders. The spread between intraday high and low offers room for scalps, while the narrowing range into mid‑day signals a possible bigger move later as volatility contracts.
Under the hood, TeraWulf Inc.’s balance sheet shapes the narrative. WULF lists roughly $2.62B in cash and short‑term investments and total assets near $8.05B. But current liabilities sit around $3.76B, with a current ratio of just 0.8 and quick ratio 0.7. That tells traders WULF is not flush with near‑term liquidity despite big headline cash numbers. Combine that with over $4.02B in long‑term debt and highly negative returns on capital, and WULF becomes a prime candidate for strong trend moves whenever sentiment shifts.
Conclusion
For active traders, WULF is the kind of chart that demands respect. TeraWulf Inc. has real revenue growth, very high gross margins, and a sizable asset base. But the company is burning cash at scale, posting nearly $1B in quarterly losses and leaning on heavy capital raises and debt. That tension between growth potential and financial strain is exactly why WULF can trend hard in either direction.
From a trading education standpoint, WULF teaches several key lessons. Extended runs into the mid‑$15s set up a classic pullback once momentum stalled. The recent slide toward $11–$12 shows what happens when rich valuations collide with weak profitability. Liquidity ratios under 1.0 remind traders to always check the balance sheet, not just the chart. As millionaire penny stock trader and teacher Tim Sykes says, “Embrace the journey, the ups and downs; each mistake is a lesson to improve your strategy.” WULF’s price action and fundamentals offer plenty of those ups and downs for traders willing to study and adapt.
Short‑term, WULF traders should focus on key levels: recent lows near $11.55 as support and the $12.50–$13 band as first resistance. Breaks and rejections around those zones can offer clean risk‑reward setups for disciplined day and swing trading.
As Tim Sykes likes to say, “The pattern is the same, only the ticker changes.” WULF is another high‑volatility name where patterns, risk management, and preparation matter far more than predictions. Use TeraWulf Inc. as a real‑time case study: track the price action, match it against the ugly but detailed financials, and practice building trading plans that cut losses fast and never rely on hope.
This is stock news, not investment advice. Timothy Sykes News delivers real-time stock market news focused on key catalysts driving short-term price movements. Our content is tailored for active traders and investors seeking to capitalize on rapid price fluctuations, particularly in volatile sectors like penny stocks. Readers come to us for detailed coverage on earnings reports, mergers, FDA approvals, new contracts, and unusual trading volumes that can trigger significant short-term price action. Some users utilize our news to explain sudden stock movements, while others rely on it for diligent research into potential investment opportunities.
Dive deeper into the world of trading with Timothy Sykes, renowned for his expertise in penny stocks. Explore his top picks and discover the strategies that have propelled him to success with these articles:
- Penny Stocks Trading Guide
- Best Penny Stocks Under $1 to Buy Today
- Top 8 Penny Stocks to Watch on Robinhood
Once you’ve got some stocks on watch, elevate your trading game with StocksToTrade the ultimate platform for traders. With specialized tools for swing and day trading, StocksToTrade will guide you through the market’s twists and turns.
Dig into StocksToTrade’s watchlists here:




Leave a reply