

SoFi Technologies Inc. stocks have been trading down by -7.49 percent following bearish analyst downgrades and growth concerns.
Key Takeaways
- Keefe Bruyette Woods cut its SoFi Technologies price target to $15 from $16 and kept an Underperform rating in place.
- The firm highlighted fair value accounting, higher interest rates, and rapid balance sheet growth as core risks for SOFI.
- Analysts estimate these pressures create more than a $1B earnings headwind in Q3 for SoFi Technologies.
- The expected hit may fuel further loan growth at SOFI but also drain capital levels, raising balance sheet concerns for traders.
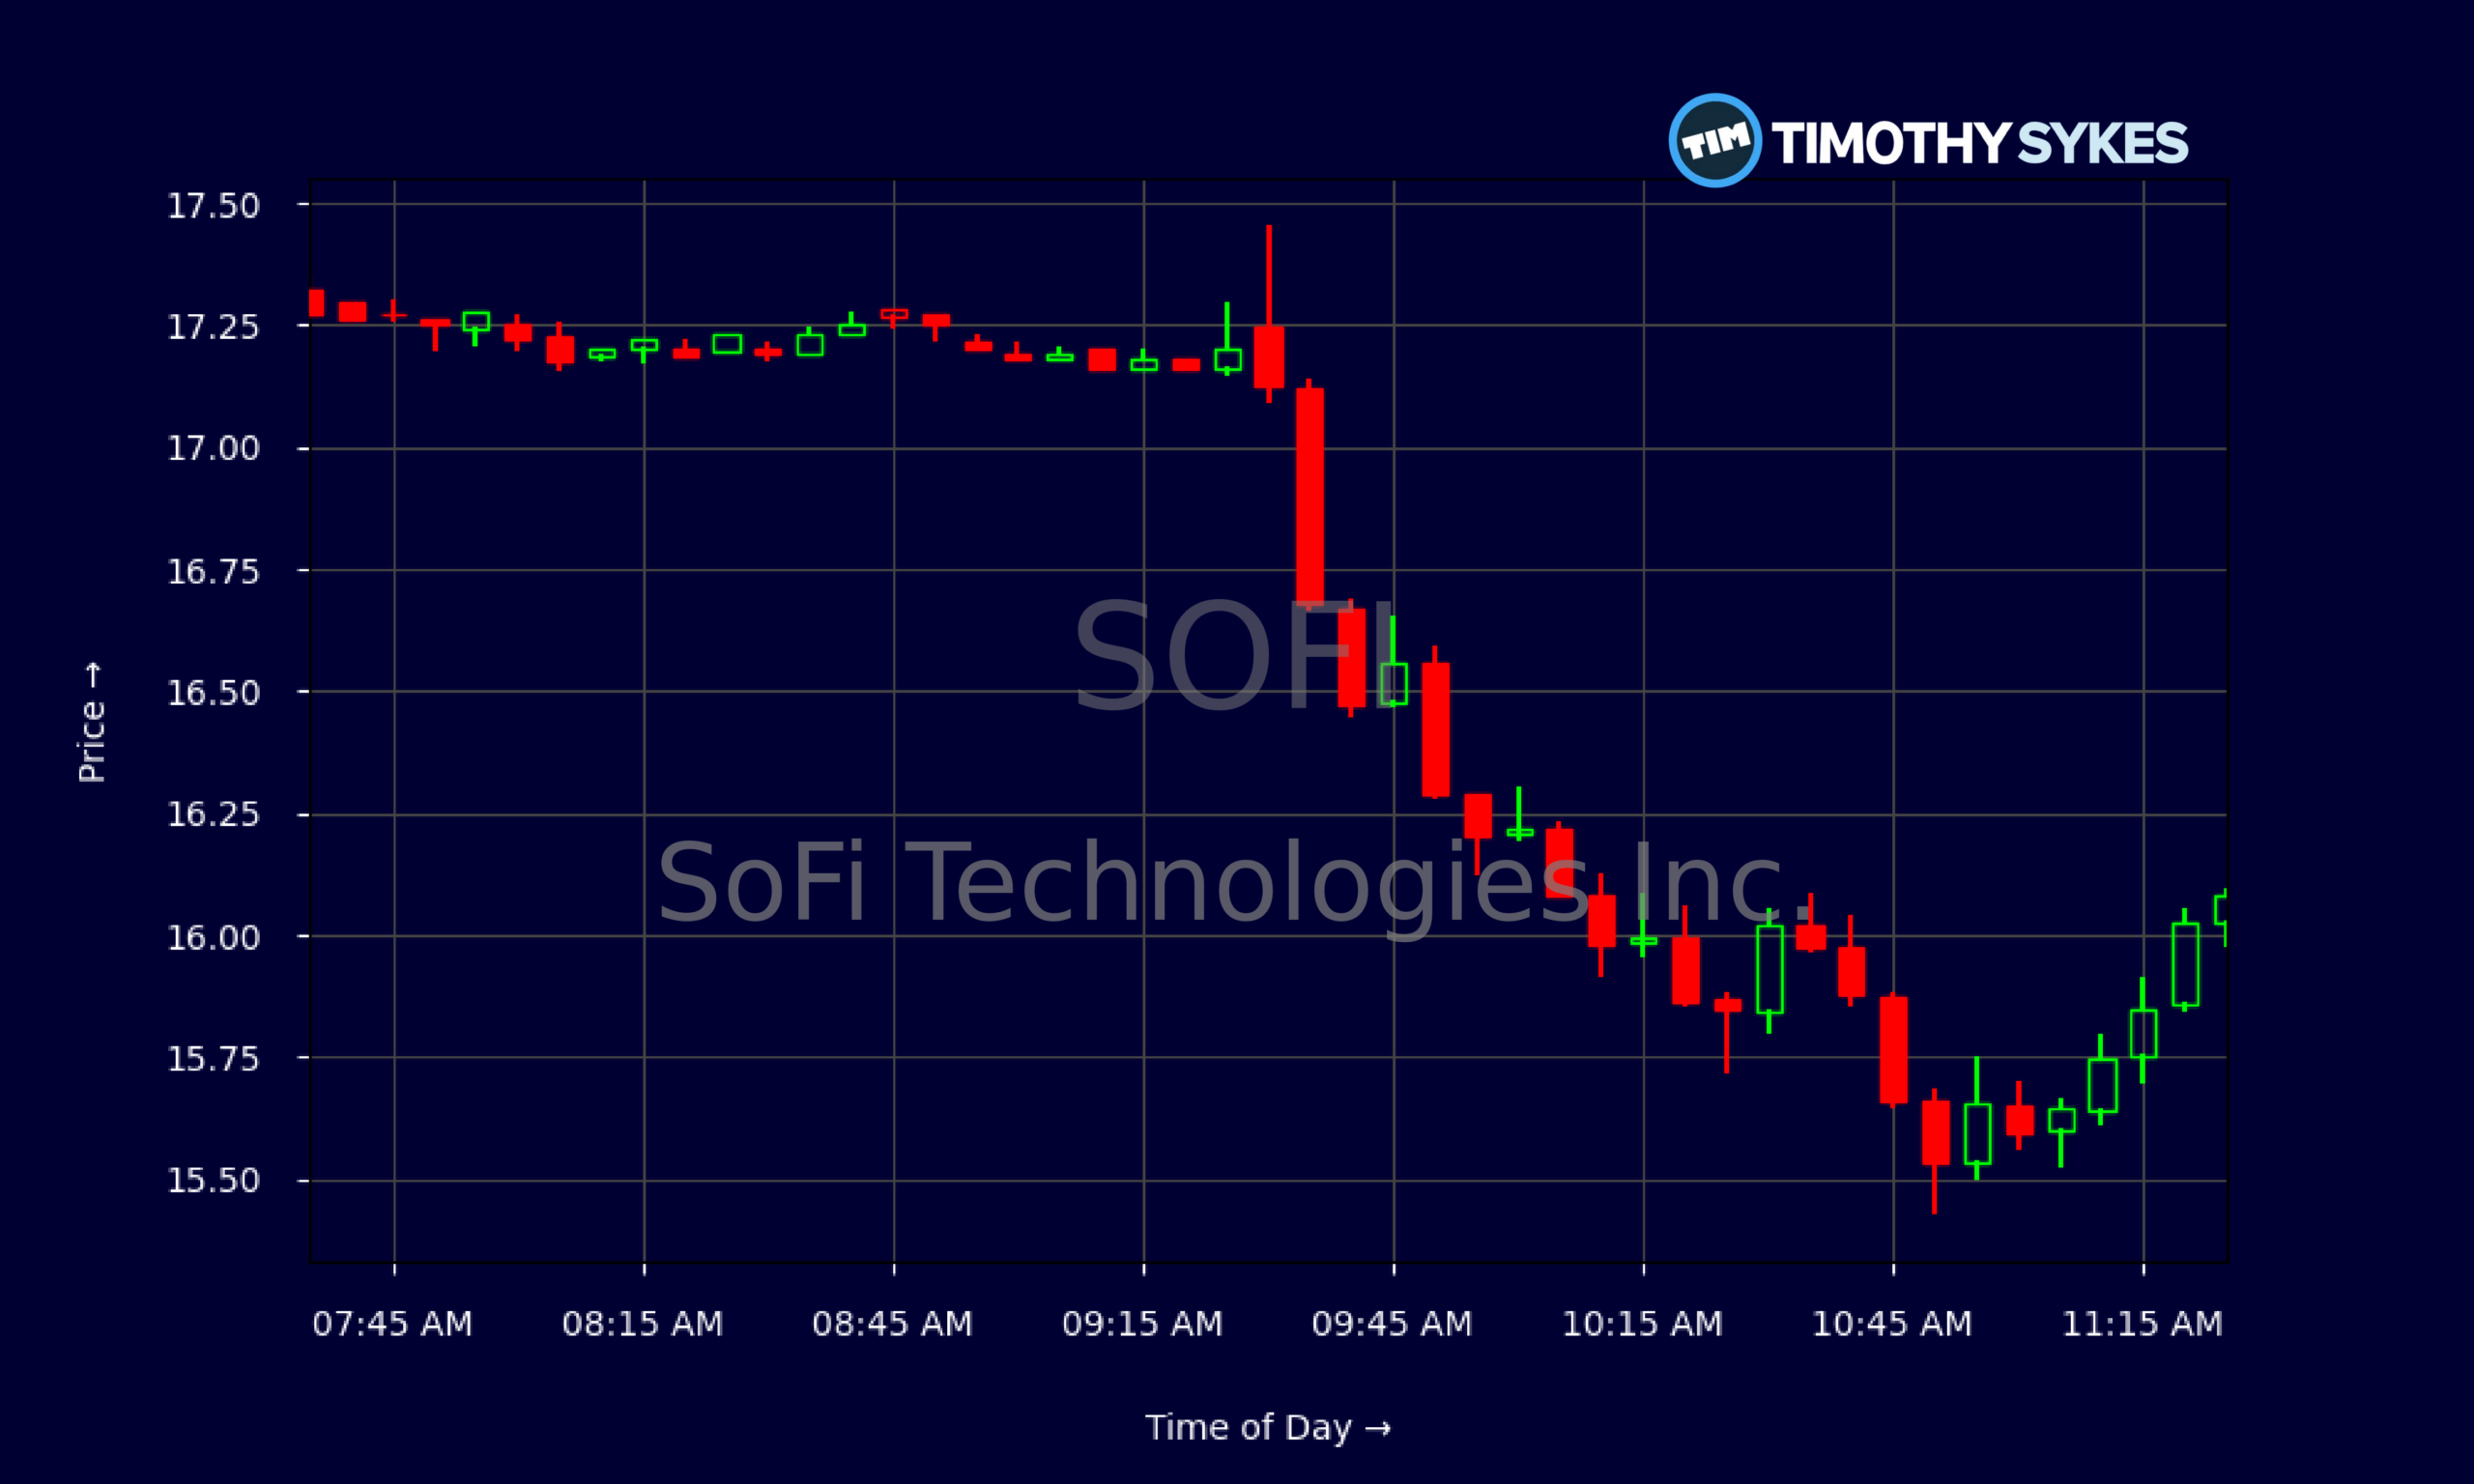
Live Update At 11:32:18 EST: On Thursday, November 05, 2026 SoFi Technologies Inc. stock [NASDAQ: SOFI] is trending down by -7.49%! Discover the key drivers behind this movement as well as our expert analysis in the detailed breakdown below.
Quick Financial Overview
SOFI has been grinding higher on the chart, but the tape is choppy. Over the past few weeks, SoFi Technologies has climbed from the mid‑$14s to above $17 before slipping back to around $16.06 on 2026/11/05. That’s a solid swing, yet the candles tell a story of volatility, not a smooth trend.
Daily data show repeated pushes toward the $17–$18 zone that keep getting sold, creating a potential short‑term ceiling for SOFI. Intraday, the 5‑minute chart shows a sharp fade from the $17.40 pre‑market area down toward $15.43 before stabilizing near $16. That’s classic range‑to‑flush action that active traders watch closely.
More Breaking News
Fundamentally, SoFi Technologies is posting real revenue — about $3.61B over the last year, with strong growth above 30% annually. Profit margins are turning positive, but SOFI trades at a rich price‑to‑sales near 4.7 and a P/E above 32. The balance sheet is heavily leveraged to loans, with assets turning slowly. For traders, that mix means SOFI can run fast on momentum, but any negative catalyst — like an analyst downgrade — can hit hard because expectations are already high.
Why Traders Are Watching SOFI After The Target Cut
SOFI is back in focus after Keefe Bruyette Woods cut its price target to $15 from $16 and reaffirmed an Underperform rating. When a major bank not only lowers its target but also doubles down on a negative stance, momentum traders pay attention. This isn’t just a small tweak; the firm is flagging more than a $1B headwind in Q3 for SoFi Technologies.
The key issue is how SOFI accounts for its loans. Fair value accounting means SoFi marks a big loan book to market. When rates rise and credit risk is perceived as higher, those marks can swing against the company, pressuring reported earnings even if cash doesn’t move right away. Keefe Bruyette Woods is saying that combination — fair value marks, higher rates, and aggressive balance sheet growth — is stacking up into a serious drag.
Rapid loan growth sounds bullish at first glance. SOFI keeps adding borrowers, especially across personal loans and related products. But traders know that fast asset growth inside a lender can cut both ways. SoFi Technologies needs capital to support that loan book. The analyst call suggests that while loans may keep climbing, capital levels may fall, making the balance sheet more fragile.
For active traders, that setup in SOFI — high expectations, rich valuation, and now a bearish analyst narrative — creates a classic battleground stock. Breaks above recent highs around $17.50–$17.70 can squeeze shorts. Failure there, especially with this fresh Underperform rating hanging over SoFi Technologies, can invite heavy selling.
Conclusion
SOFI is not trading like a sleepy bank stock. The recent price action — spikes toward $17+, intraday flushes into the mid‑$15s, and rebounds back to the $16 area — shows SoFi Technologies is a momentum name sitting right in the path of shifting analyst sentiment. Keefe Bruyette Woods trimming its target to $15 and sticking with Underperform adds a clear downside narrative: more than $1B in expected Q3 headwinds tied to accounting marks, rising rates, and a rapidly expanding balance sheet.
For traders, the message is simple. SOFI has real growth, real revenue scale, and improving profitability metrics, but that growth is being fueled by an aggressive loan engine. When an analyst highlights falling capital levels as that engine revs, market participants start repricing risk. That can cap rallies or even trigger sharp pullbacks when sentiment turns.
This is where disciplined trading comes in. SOFI offers range, liquidity, and strong intraday moves — exactly what many in the Tim Sykes community look for. But it also carries real fundamental risk that can show up fast on the chart. As millionaire penny stock trader and teacher Tim Sykes says, “Be patient, don’t force trades, and let the perfect setups come to you.” As Tim Sykes likes to remind traders, “The market doesn’t care about your opinion, only your risk management.” Apply that mindset to every SOFI trade: map your levels, size responsibly, and be ready to cut losses quickly if the story or the price action breaks. This article is for educational and research purposes only and is not advice.
This is stock news, not investment advice. Timothy Sykes News delivers real-time stock market news focused on key catalysts driving short-term price movements. Our content is tailored for active traders and investors seeking to capitalize on rapid price fluctuations, particularly in volatile sectors like penny stocks. Readers come to us for detailed coverage on earnings reports, mergers, FDA approvals, new contracts, and unusual trading volumes that can trigger significant short-term price action. Some users utilize our news to explain sudden stock movements, while others rely on it for diligent research into potential investment opportunities.
Dive deeper into the world of trading with Timothy Sykes, renowned for his expertise in penny stocks. Explore his top picks and discover the strategies that have propelled him to success with these articles:
- Penny Stocks Trading Guide
- Best Penny Stocks Under $1 to Buy Today
- Top 8 Penny Stocks to Watch on Robinhood
Once you’ve got some stocks on watch, elevate your trading game with StocksToTrade the ultimate platform for traders. With specialized tools for swing and day trading, StocksToTrade will guide you through the market’s twists and turns.
Dig into StocksToTrade’s watchlists here:





Leave a reply