
Profusa Inc. stock has been trading up by 22.47 percent following bullish sentiment around its latest healthcare technology developments.
Key Takeaways
- PFSA has dropped more than 50% from late-September highs, putting Profusa Inc. squarely in a high-volatility trading zone.
- Recent intraday action shows wide 5-minute swings, signaling active day-trader interest and fragile support around $1.00.
- Profusa Inc.’s balance sheet is heavily leveraged, with negative equity and tight working capital, keeping dilution and financing risk on the table.
- PFSA’s cash burn and negative free cash flow pressure the company to keep raising capital, which traders must monitor closely.
Live Update At 07:48:14 EDT: On Thursday, October 22, 2026 Profusa Inc. stock [NASDAQ: PFSA] is trending up by 22.47%! Discover the key drivers behind this movement as well as our expert analysis in the detailed breakdown below.
Quick Financial Overview
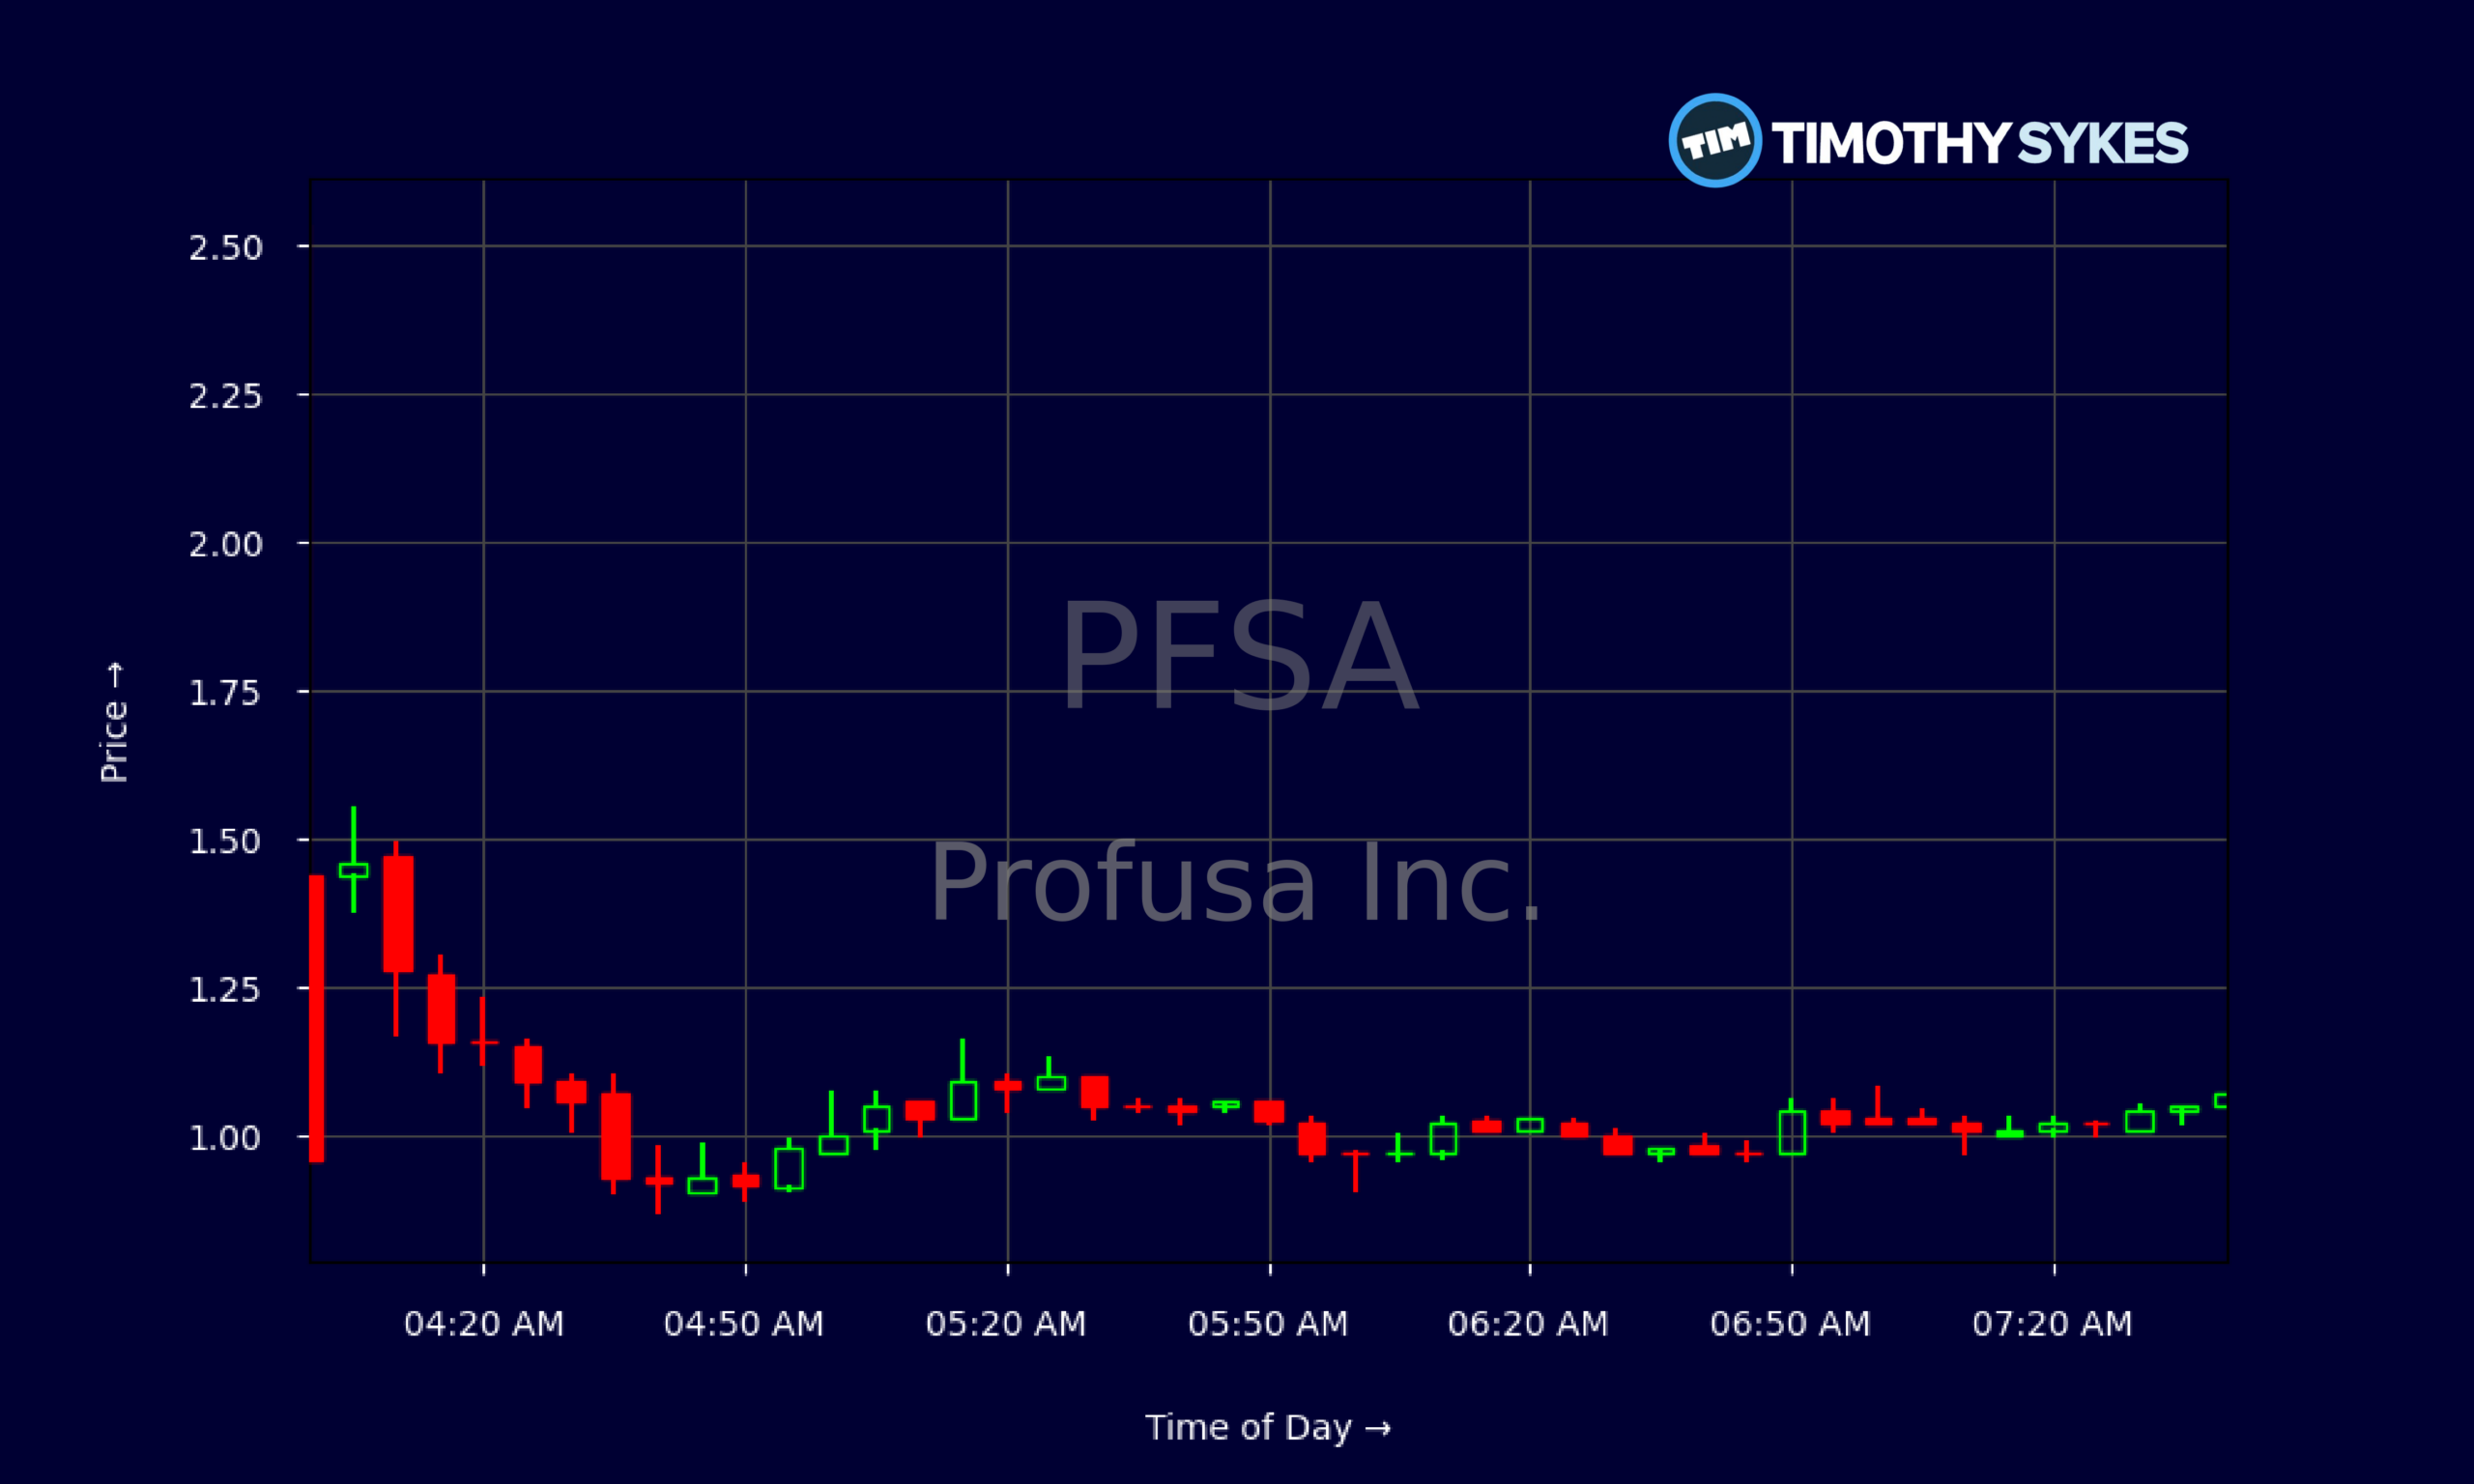
PFSA has been on a sharp slide. Profusa Inc. traded near $2.27 on 2026/09/29 and now sits under $0.90, showing how brutal small-cap biotech-style names can be when momentum fades. The daily chart for PFSA shows a clear pattern: a spike toward the end of September, followed by a steady bleed, then harder selling in October as support levels broke one after another.
Profusa Inc.’s fundamentals match that story. PFSA shows total assets of about $1.0M against total liabilities near $28.2M, with stockholders’ equity deeply negative at roughly -$27.1M. That means the company owes far more than it owns. Working capital is about -$27.3M, so short-term obligations heavily outweigh current assets.
More Breaking News
On the income side, Profusa Inc. printed a quarterly net loss of about $8.76M and operating cash flow near -$2.63M. Free cash flow is also negative, around -$2.71M, while PFSA relies on debt issuance to stay funded. For traders, that mix—shrinking price, heavy losses, and ongoing cash burn—creates both opportunity and serious risk, especially if more capital raises hit the tape.
Why Traders Are Watching PFSA’s Volatility
Traders are glued to PFSA because the chart screams volatility. At the end of September, Profusa Inc. pushed from the mid-$1s to an intraday high near $2.45 on 2026/09/29, then closed at $2.27. The next day PFSA held near $1.98, but by early October it was already sliding into the $1.60–$1.80 range. That shift from breakout to breakdown happened fast.
The recent daily candles tell the rest of the story. PFSA bounced around $1.70–$1.90 through early October, but once Profusa Inc. cracked below $1.50 and then $1.30, the selling pressure accelerated. By 2026/10/21, the stock closed near $0.85 after trading as low as $0.70. That’s a textbook momentum unwind where trapped longs hit the exits and short-term traders take control.
Intraday, PFSA’s 5-minute tape shows big moves between roughly $0.91 and $1.28 in just a few hours of trading. That kind of range attracts day traders who look for quick scalps rather than long-term positions. For Profusa Inc., the $1.00 zone is acting like a tug-of-war line: pushes above get faded, dips below attract bounce attempts.
This is exactly the type of chart many small-cap momentum traders study. PFSA is a beaten-down former runner with high volume spikes and a fragile base. That makes Profusa Inc. a prime candidate for both sharp dead-cat bounces and nasty further breakdowns, depending on how the next wave of trading plays out.
Conclusion
PFSA is not a slow, steady name; Profusa Inc. is a classic high-risk, high-volatility small-cap. The fundamentals back that up. Negative equity, heavy liabilities, and a quarterly net loss of about $8.76M show that Profusa Inc. is still firmly in capital-hungry territory. Cash at roughly $0.72M and negative working capital mean PFSA depends on ongoing financing, with dilution and new debt always lurking in the background.
For traders, that mix cuts both ways. When sentiment turns, PFSA can spike hard, as the late-September move toward $2.45 showed. When the music stops, Profusa Inc. can unwind even faster, sliding under $1.00 and breaking support levels that many swing traders rely on. That’s why risk management is everything here.
The lesson PFSA offers is simple: treat charts and filings as a roadmap. Study how Profusa Inc. trades around key levels like $1.00 and prior highs, and size positions accordingly. As millionaire penny stock trader and teacher Tim Sykes, says, “Be patient, don’t force trades, and let the perfect setups come to you.”. In the words often repeated by Tim Sykes, “The market doesn’t care about your opinion, only your preparation and your risk management.” For PFSA, traders who respect that rule stand the best chance of surviving the next big move—up or down.
This is stock news, not investment advice. Timothy Sykes News delivers real-time stock market news focused on key catalysts driving short-term price movements. Our content is tailored for active traders and investors seeking to capitalize on rapid price fluctuations, particularly in volatile sectors like penny stocks. Readers come to us for detailed coverage on earnings reports, mergers, FDA approvals, new contracts, and unusual trading volumes that can trigger significant short-term price action. Some users utilize our news to explain sudden stock movements, while others rely on it for diligent research into potential investment opportunities.
Dive deeper into the world of trading with Timothy Sykes, renowned for his expertise in penny stocks. Explore his top picks and discover the strategies that have propelled him to success with these articles:
- Penny Stocks Trading Guide
- Best Penny Stocks Under $1 to Buy Today
- Top 8 Penny Stocks to Watch on Robinhood
Once you’ve got some stocks on watch, elevate your trading game with StocksToTrade the ultimate platform for traders. With specialized tools for swing and day trading, StocksToTrade will guide you through the market’s twists and turns.
Dig into StocksToTrade’s watchlists here:




Leave a reply