

Ovintiv Inc. (DE) stocks have been trading up by 4.97 percent, driven primarily by bullish sentiment on rising energy prices.
What Traders Need To Know
- RBC lifted its OVV target to $90 and kept an Outperform call, pointing to strong Permian productivity and higher base production versus a share price near $66.78.
- UBS sees a constructive Q3, expecting Permian strength and higher buybacks to drive more than 60% free cash flow returns in 2026.
- A renewed buyback program allows up to about 27M shares to be repurchased over 12 months, signaling confidence in cash flow and balance sheet strength.
- Multiple banks, including Scotiabank, Truist, Wells Fargo, Morgan Stanley, and CIBC, raised OVV price targets into roughly the $71–$82 range on strong Q3 setup and solid 2027 visibility.
- Analysts highlight that 2027 plans, inflation control, hedging, and capital discipline during growth will be key for how OVV trades in a higher-oil-price environment.
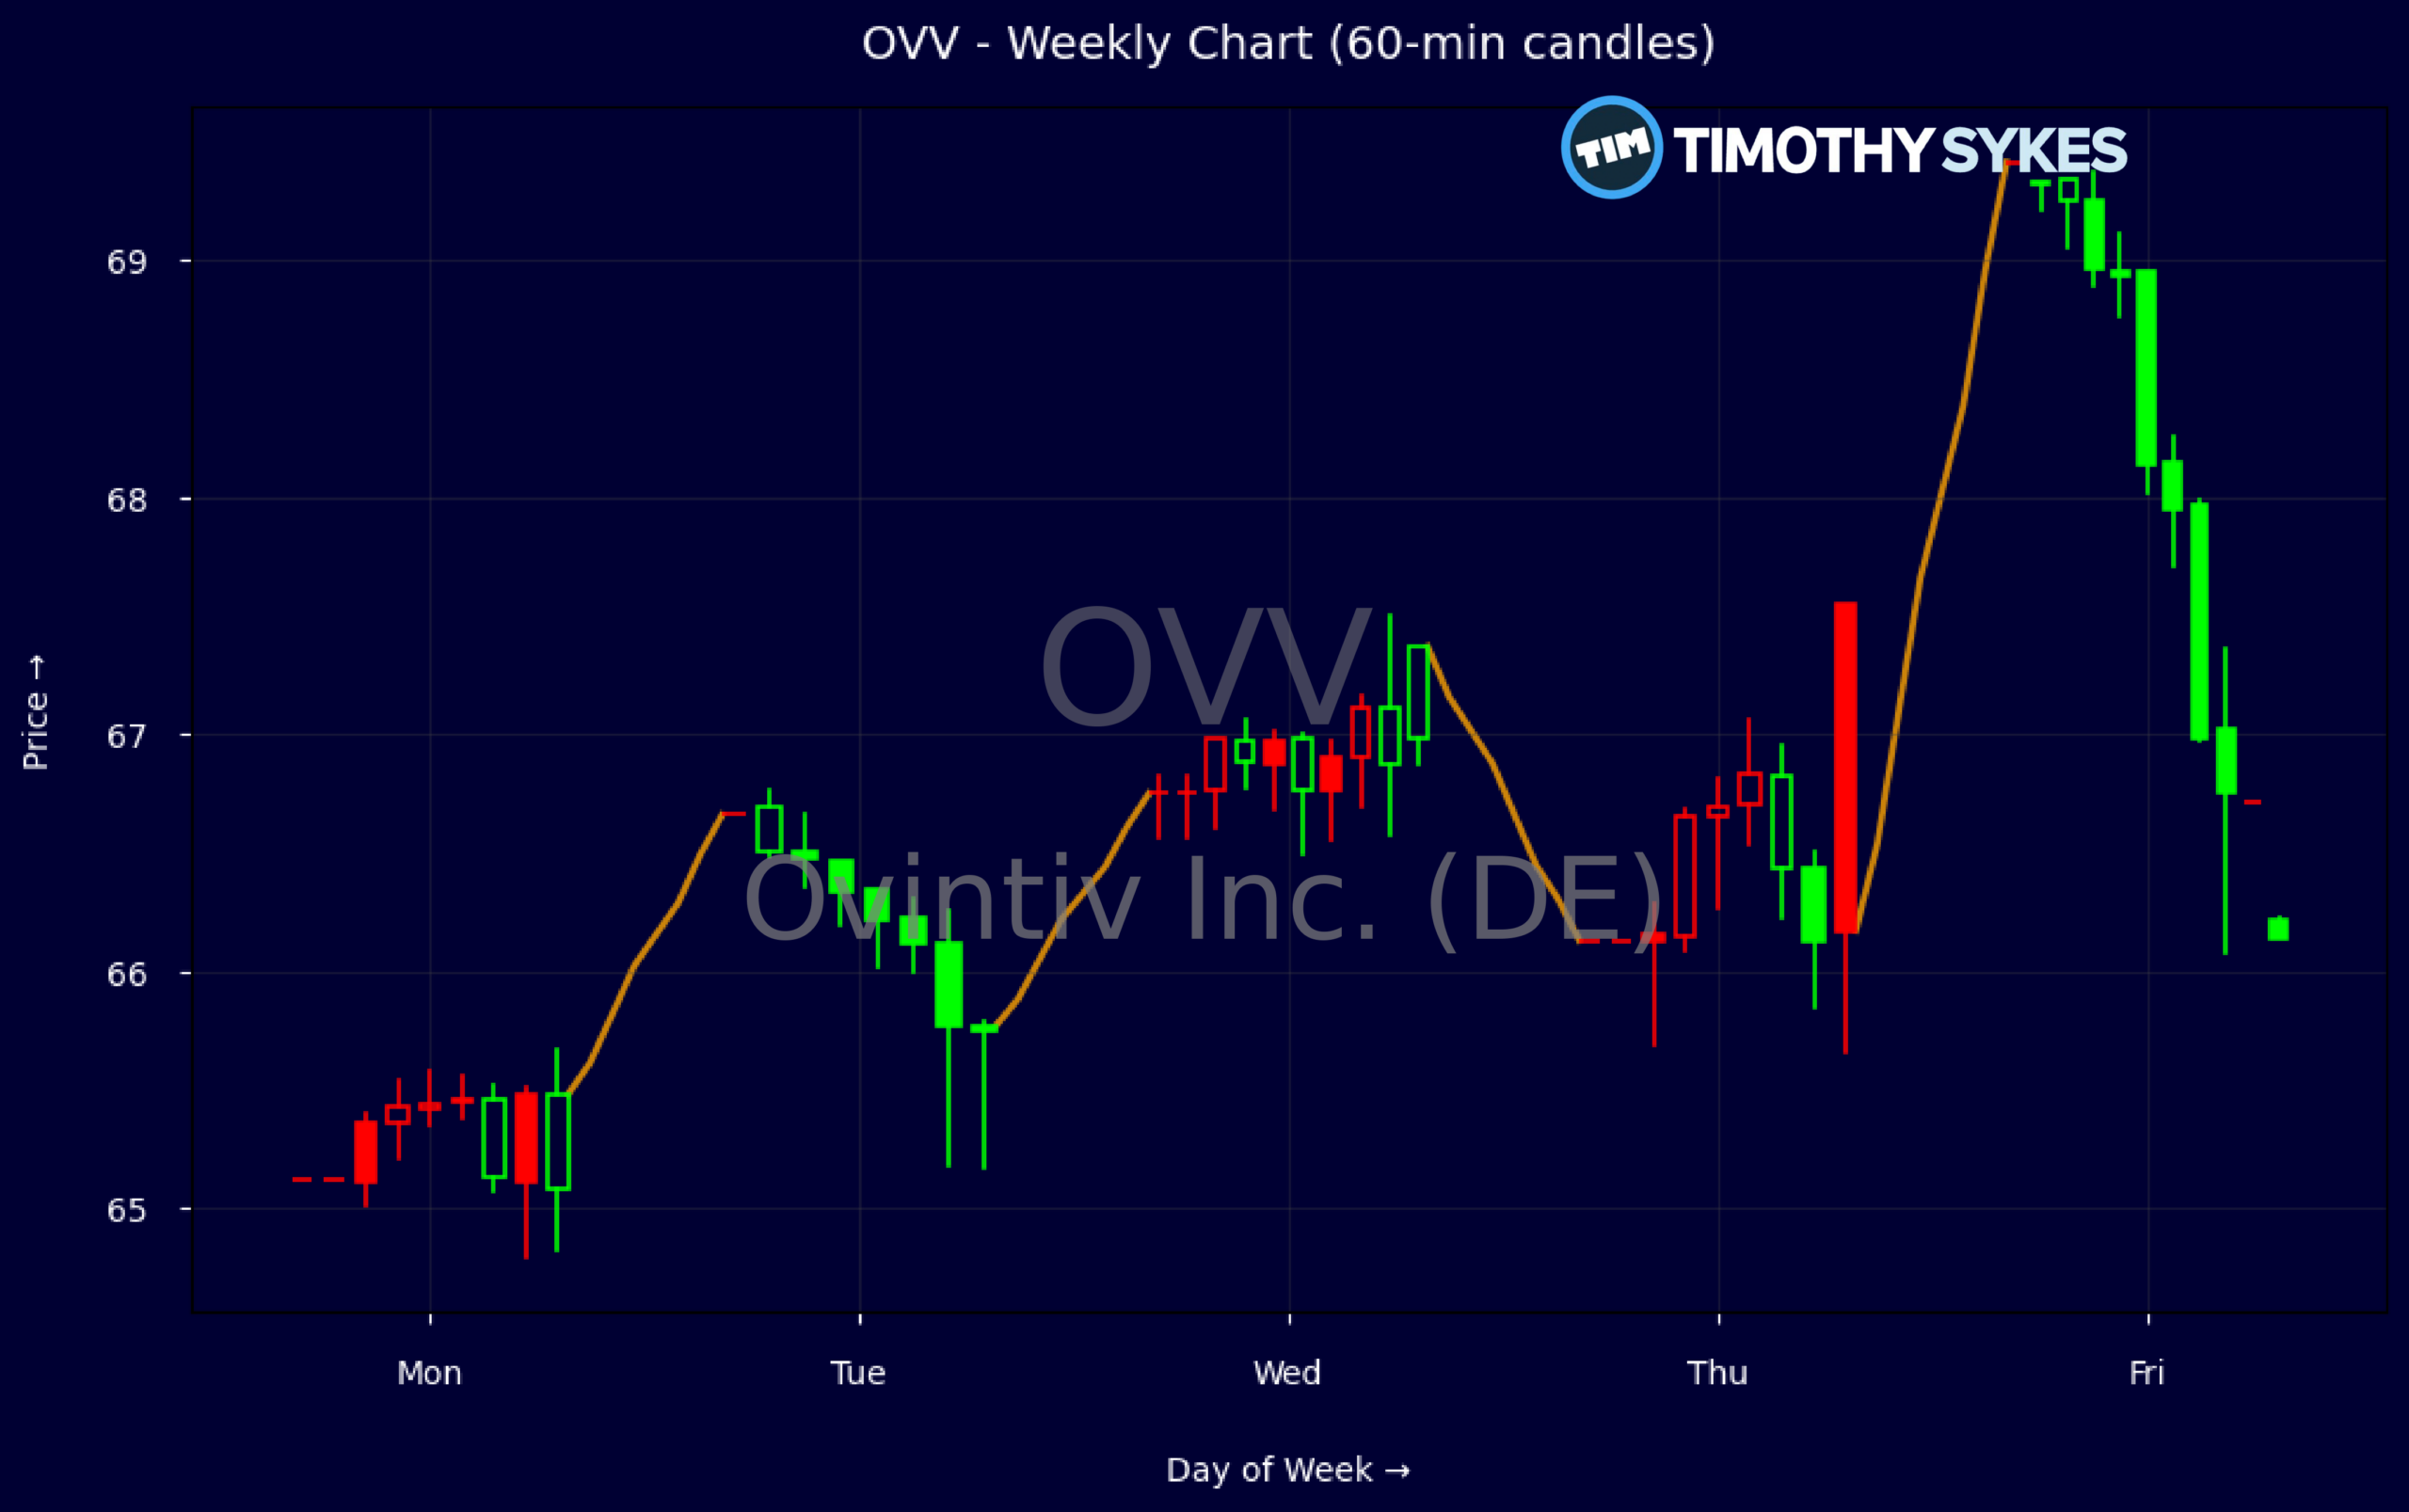
Weekly Update Oct 12 – Oct 16, 2026: On Saturday, October 17, 2026 Ovintiv Inc. (DE) stock [NYSE: OVV] is trending up by 4.97%! Discover the key drivers behind this movement as well as our expert analysis in the detailed breakdown below.
Energy industry expert:
Analyst sentiment – positive
Ovintiv sits in the first quartile of North American E&Ps on profitability and capital efficiency, with EBITDA margin of 23% and ROE above 25% supported by a 59% gross margin and disciplined leverage (D/E 0.44, long‑term debt/capital 0.30). The stock trades at 1.9x sales and 2.9x cash flow, a discount to its returns profile and inventory depth, while its ~1.7% dividend and accelerating buybacks, funded by robust free cash flow, anchor a shareholder‑friendly capital framework.
Technically, OVV is in a clear short‑term uptrend, stair‑stepping from roughly 65 to over 69 in five sessions, with successive higher highs and higher lows and strong closes near the top of daily ranges, indicating persistent institutional demand. Intraday 5‑minute action shows strong buying pressure on dips and volume building above 66.50. The key actionable level is support at 66.50–67.00; aggressive longs can buy pullbacks into that zone with risk defined below 65.00.
Recent news flow is uniformly constructive, with multiple price‑target hikes (Street range ~$71–90, average ~77) and broad Overweight/Buy ratings highlighting Permian outperformance, improving Waha gas pricing, and a multi‑year free cash flow upgrade versus the Energy sector. The renewed NCIB for up to ~27 million shares reinforces capital‑return visibility and should support the share price on weakness. I expect OVV to outperform Energy and Fossil Fuels benchmarks, with near‑term support at 66 and resistance at 75, and a 12‑18 month target of 82–85.
More Breaking News
Quick Financial Overview
Ovintiv Inc. (DE) has drawn a wave of positive analyst attention while the stock trades in the mid-$60s. Weekly data show OVV grinding from about $65 to over $69 in recent sessions, with a push to roughly $69.41 on the latest bar. That steady climb, not a sharp spike, suggests accumulation rather than a one-day squeeze. Intraday, a 5-minute candle moving from $66.75 to around $69.33 with a wide range down to $66.08 signals strong buying demand absorbing dips.
On fundamentals, OVV posted about $8.91B in revenue, with a gross margin near 59.5% and EBITDA margin above 23%. Profit margin around 9.4% shows solid but not extreme profitability for a cyclical energy name. A price-to-sales ratio near 1.91 and price-to-free-cash around 2.8 point to a market that still prices OVV at a discount to its cash generation power, which helps explain why banks are comfortable with higher targets.
Balance sheet strength backs the story. Total debt-to-equity of 0.44 and interest coverage near 5.8 show manageable leverage. Return on equity above 25% and return on capital in the low 20s indicate effective deployment of capital, critical for traders betting on continued buybacks. Free cash flow of roughly $1.06B in the latest quarter, plus a quarterly dividend (about $1.20 per share annualized and roughly 1.7% yield), supports the stated plan to return at least 60% of free cash flow via dividends and repurchases.
Conclusion
This is stock news, not investment advice. Timothy Sykes News delivers real-time stock market news focused on key catalysts driving short-term price movements. Our content is tailored for active traders and investors seeking to capitalize on rapid price fluctuations, particularly in volatile sectors like penny stocks. Readers come to us for detailed coverage on earnings reports, mergers, FDA approvals, new contracts, and unusual trading volumes that can trigger significant short-term price action. Some users utilize our news to explain sudden stock movements, while others rely on it for diligent research into potential investment opportunities.
Dive deeper into the world of trading with Timothy Sykes, renowned for his expertise in penny stocks. Explore his top picks and discover the strategies that have propelled him to success with these articles:
- Penny Stocks Trading Guide
- Best Penny Stocks Under $1 to Buy Today
- Top 8 Penny Stocks to Watch on Robinhood
Once you’ve got some stocks on watch, elevate your trading game with StocksToTrade the ultimate platform for traders. With specialized tools for swing and day trading, StocksToTrade will guide you through the market’s twists and turns.
Dig into StocksToTrade’s watchlists here:





Leave a reply