

Antelope Enterprise Holdings Limited surged as investors reacted to its most impactful corporate update; stocks have been trading up by 99.68 percent
Key Takeaways
- AEHL has dropped from a spike high near $30 to around the mid-$6s, showing a sharp momentum unwind on the daily chart.
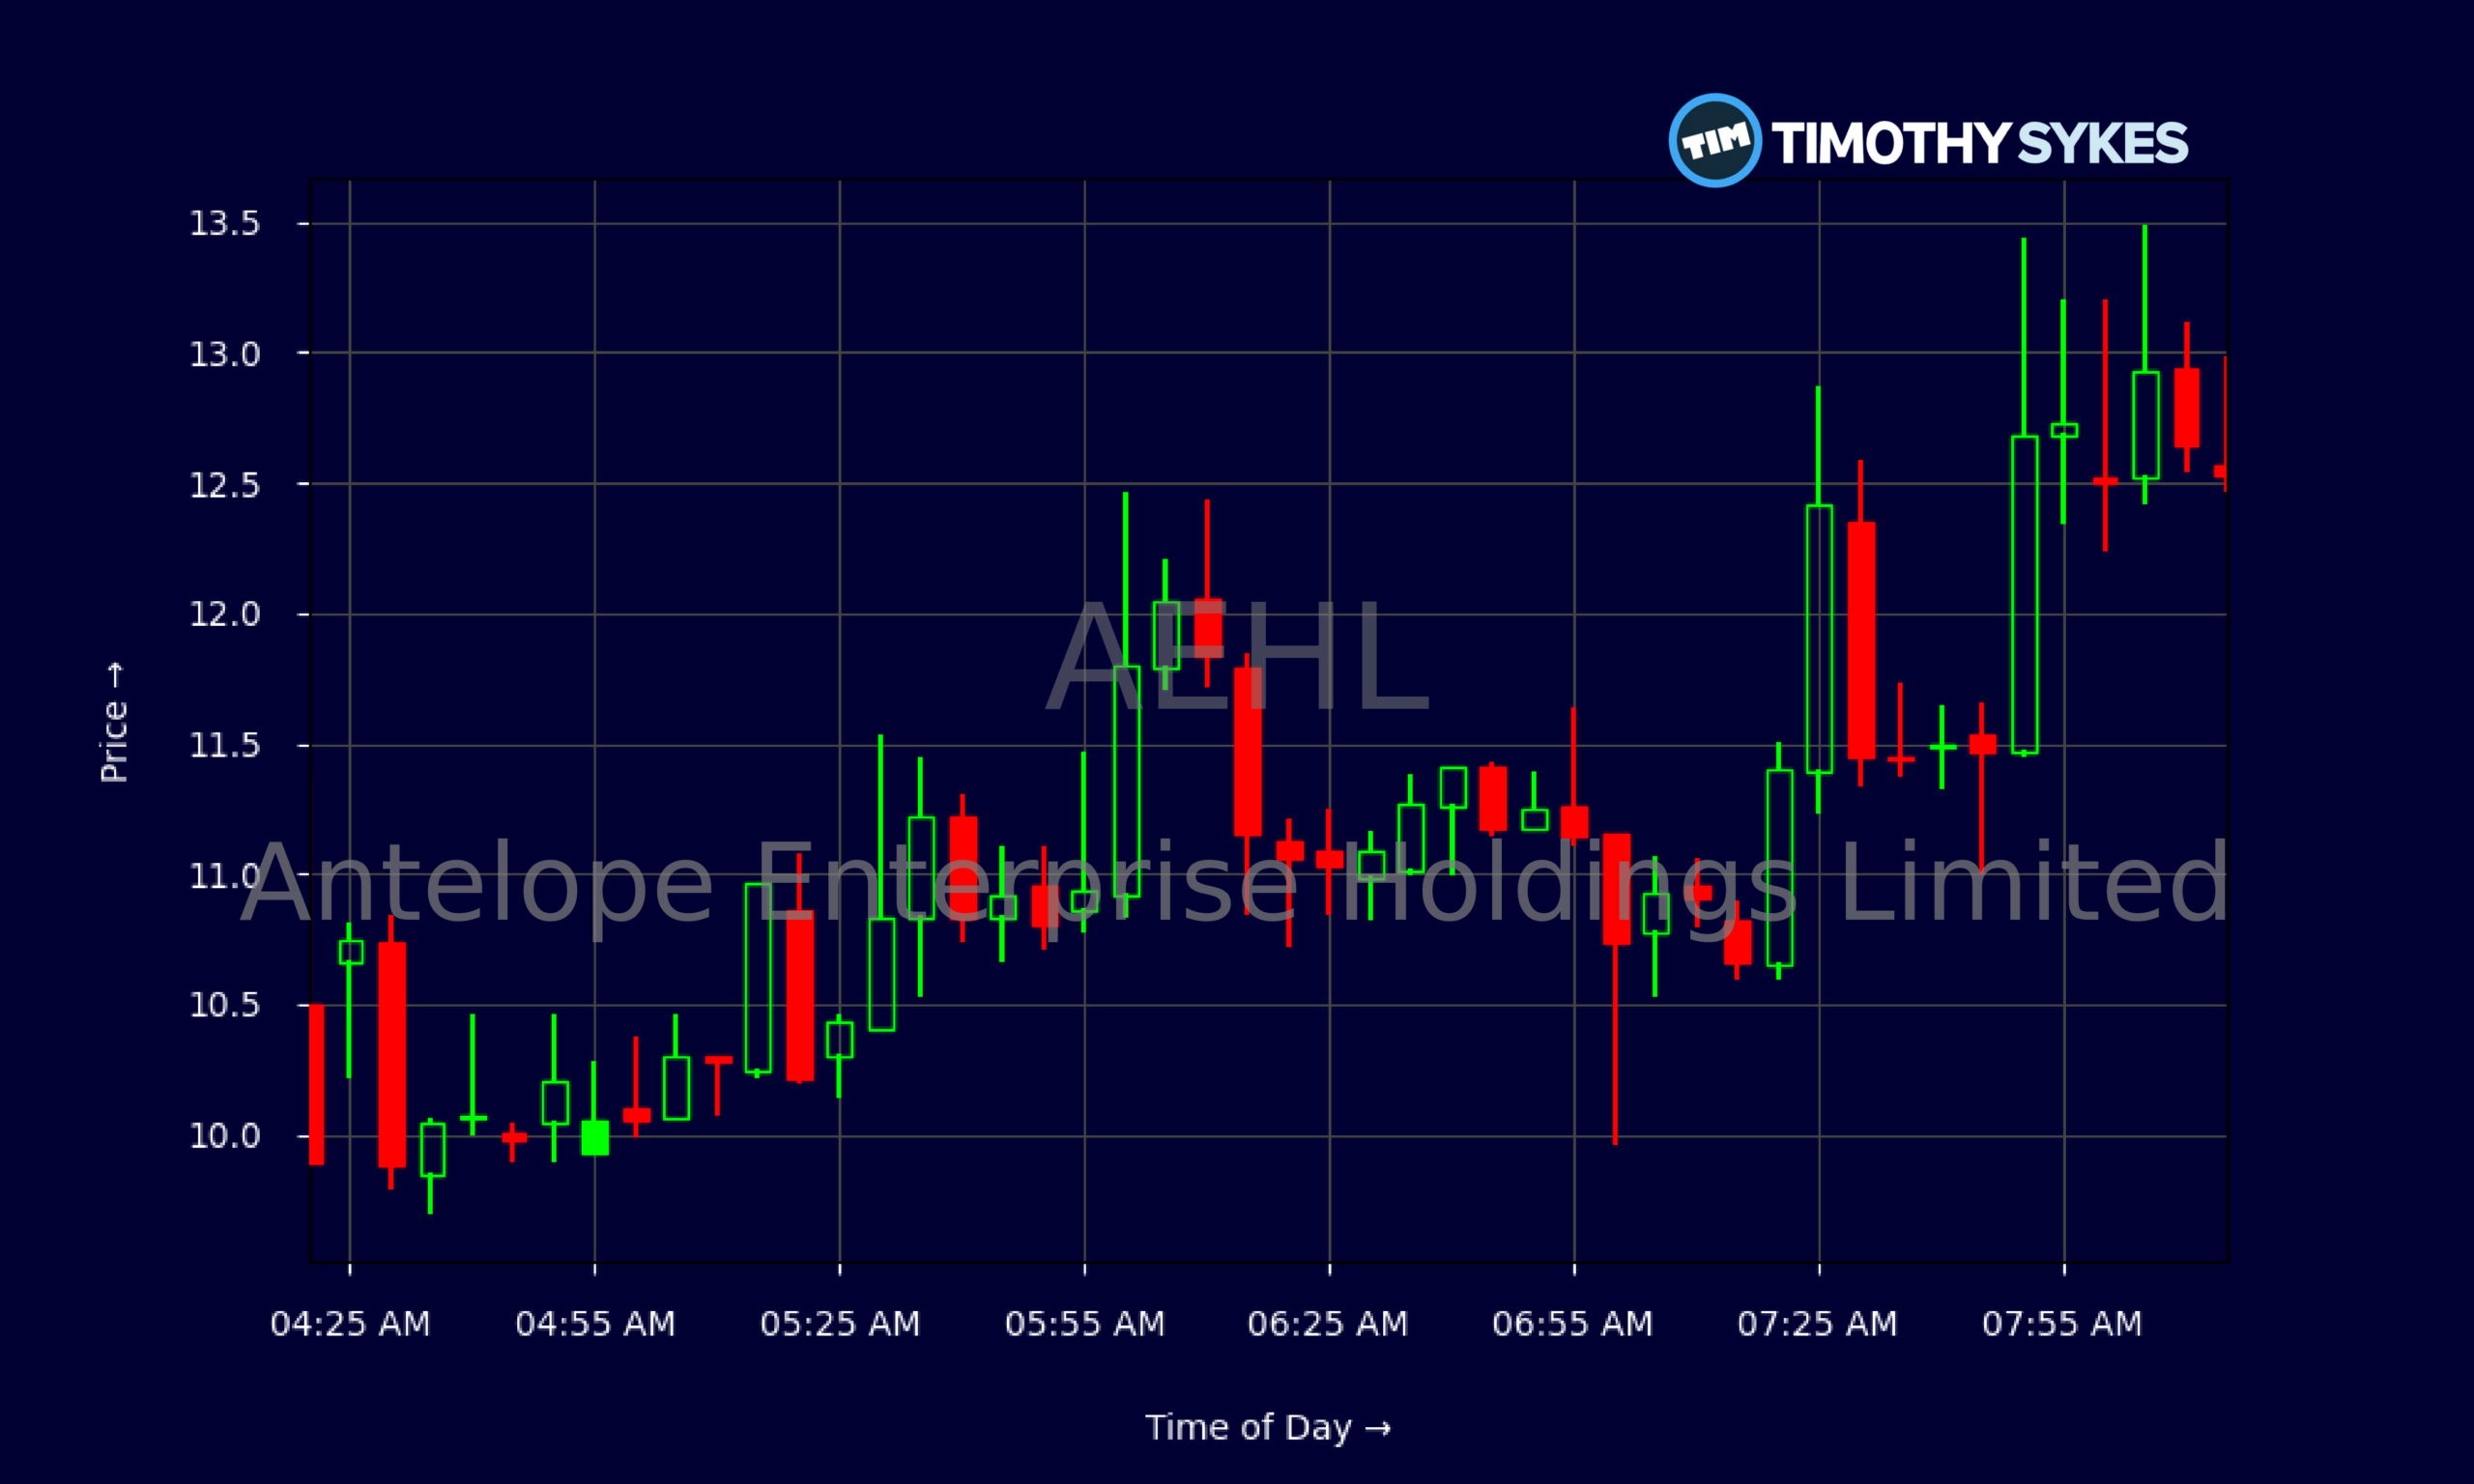
- Recent intraday trading in AEHL shows heavy volatility with wide 5-minute ranges, a classic day-trader playground but risky for bag-holders.
- Antelope Enterprise Holdings Limited carries about $37.1M in assets and $10.2M in liabilities, giving it solid equity backing relative to its tiny market value.
- AEHL’s price-to-book ratio above 40 signals a highly speculative name where crowd psychology drives moves more than fundamentals.
- Traders are watching prior support and resistance zones closely as AEHL cools off from its parabolic run.
Live Update At 08:18:59 EST: On Thursday, November 05, 2026 Antelope Enterprise Holdings Limited stock [NASDAQ: AEHL] is trending up by 99.68%! Discover the key drivers behind this movement as well as our expert analysis in the detailed breakdown below.
Quick Financial Overview
AEHL is a micro-cap with numbers that don’t look crazy on the balance sheet, but the stock trades like a wild penny runner. Antelope Enterprise Holdings Limited reported roughly $37.1M in total assets and $10.2M in total liabilities as of 2025/09/30, leaving about $26.7M in stockholders’ equity. That’s a decent cushion for a company of this size, and the leverage ratio of 1.4 and long-term debt that’s only about 3% of total capital show AEHL is not drowning in debt.
Revenue sits near $60.8M, or about $3.70 per share. Yet AEHL’s price-to-book ratio is an eye-popping 47.23, telling traders the stock trades way above its underlying accounting value. That kind of premium usually belongs to story stocks and momentum names, not sleepy value plays.
More Breaking News
For short-term traders, that’s the key. AEHL’s fundamentals are stable enough to keep the listing alive, but the valuation says the real game is speculation. When a chart like AEHL’s heats up, liquidity floods in, and when the party ends, the air comes out fast.
Why Traders Are Watching AEHL Price Action
AEHL’s recent chart looks like a textbook momentum blow-off. In mid-October 2026, AEHL exploded from single digits to a high around $30.60 on 261014 before closing that day at $11.49. That intraday range alone tells you what kind of traders were in charge. Since then, Antelope Enterprise Holdings Limited has been grinding lower, with daily closes stepping down from $11–$12 into the $6s.
Look at the daily sequence: after the spike, AEHL tried to hold the $9–$12 zone, but each bounce got weaker. By 261019, the stock topped near $11.00 and faded to $10.01. Then 261020 opened above $9.80 but closed at $8.39. Fast-forward to 261104, and AEHL closed at $6.27 after hitting a low of $6.17. That’s a clear pattern of distribution — late longs providing exit liquidity for the early crowd.
The intraday 5-minute chart confirms the story. AEHL has been printing wide candles, with moves from around $9.30 to $11.35 early in the session, then grinding into the $12–$13 range before slipping again. For day traders, this is ideal: strong liquidity, big ranges, and clear levels to trade around. For swing traders, it’s dangerous. Antelope Enterprise Holdings Limited has already shown it can cut in half or more in a single session.
When a stock like AEHL stretches so far above its book value, the edge comes from reading psychology, not spreadsheets. Horizontal levels from earlier highs and lows become more important than any ratio. Traders locked in on AEHL should map out those zones and focus on risk first, upside second.
Conclusion
AEHL sits at an interesting crossroads. Antelope Enterprise Holdings Limited has a reasonably clean balance sheet, with more equity than debt and tens of millions in assets backing a small-cap name. But the market is not trading AEHL on calm fundamentals. The price-to-book north of 40 and the violent swing from $30 to the mid-$6s show this is a pure momentum story right now.
For active traders, that’s both opportunity and danger. AEHL can offer huge intraday swings, as the 5-minute chart ranges around $9–$13 demonstrate. Those who treat Antelope Enterprise Holdings Limited as a long-term “hold and hope” play risk getting trapped in drawn-out downtrends after the big spike already happened.
The better approach is to treat AEHL like a trading vehicle, not a comfort blanket. Plan your entries near clear levels, define your exits before you click buy, and size small enough that a surprise halt or gap doesn’t wipe you out. As millionaire penny stock trader and teacher Tim Sykes, says, “It’s not about how much money you make; it’s about how much money you keep.”. As Tim Sykes loves to remind traders, “Cut losses quickly — that’s the only reason I’ve stayed in this game for decades.” AEHL will reward disciplined traders who respect volatility and punish anyone who confuses excitement with a safety net.
This is stock news, not investment advice. Timothy Sykes News delivers real-time stock market news focused on key catalysts driving short-term price movements. Our content is tailored for active traders and investors seeking to capitalize on rapid price fluctuations, particularly in volatile sectors like penny stocks. Readers come to us for detailed coverage on earnings reports, mergers, FDA approvals, new contracts, and unusual trading volumes that can trigger significant short-term price action. Some users utilize our news to explain sudden stock movements, while others rely on it for diligent research into potential investment opportunities.
Dive deeper into the world of trading with Timothy Sykes, renowned for his expertise in penny stocks. Explore his top picks and discover the strategies that have propelled him to success with these articles:
- Penny Stocks Trading Guide
- Best Penny Stocks Under $1 to Buy Today
- Top 8 Penny Stocks to Watch on Robinhood
Once you’ve got some stocks on watch, elevate your trading game with StocksToTrade the ultimate platform for traders. With specialized tools for swing and day trading, StocksToTrade will guide you through the market’s twists and turns.
Dig into StocksToTrade’s watchlists here:





Leave a reply