

Opendoor Technologies Inc faces added pressure from bearish housing-market outlooks as its stocks have been trading down by -5.38 percent.
Key Takeaways
- Price action in OPEN shows a steady pullback from the $2.50 area into the mid-$1.90s, signaling pressure on short-term momentum.
- Opendoor Technologies Inc is running negative margins and heavy cash burn, forcing reliance on debt to keep the model funded.
- OPEN holds close to $900M in cash, but leverage is high with total debt more than double equity.
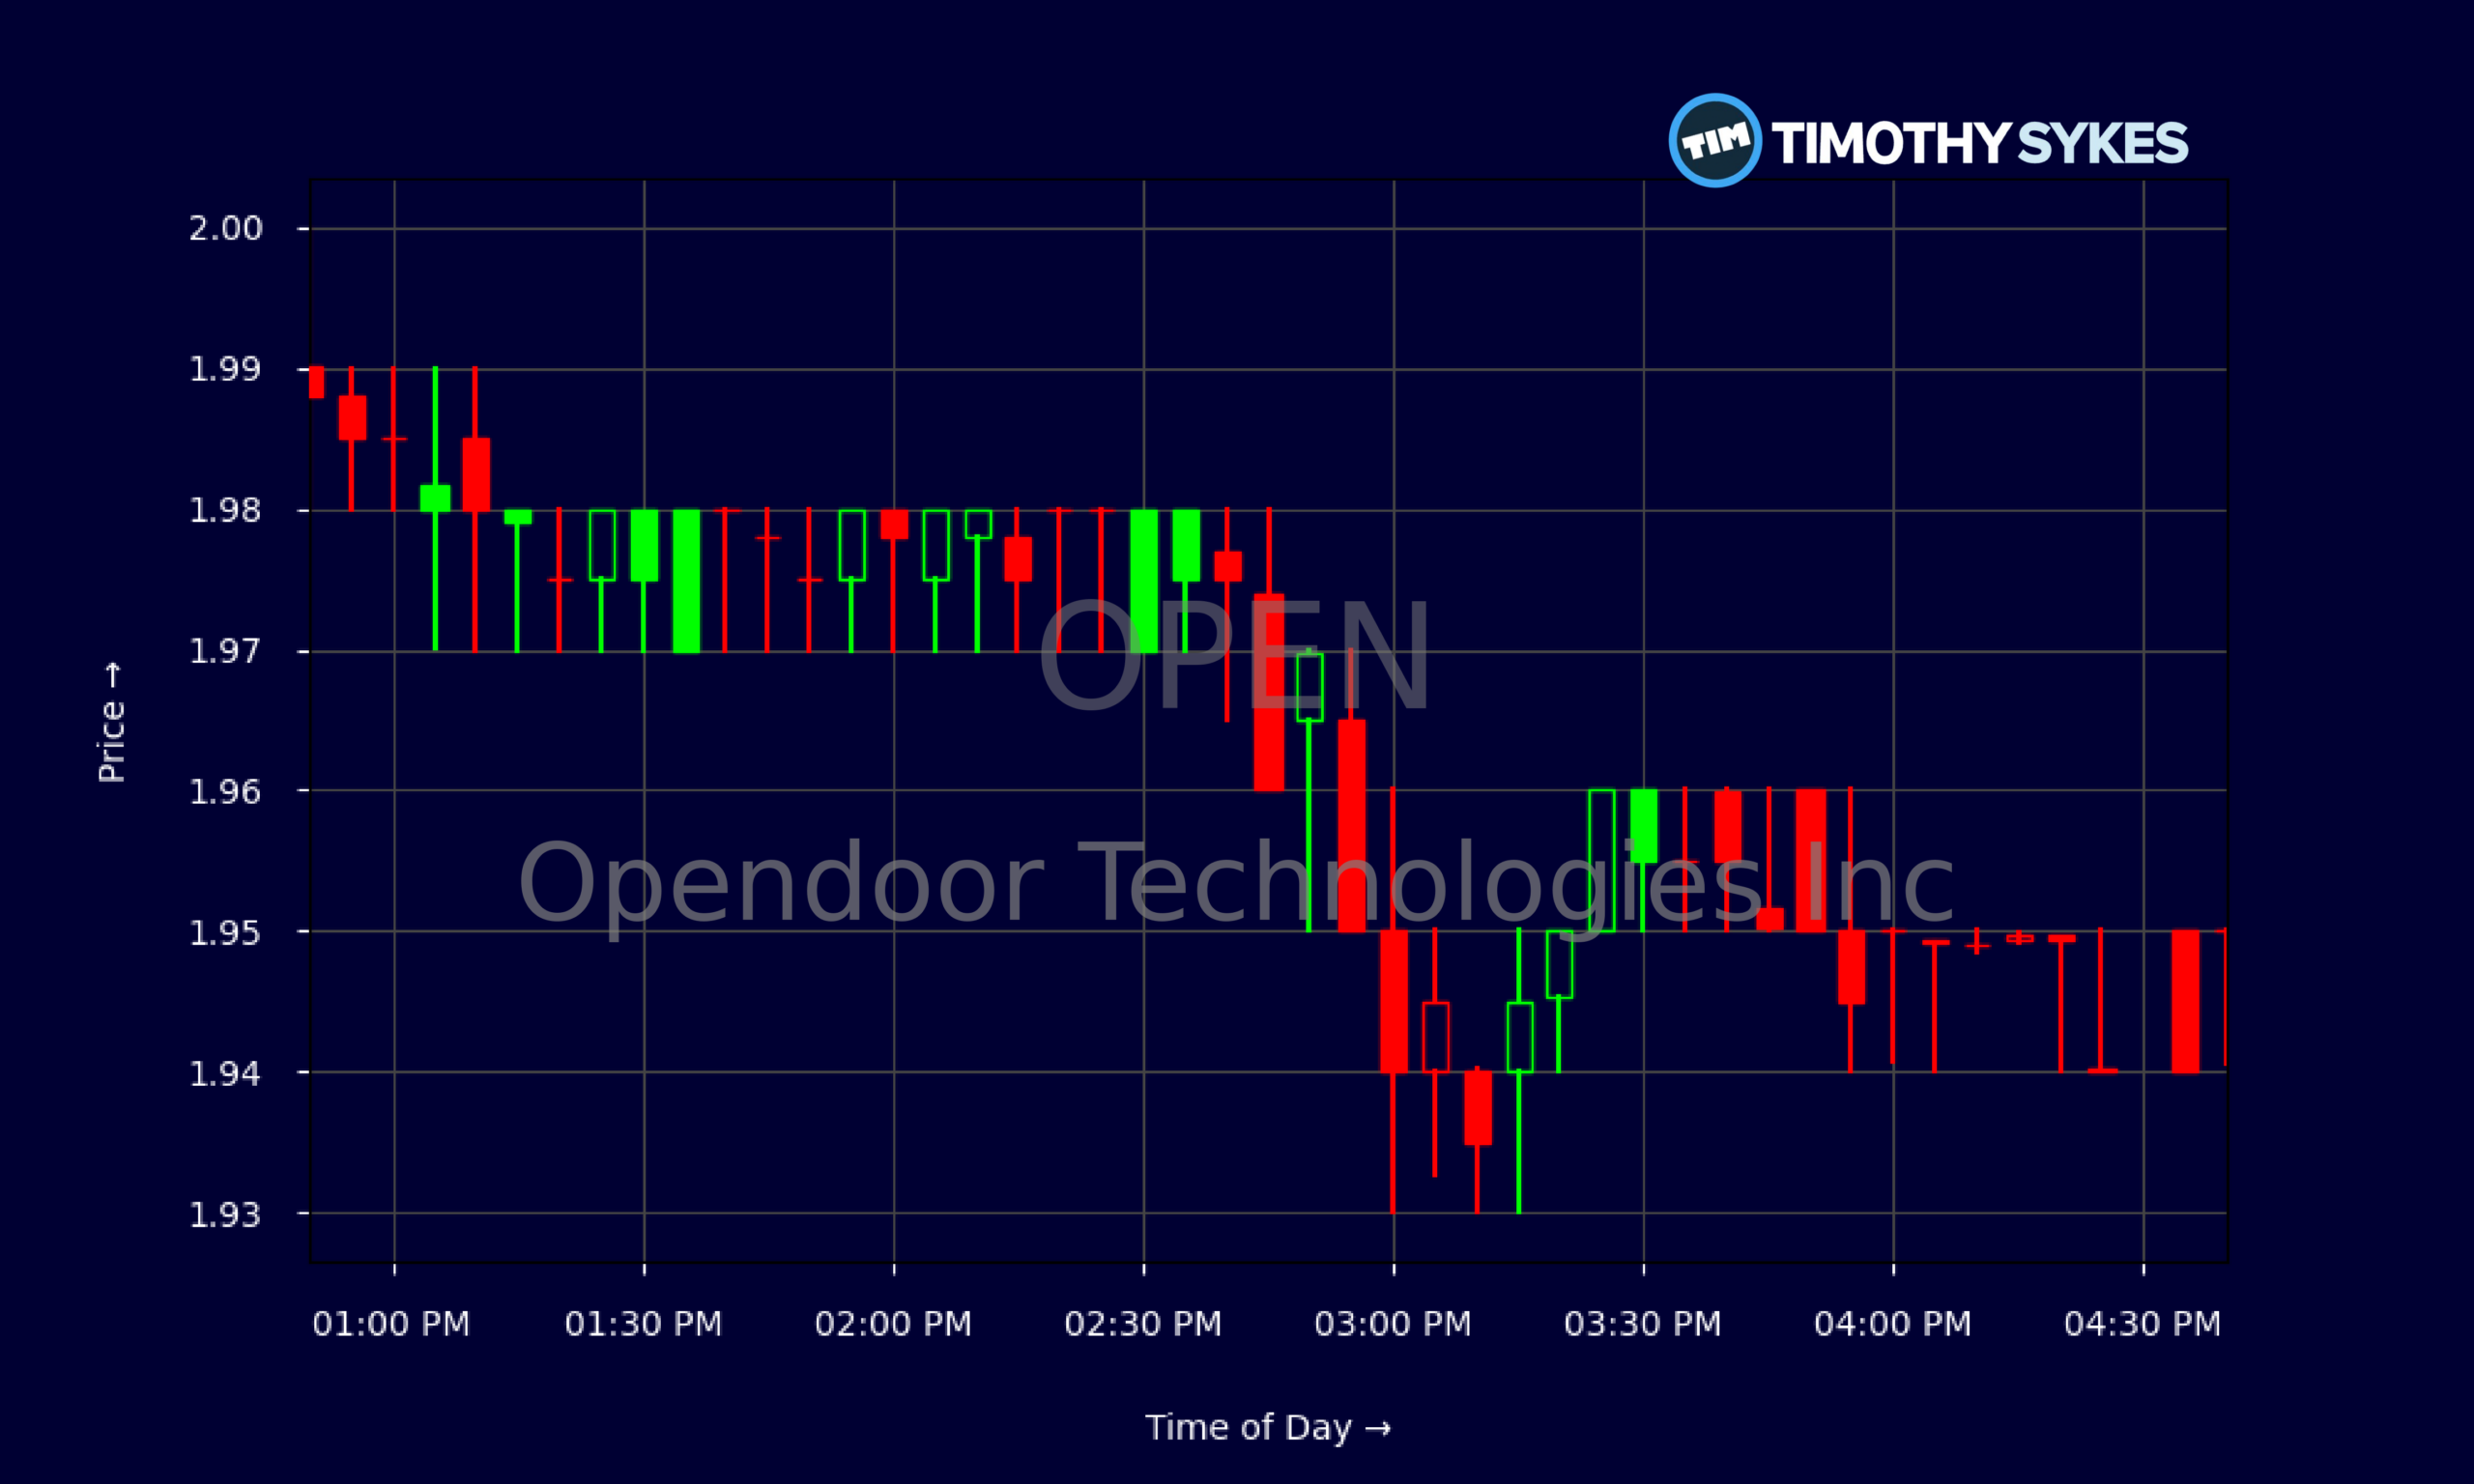
- Intraday trading in OPEN shows tight consolidation around $2, hinting at a potential squeeze or breakdown when volume returns.
Live Update At 16:46:41 EDT: On Wednesday, October 21, 2026 Opendoor Technologies Inc stock [NASDAQ: OPEN] is trending down by -5.38%! Discover the key drivers behind this movement as well as our expert analysis in the detailed breakdown below.
Quick Financial Overview
OPEN has been drifting lower on the daily chart, sliding from around $2.50 at the start of the period to roughly $1.95 on the latest close. For a low-priced name, that steady bleed matters. It tells traders that demand has cooled and dip buyers have not stepped up with size yet.
Under the hood, Opendoor Technologies Inc is still a turnaround story, not a finished product. The latest quarterly numbers show $883M in revenue but a net loss of $162M. That’s a business selling houses at scale yet still failing to convert volume into real profits. EBITDA is negative $123.9M, and operating cash flow sits at a heavy -$718M. Those are not small leaks.
More Breaking News
OPEN’s gross margin is only 8.6%, while profit margins are deeply negative. At the same time, the balance sheet carries about $1.96B in total debt against $914M of equity. Traders see a company with room to maneuver today, thanks to $896M in cash, but with real execution risk if the housing cycle or funding markets tighten.
Why Traders Are Watching OPEN’s Tight Trading Range
OPEN has spent the latest trading day trapped in a narrow band around $2, with most 5‑minute candles flipping between $1.94 and $2.02. For a volatile real-estate tech stock, that kind of tight range jumps out. It often means one thing: a bigger move is loading as traders wait for the next shove.
Zooming out, Opendoor Technologies Inc has already pulled back from the $2.40–$2.50 zone seen earlier in the month to sub‑$2 closes. The daily chart now shows a series of lower highs and lower lows. That classic downtrend pattern keeps short-biased traders engaged, but the stock hasn’t cracked in a panic. Instead, OPEN is hovering just under $2, where prior buyers are now underwater but still close enough to breakeven to react fast.
This is the kind of chart active traders in the Tim Sykes community study hard. OPEN offers clear levels: resistance up near $2.10–$2.15 from recent intraday highs, and support down around $1.90 from the latest low. A push through either side, on volume, can attract momentum trading — especially in a beaten-down housing name that still trades near 0.66x sales.
Opendoor Technologies Inc also shows classic “story vs. numbers” tension. The model of buying and flipping homes at scale is easy to pitch, but the financials are still ugly. Negative returns on equity near -197% and heavy free cash flow burn of about -$723M keep many longer-term market players cautious. Short-term traders, though, often see that pain as fuel for sharp squeezes whenever sentiment swings.
Conclusion
OPEN sits at an interesting crossroads. On one side, Opendoor Technologies Inc owns a sizable cash pile near $896M, strong working capital of about $1.88B, and a current ratio of 2.9. That gives the company time to adapt, cut costs, and refine its real-estate engine. On the other side, the business is still bleeding, with thin gross margins, steep losses, and leverage that magnifies execution risk if the housing market slows or funding costs rise.
For traders, the message is simple: treat OPEN as a trading vehicle, not a wishful story. The chart shows a clean downtrend into a tight consolidation zone around $2. The intraday tape confirms that big money is waiting. Breakouts over recent highs or cracks under recent lows are the levels that matter, not opinions.
Opendoor Technologies Inc will stay on many watchlists precisely because it combines volatile price action, heavy emotions around housing, and a balance sheet that leaves zero room for laziness. As Tim Sykes likes to remind traders, “Patterns repeat, but you must be prepared.” As millionaire penny stock trader and teacher Tim Sykes, says, “Preparation plus patience leads to big profits.”. With OPEN, preparation means knowing the key technical levels, understanding the ugly but detailed financials, and being ready to cut losses fast if the trade turns against you. This article is for educational and research purposes only and is not investment advice.
This is stock news, not investment advice. Timothy Sykes News delivers real-time stock market news focused on key catalysts driving short-term price movements. Our content is tailored for active traders and investors seeking to capitalize on rapid price fluctuations, particularly in volatile sectors like penny stocks. Readers come to us for detailed coverage on earnings reports, mergers, FDA approvals, new contracts, and unusual trading volumes that can trigger significant short-term price action. Some users utilize our news to explain sudden stock movements, while others rely on it for diligent research into potential investment opportunities.
Dive deeper into the world of trading with Timothy Sykes, renowned for his expertise in penny stocks. Explore his top picks and discover the strategies that have propelled him to success with these articles:
- Penny Stocks Trading Guide
- Best Penny Stocks Under $1 to Buy Today
- Top 8 Penny Stocks to Watch on Robinhood
Once you’ve got some stocks on watch, elevate your trading game with StocksToTrade the ultimate platform for traders. With specialized tools for swing and day trading, StocksToTrade will guide you through the market’s twists and turns.
Dig into StocksToTrade’s watchlists here:





Leave a reply