

Leverage Shares 2X Long SPCX Daily climbs as upbeat SPAC-sector sentiment fuels risk-on appetite, and stocks have been trading up by 13.98 percent.
Key Takeaways
- Recent trading shows SPCH swinging more than 20% off its highs, a classic leveraged ETF rollercoaster that momentum traders track closely.
- Daily charts for Leverage Shares 2X Long SPCX Daily reveal sharp intraday reversals, highlighting both opportunity and elevated risk.
- SPCH has broken down from the $13 area toward the high-$8s, with short-term bounces offering potential day-trading setups.
- Thin fundamental data shifts the focus almost entirely to price action, volatility, and disciplined risk management for SPCH traders.
Live Update At 07:48:04 EDT: On Wednesday, October 21, 2026 Leverage Shares 2X Long SPCX Daily stock [BATS Global Markets: SPCH] is trending up by 13.98%! Discover the key drivers behind this movement as well as our expert analysis in the detailed breakdown below.
Quick Financial Overview
SPCH, the Leverage Shares 2X Long SPCX Daily product, is built for traders who want amplified moves, not quiet buy‑and‑hold exposure. The recent chart tells that story clearly. In early October, SPCH was trading near $12.88, and within days it pushed above $13 before rolling over. From there, Leverage Shares 2X Long SPCX Daily faded hard, sliding toward the $9 area and recently closing around $9.40–$9.50.
That is a big swing in a short window. For traders, those moves translate into opportunity if they respect the leverage. SPCH has no traditional earnings or margin profile to lean on, so the normal valuation ratios are blank. This makes SPCH almost a pure technical trading vehicle.
More Breaking News
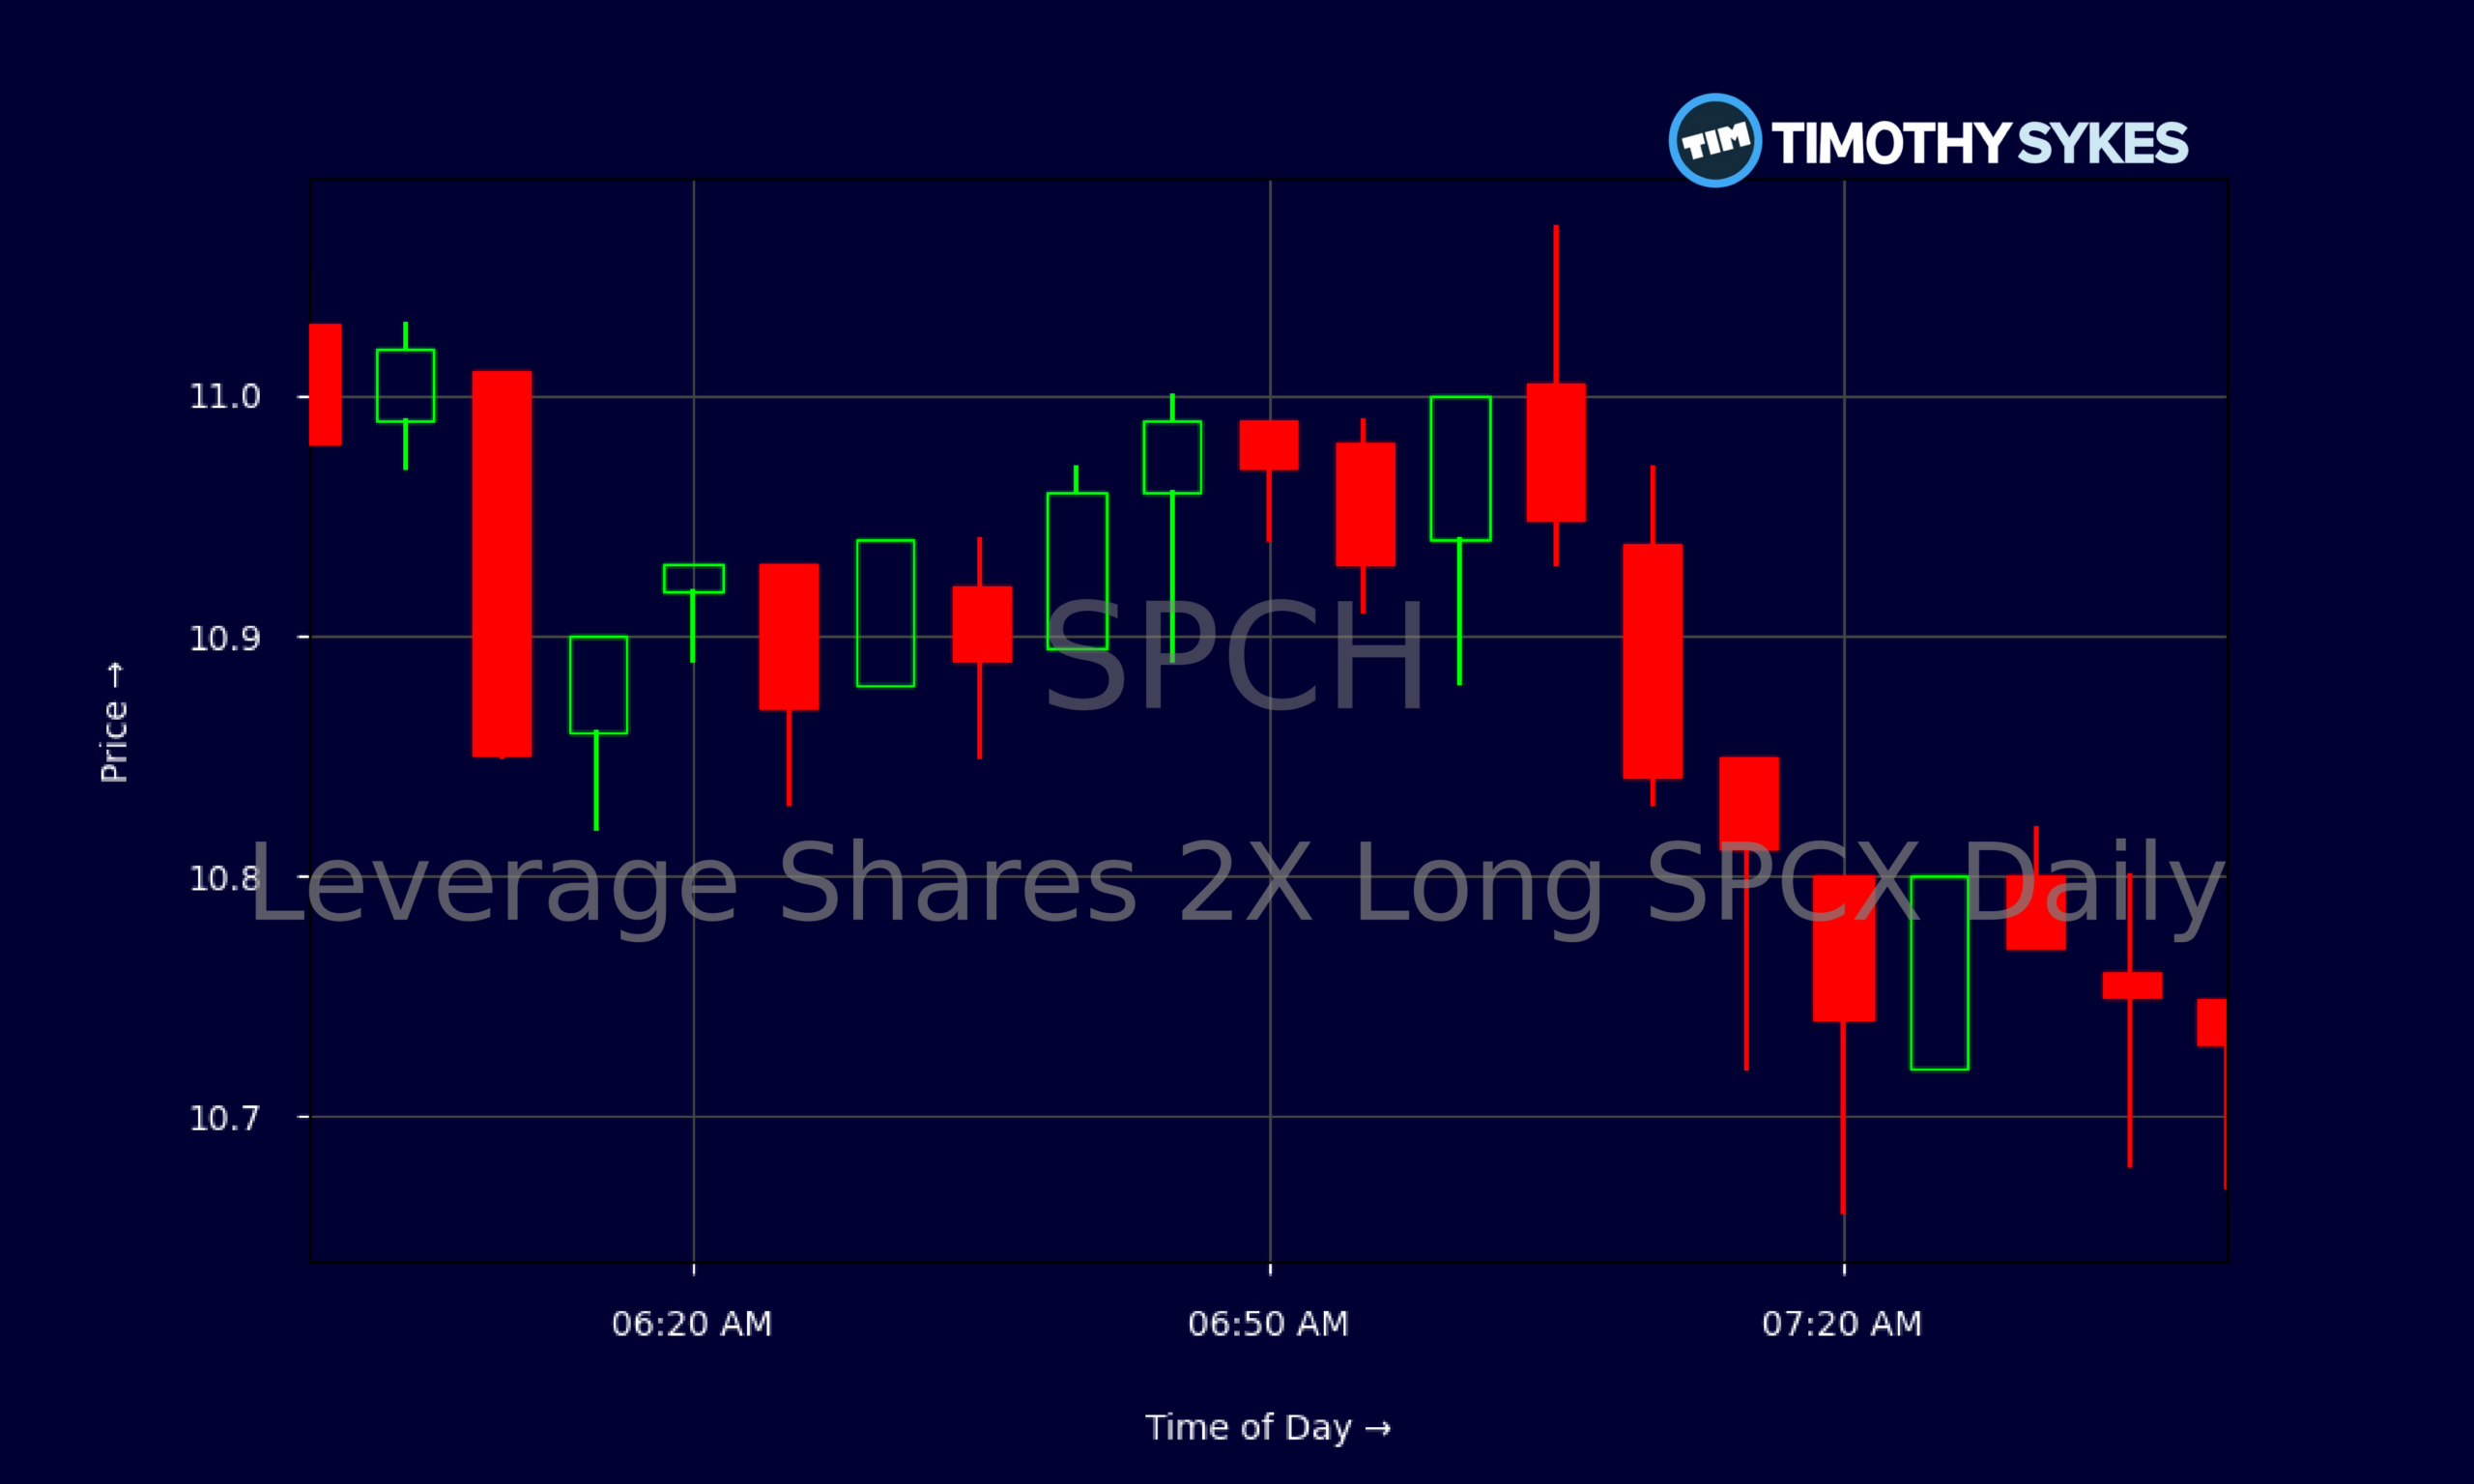
Intraday data reinforces the theme. SPCH has been oscillating tightly around $11 in the premarket, with frequent $0.10–$0.20 swings in minutes. For a lower-priced leveraged product, that volatility compounds fast. Leverage Shares 2X Long SPCX Daily rewards timing and punishes hesitation, so traders need clear plans, tight stops, and a solid handle on broader market direction.
Why Traders Are Watching SPCH’s Volatility Spike
SPCH has turned into a textbook case of leveraged momentum in action. Leverage Shares 2X Long SPCX Daily pushed from sub-$10 levels at the start of the month up to the mid-$12s and even touched above $13, then reversed sharply. That kind of round‑trip invites active traders who thrive on fast swings.
Look at the daily candles: long wicks, wide ranges, multiple $1+ intraday traverses. SPCH printed highs near $13.55 and then, over several sessions, stair‑stepped lower with closes around $12.91, $12.23, $11.21, and finally under $10. Each failed bounce offered short‑term trading setups both long and short, depending on a trader’s style. Leverage Shares 2X Long SPCX Daily does not drift; it jolts.
On the intraday 5‑minute chart, SPCH trades like a scalper’s playground. Between 06:00 and 07:30, price chopped between roughly $10.80 and $11.05, with quick pops and fades every few minutes. That shows active participation and plenty of liquidity for tight risk control. Traders eye SPCH because it magnifies moves in the underlying target exposure, letting them express a bullish momentum thesis with added juice.
The catch is decay and whipsaw risk. SPCH is designed for short‑term trading, not long‑term holding. Every mis-timed entry in Leverage Shares 2X Long SPCX Daily can snowball faster due to the 2X structure. That’s why seasoned momentum traders track intraday levels, prior day highs and lows, and overall market tone before pressing size.
Conclusion
SPCH sits in that niche of products built for traders who live on volatility. Leverage Shares 2X Long SPCX Daily does not offer comforting balance sheet metrics, dividend streams, or clean valuation ratios. Instead, it offers speed. The recent move from the $13s down toward the high‑$8s shows what happens when momentum reverses on a leveraged ETF.
For day traders and short‑term swing traders, SPCH’s job is clear: provide amplified exposure and tight technical levels to trade against. Every prior high, low, and consolidation zone on the chart becomes a reference point. A reclaim of $10, a push back toward $11, or a breakdown under recent lows all set up potential trading plans, but only for those who define risk first.
This is exactly the kind of setup Tim Sykes and his community study nonstop. As Tim likes to say, “The market rewards discipline, not hope. Cut losses quickly, protect your buying power, and only come back to battle when the odds are in your favor.” As millionaire penny stock trader and teacher Tim Sykes, says, “Preparation plus patience leads to big profits.”. SPCH, the Leverage Shares 2X Long SPCX Daily product, fits that mindset perfectly. Treat it as a short‑term trading vehicle, respect the leverage, and let the price action—not emotion—drive decisions. This article is for educational and research purposes only and is not investment advice.
This is stock news, not investment advice. Timothy Sykes News delivers real-time stock market news focused on key catalysts driving short-term price movements. Our content is tailored for active traders and investors seeking to capitalize on rapid price fluctuations, particularly in volatile sectors like penny stocks. Readers come to us for detailed coverage on earnings reports, mergers, FDA approvals, new contracts, and unusual trading volumes that can trigger significant short-term price action. Some users utilize our news to explain sudden stock movements, while others rely on it for diligent research into potential investment opportunities.
Dive deeper into the world of trading with Timothy Sykes, renowned for his expertise in penny stocks. Explore his top picks and discover the strategies that have propelled him to success with these articles:
- Penny Stocks Trading Guide
- Best Penny Stocks Under $1 to Buy Today
- Top 8 Penny Stocks to Watch on Robinhood
Once you’ve got some stocks on watch, elevate your trading game with StocksToTrade the ultimate platform for traders. With specialized tools for swing and day trading, StocksToTrade will guide you through the market’s twists and turns.
Dig into StocksToTrade’s watchlists here:





Leave a reply