
Ondas Inc stocks have been trading down by -9.13 percent after dilutive equity financing news dampened investor confidence.
Key Takeaways
- ONDS has slipped from recent highs near $7, with the latest close around $5.29 showing a clear near-term pullback on the daily chart.
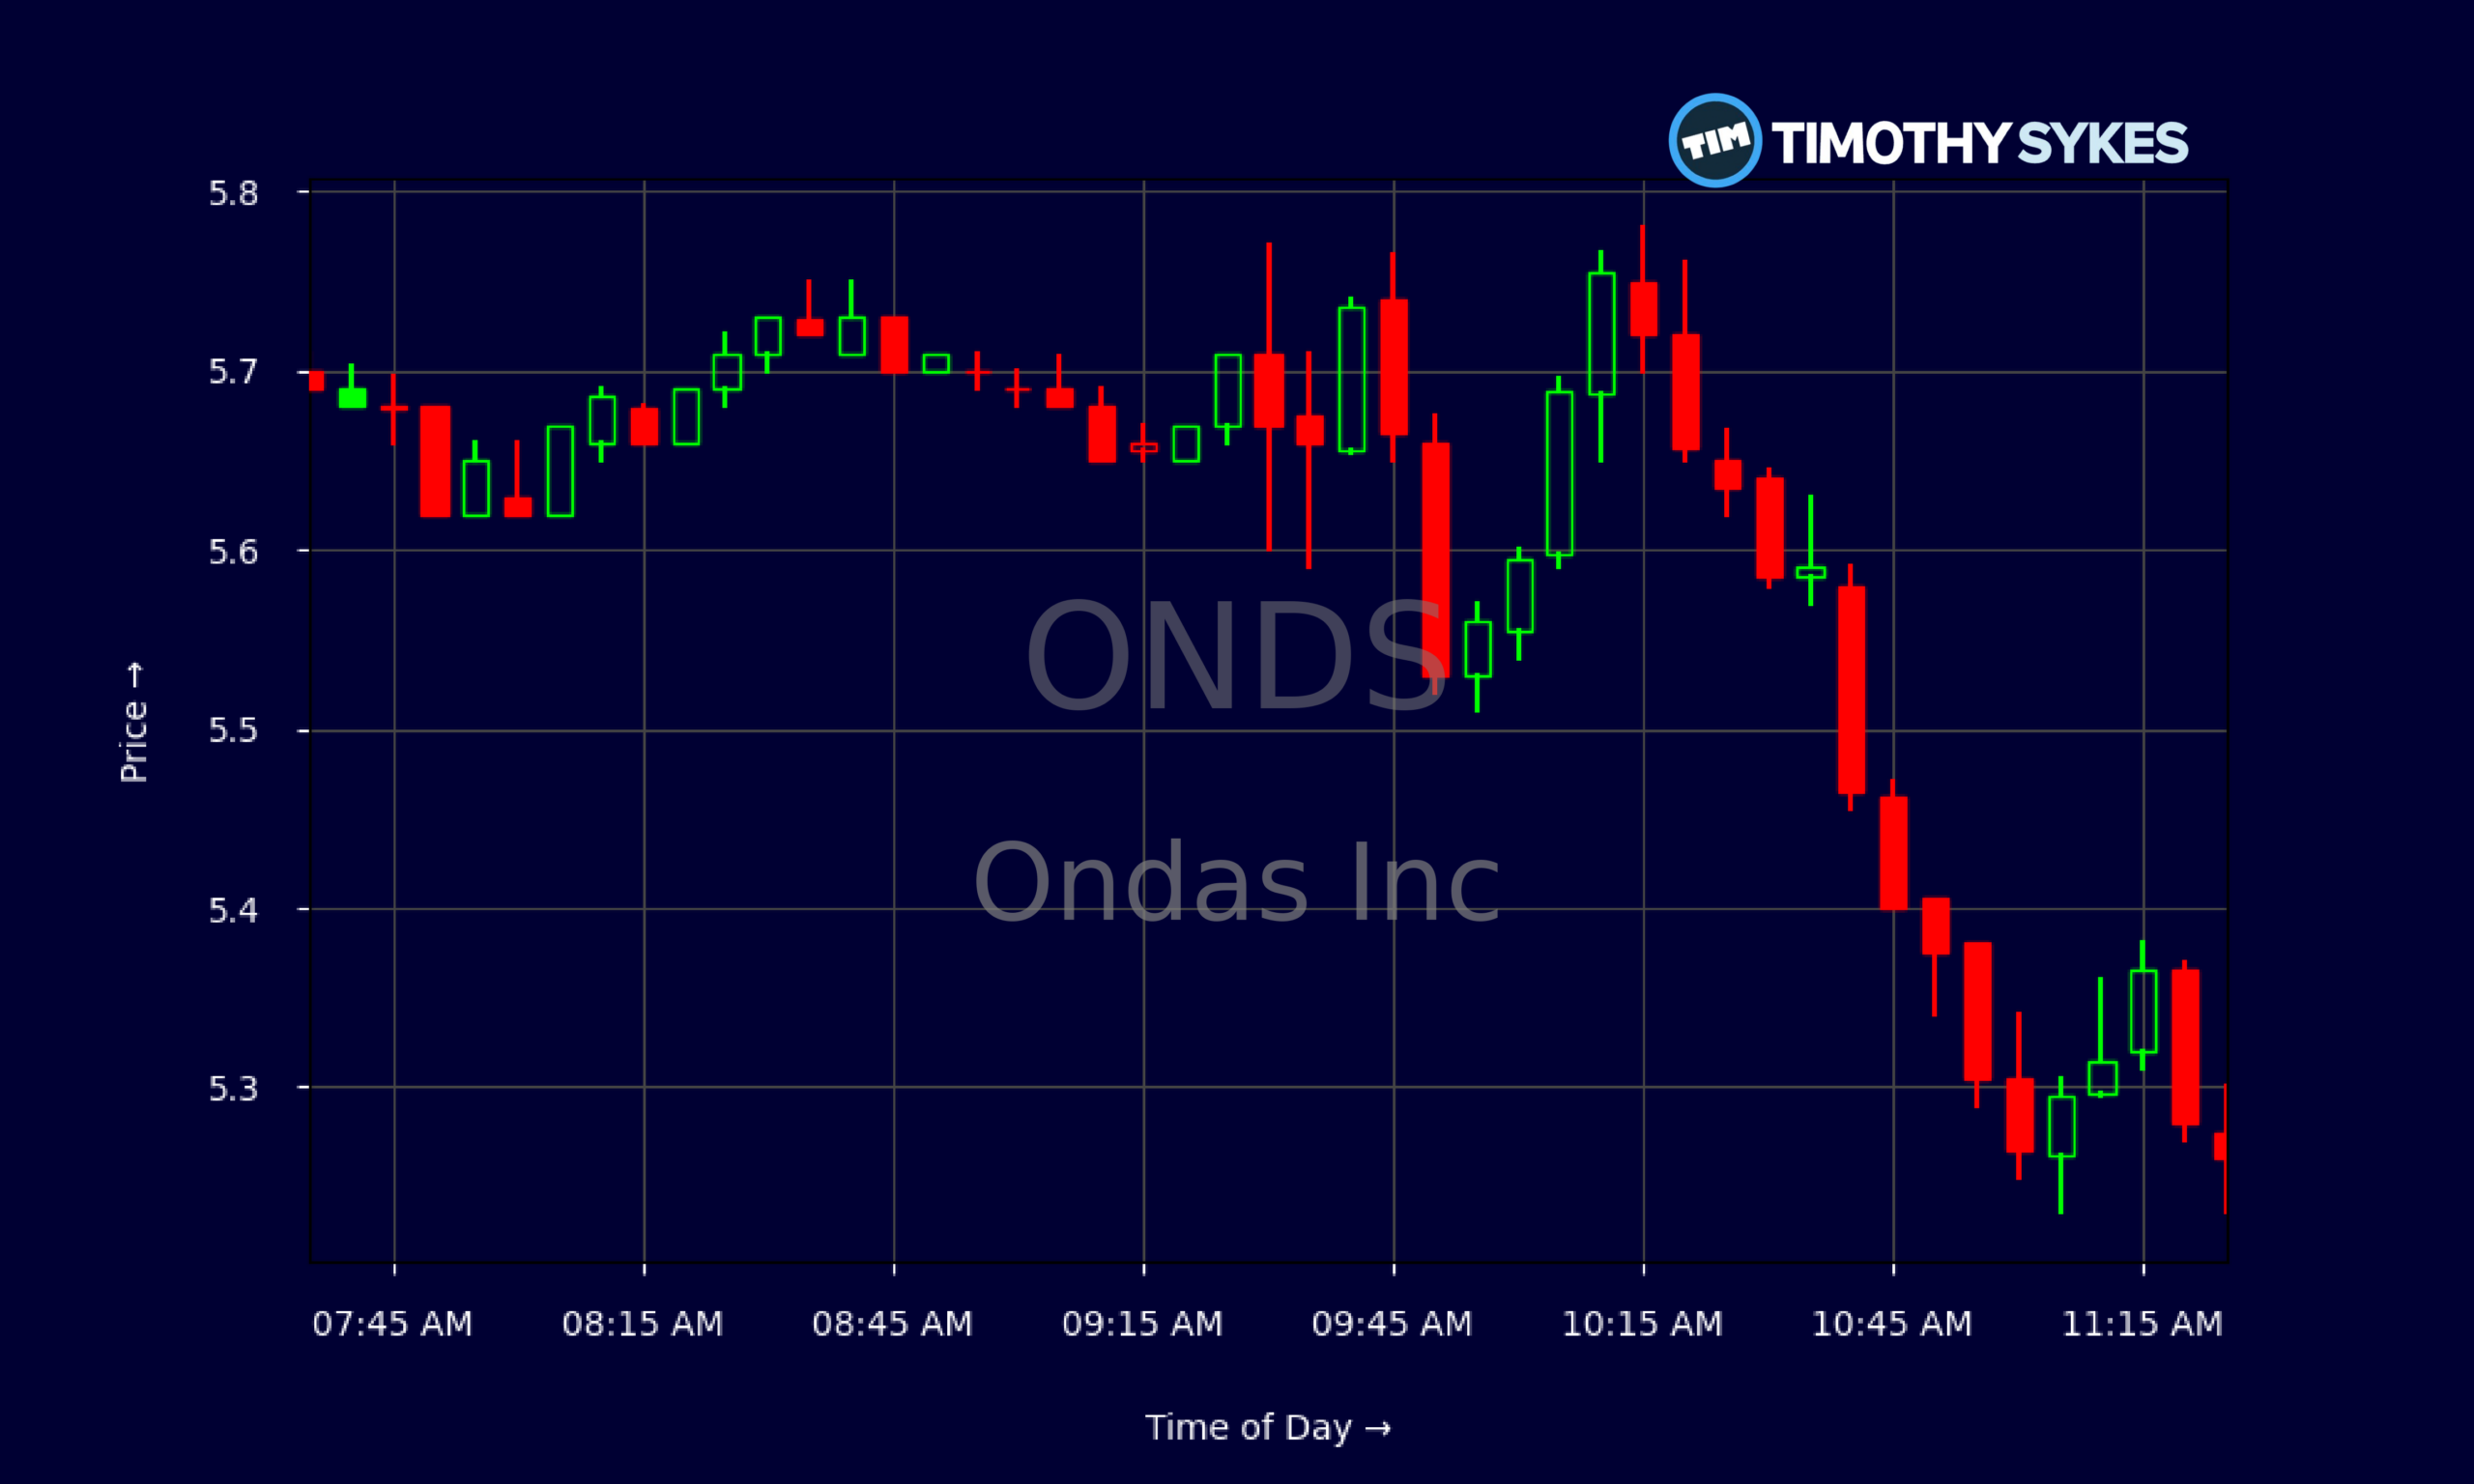
- Intraday ONDS trading shows a tight range around $5.50–$5.90, signaling consolidation after the recent slide and a potential setup for the next trend move.
- Ondas Inc reports about $50.7M in annual revenue with rapid multi‑year growth, but cash flow remains negative and losses are sizable.
- ONDS carries very low debt and a strong liquidity profile, giving the company room to absorb volatility while it works toward better operating efficiency.
- Active traders are focusing on recent support and resistance levels in ONDS as the chart decides whether this is a dip buy or a breakdown.
Live Update At 11:32:35 EST: On Wednesday, November 04, 2026 Ondas Inc stock [NASDAQ: ONDS] is trending down by -9.13%! Discover the key drivers behind this movement as well as our expert analysis in the detailed breakdown below.
Quick Financial Overview
Ondas Inc gives traders a classic growth‑versus‑profitability puzzle. ONDS generates roughly $50.7M in revenue, and that top line has grown sharply over the last three to five years. The revenue ramp is real. But profitability is not there yet. ONDS posted a quarterly net loss of about $88.6M and negative operating cash flow of roughly $86.1M, which means the business is still burning a lot of cash to grow.
The balance sheet is the bright spot. Ondas Inc reports about $657.9M in cash and $1.38B when you include short‑term investments, versus only about $4.1M in long‑term debt and $2.3M in current debt. For traders, that means ONDS has runway; it is not a balance‑sheet fire drill.
More Breaking News
Valuation is rich on some metrics. A price‑to‑sales ratio above 22 tells you traders are already paying up for future potential, not current earnings. ONDS also shows a low asset turnover and negative returns on capital, which confirm the story of a company still in build‑out mode. For short‑term traders, that combination often leads to sharp swings as sentiment flips between growth hopes and cash‑burn reality.
Why Traders Are Watching ONDS Price Action
The ONDS chart is where the real story sits right now. Over the past several weeks, Ondas Inc ran from above $7 on 2026/10/12 down to about $5.29 on 2026/11/04. That is a sizable drawdown, and it changes the psychology. Earlier in October, ONDS held the mid‑$6s to upper‑$6s, with multiple closes between $6.50 and $6.90. Now the stock is trading well below those levels, which turn into overhead resistance zones that many longs are watching.
Zoom in to the intraday action and you see a different feel. ONDS is chopping between roughly $5.20 and $5.90 with many five‑minute candles overlapping. That is classic consolidation after a selloff. Buyers are stepping in near the low $5s, but they are not strong enough yet to push ONDS back above $6 and hold it. For active trading, that creates a clear battlefield.
If ONDS cracks convincingly below the recent low around $5.23, momentum shorts will likely lean in, targeting a possible flush. If it reclaims and holds the $5.80–$6.00 area with volume, dip‑buyers may frame this as a higher‑risk bounce play. Because Ondas Inc has high growth, rich valuation, and big losses, sentiment can shift fast. That is the type of stock where liquidity and volatility tend to spike once a clear direction shows up. Traders who specialize in ONDS‑type names are watching the tape closely for that shift.
Conclusion
For traders, Ondas Inc sits at an important crossroads. ONDS has the balance sheet and revenue growth profile that momentum traders like to see, but the heavy losses and negative free cash flow around -$93.8M remind everyone this is still a work in progress. The recent slide from the $6–$7 zone into the low $5s forced many late longs underwater and reset expectations.
Going forward, ONDS will trade on two main forces: the chart and the burn rate. If Ondas Inc can show any path toward narrowing losses while keeping revenue growth intact, the rich price‑to‑sales multiple looks easier to justify, and traders may reward the stock with another leg higher. If not, every pop into prior resistance near $6–$6.50 risks becoming a sell zone.
This is exactly the kind of setup Tim Sykes and his community study every day: a volatile chart, strong story, weak bottom line. As Tim likes to say, “The market doesn’t care about your opinion, only your preparation.” As millionaire penny stock trader and teacher Tim Sykes, says, “It’s better to go home at zero than to go home in the red.”. For ONDS, that preparation means mapping support and resistance, tracking volume, and being ready to cut losses quickly if the key levels fail. This article is for educational and research purposes only and is not investment advice.
This is stock news, not investment advice. Timothy Sykes News delivers real-time stock market news focused on key catalysts driving short-term price movements. Our content is tailored for active traders and investors seeking to capitalize on rapid price fluctuations, particularly in volatile sectors like penny stocks. Readers come to us for detailed coverage on earnings reports, mergers, FDA approvals, new contracts, and unusual trading volumes that can trigger significant short-term price action. Some users utilize our news to explain sudden stock movements, while others rely on it for diligent research into potential investment opportunities.
Dive deeper into the world of trading with Timothy Sykes, renowned for his expertise in penny stocks. Explore his top picks and discover the strategies that have propelled him to success with these articles:
- Penny Stocks Trading Guide
- Best Penny Stocks Under $1 to Buy Today
- Top 8 Penny Stocks to Watch on Robinhood
Once you’ve got some stocks on watch, elevate your trading game with StocksToTrade the ultimate platform for traders. With specialized tools for swing and day trading, StocksToTrade will guide you through the market’s twists and turns.
Dig into StocksToTrade’s watchlists here:




Leave a reply