

Nebius Group N.V. stocks have been trading down by -3.06 percent amid concerns over slowing cloud growth and competitive pressures.
Key Takeaways
- GPU data-center names, including Nebius Group NBIS, booked share gains even as Elon Musk warned debt markets have “almost entirely shut off” to AI data centers without strong non-AI revenue.
- WallStreetBets-favored stocks, including NBIS, staged 1%–4% premarket rebounds after a sharp Friday slide, highlighting fast sentiment-driven bounces.
- Nebius Group NBIS has also seen repeated premarket drops of 2%–5%, signaling persistent pressure across WSB-linked names.
- NBIS has given back prior gains multiple times, including a roughly 4% premarket slide during a broad retreat in meme-style favorites.
- Recent 3%+ premarket declines for Nebius Group NBIS show growing weakness as retail chatter turns more cautious.
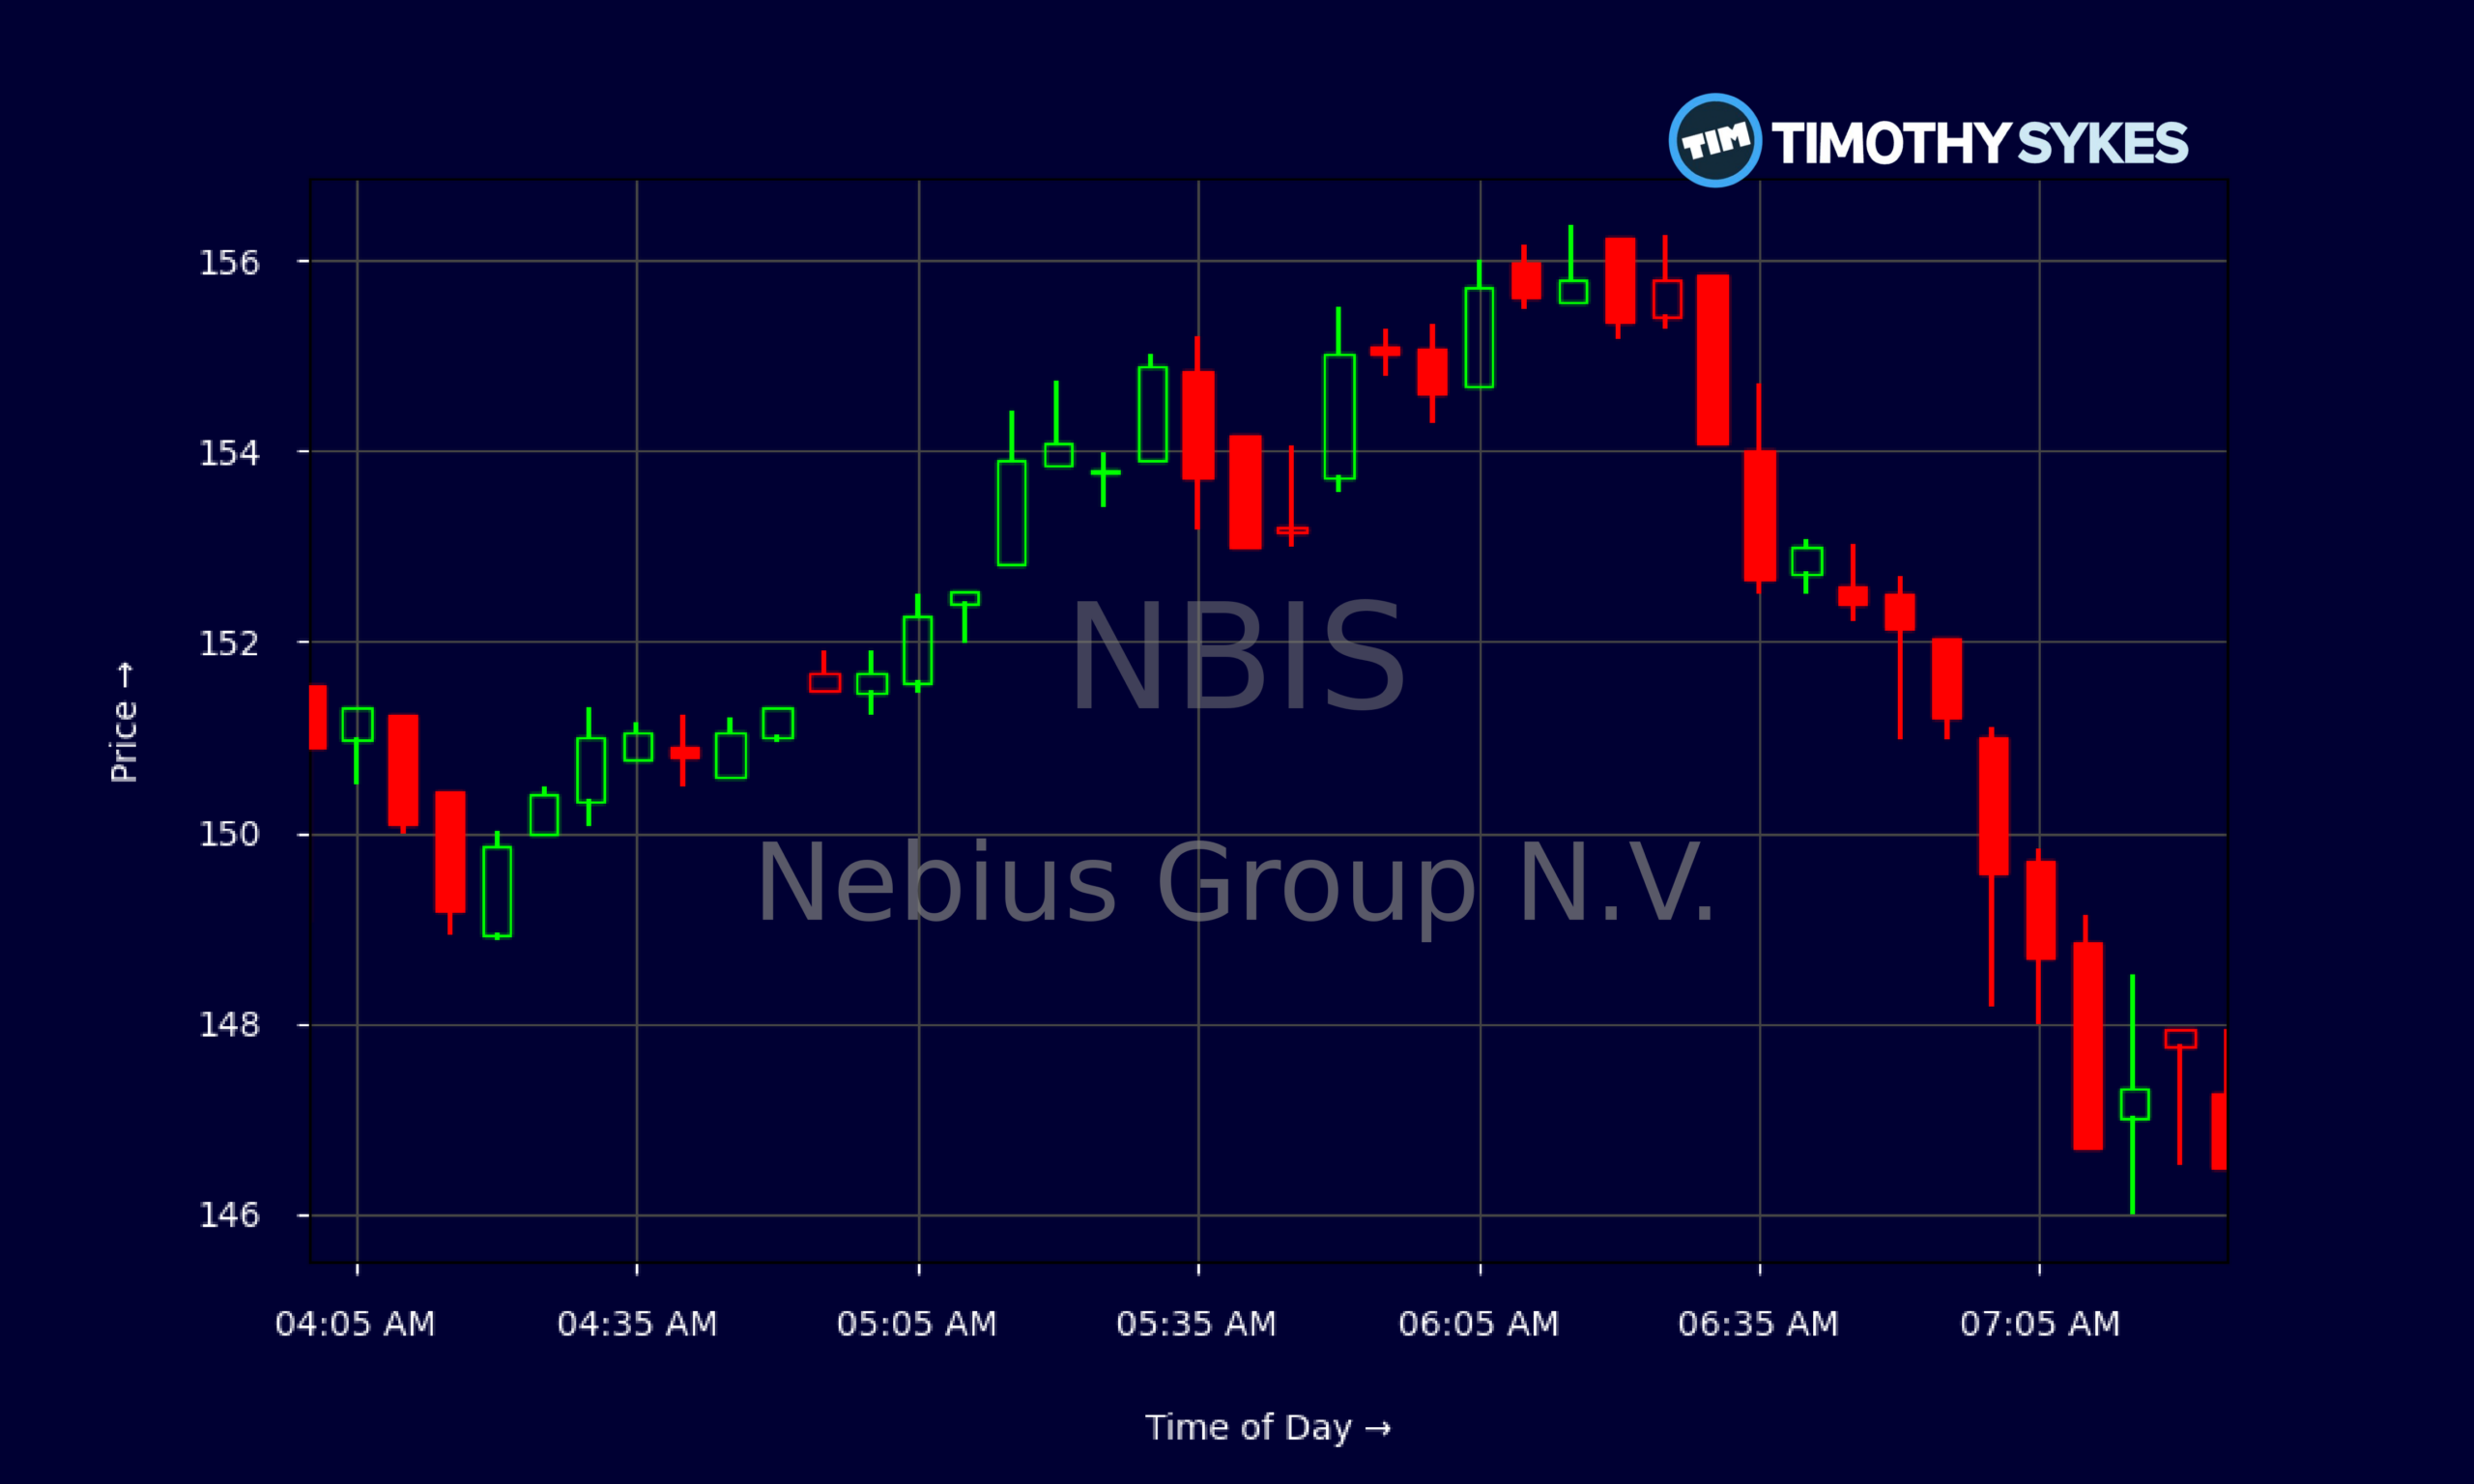
Live Update At 07:32:39 EST: On Wednesday, November 04, 2026 Nebius Group N.V. stock [NASDAQ: NBIS] is trending down by -3.06%! Discover the key drivers behind this movement as well as our expert analysis in the detailed breakdown below.
Quick Financial Overview
Nebius Group N.V. (NBIS) trades like a high‑beta AI infrastructure and meme hybrid, and the numbers back up how extreme this name is. Over the last several sessions, NBIS has dropped from a recent high near $217 to around $152–$155, a drawdown of roughly 25%–30%. That’s a serious rollercoaster in a short window, even by momentum standards.
Daily candles show wide ranges. One day NBIS spikes from roughly $159 to $182 and closes strong. A few sessions later, it’s printing lows near $141 before bouncing to the low $150s. Intraday 5‑minute data reinforces this choppy tone: the stock repeatedly fades from the mid‑$150s back toward $150, then snaps back. For traders, that’s textbook scalp territory, but only with tight risk.
More Breaking News
Fundamentals are just as extreme. NBIS posted about $529.8M in revenue, yet its price-to-sales ratio sits near 9,546x and price-to-book above 1,100x. The company carries a pretax loss margin around -1.7% and negative return on equity, even though balance sheet leverage (about 2.7x) and long‑term debt of roughly $4.1B show it is not a tiny story stock. Nebius Group NBIS is being priced like a pure growth and speculation vehicle, not a steady cash machine, which active traders must respect in their sizing and timing.
Why Traders Are Watching Nebius Group NBIS
Traders crowd into Nebius Group NBIS because it sits at the crossroads of two of the hottest themes in the market: AI data centers and WallStreetBets momentum. That combination can fuel powerful spikes, but it also sets up brutal reversals when sentiment cools.
On 2026/10/26, Nebius was grouped with Neocloud, IREN, Applied Digital, TeraWulf, and CoreWeave as GPU data-center operators enjoying share gains. The AI build‑out story is clear: markets are rewarding any player tied to GPU capacity. At the same time, Elon Musk warned that debt markets have “almost entirely shut off” to AI data centers without meaningful non‑AI revenue, while Morgan Stanley flagged financing and capacity‑deployment uncertainty for CoreWeave. Those warnings hang over the whole group, and that includes NBIS.
For Nebius Group NBIS, the tape shows exactly how that tension plays out. On 2026/10/19, NBIS and other WallStreetBets favorites bounced 1%–4% premarket after a rough Friday, classic short‑term relief in a beaten‑down basket. But surrounding that bounce, the stock logged a series of premarket drops: down about 2.1% after a nearly 5% loss the prior Monday, off roughly 4% giving back gains from the day before, down 3.8% pre‑bell with no fresh company news, and later sliding another 3.1% after a small loss the previous session.
Most of these moves tied directly to WallStreetBets chatter rather than new fundamentals. When the broader WSB basket turned red, Nebius Group NBIS went with it, while Microsoft was one of the few names to buck the trend. That tells traders NBIS currently trades more like a sentiment ticker than a pure AI infrastructure value play. The edge here comes from reading flow and social momentum, not from waiting on slow‑moving fundamentals.
Conclusion
Nebius Group N.V. sits in a fascinating spot for active traders. On one hand, NBIS offers exposure to GPU data centers, a core pillar of the AI build‑out. On the other, its price action is dominated by WallStreetBets flows, premarket gaps, and fast givebacks. The fundamentals show a large balance sheet and real assets, but also thin margins and extreme valuation metrics. That blend keeps the stock firmly in the speculative camp.
Recent trading tells the story. Nebius Group NBIS can pop 1%–4% premarket with the meme crowd, then drop 3%–5% the next session just because sentiment flipped. Big daily ranges from the $140s to the $180s and back again reward disciplined traders who plan entries and exits, but they punish anyone who overstays or averages down blindly. In that context, risk management and locking in gains quickly become paramount for anyone stepping into this ticker.
For those studying NBIS, this is a live case study in sector hype colliding with funding risk and social‑media‑driven trading. Elon Musk’s warning about debt markets “almost entirely” closing to AI data centers without diversified revenue adds another layer of macro pressure over time.
As Tim Sykes likes to say, “The market doesn’t care about your feelings; it cares about your discipline.” As millionaire penny stock trader and teacher Tim Sykes, says, “It’s not about how much money you make; it’s about how much money you keep.”. With Nebius Group NBIS, discipline means recognizing that this is a momentum vehicle first and an AI data-center story second, and sizing every trade as if the next candle can move far more than you expect. This article is for educational and research purposes only and is not investment advice.
This is stock news, not investment advice. Timothy Sykes News delivers real-time stock market news focused on key catalysts driving short-term price movements. Our content is tailored for active traders and investors seeking to capitalize on rapid price fluctuations, particularly in volatile sectors like penny stocks. Readers come to us for detailed coverage on earnings reports, mergers, FDA approvals, new contracts, and unusual trading volumes that can trigger significant short-term price action. Some users utilize our news to explain sudden stock movements, while others rely on it for diligent research into potential investment opportunities.
Dive deeper into the world of trading with Timothy Sykes, renowned for his expertise in penny stocks. Explore his top picks and discover the strategies that have propelled him to success with these articles:
- Penny Stocks Trading Guide
- Best Penny Stocks Under $1 to Buy Today
- Top 8 Penny Stocks to Watch on Robinhood
Once you’ve got some stocks on watch, elevate your trading game with StocksToTrade the ultimate platform for traders. With specialized tools for swing and day trading, StocksToTrade will guide you through the market’s twists and turns.
Dig into StocksToTrade’s watchlists here:





Leave a reply