
NVIDIA Corporation stocks have been trading down by -2.42 percent amid heightened concerns over AI chip demand sustainability and valuation.
Key Takeaways
- Donald Trump sold between $500,001 and $1M of Nvidia shares on 2026/08/21, a headline that grabbed retail attention.
- Wallstreetbets-favored names, including NVDA, are bouncing in premarket trading after a sharp Friday selloff.
- Premarket gains of roughly 1%–4% across Nebius Group, Sandisk, AMD, Micron, Western Digital, AST SpaceMobile, CoreWeave, and Nvidia confirm aggressive dip buying.
- NVDA’s fundamentals remain unusually strong even as headline and meme flows drive short-term volatility.
Live Update At 09:19:03 EDT: On Friday, October 30, 2026 NVIDIA Corporation stock [NASDAQ: NVDA] is trending down by -2.42%! Discover the key drivers behind this movement as well as our expert analysis in the detailed breakdown below.
Quick Financial Overview
Strip away the drama and NVDA is still a financial machine. The latest quarterly numbers show total revenue of about $96.2B with gross profit near $72.1B, translating to a huge gross margin around 75%. That tells traders NVDA still has serious pricing power in its core AI and data center lines.
Profitability metrics are off the charts. Operating income sits around $63.7B and net income is roughly $59.7B. That pushes profit margins above 60% and returns on equity well into triple digits. For traders, this means NVDA has room to weather news shocks without breaking its long-term story.
More Breaking News
Valuation is rich but not bubble-level by its own history. NVDA trades at a price-to-earnings ratio near 29 and price-to-sales around 18, well below its five-year P/E peak above 140. Balance sheet strength backs that up: a current ratio of 4.6, low debt-to-equity of 0.17, and more than $62B in cash, equivalents, and short-term investments. NVDA’s free cash flow near $21.4B shows the company can keep funding growth, buybacks, and dividends while the tape stays choppy.
Why Traders Are Watching NVDA Price Swings
NVDA is sitting at the crossroads of meme-style volatility and mega-cap fundamentals, and that mix is exactly why traders keep coming back. The news that Donald Trump sold between $500,001 and $1M of Nvidia shares on 2026/08/21 throws extra gasoline on the narrative. When a political figure of that profile cuts exposure, short-term traders start asking the only question that matters to them: is this an early read on sentiment, or just profit taking after a massive run?
On the tape, NVDA has been grinding lower from the mid-$230s earlier in the month toward the low $210s more recently. Daily closes have slipped from about $239 on 261006 down into the $213–$218 band in the final days of the series, a controlled pullback rather than a collapse. That’s the kind of staircase fade momentum traders watch for reclaim levels and failed breakdowns.
At the same time, NVDA is lumped in with the Wallstreetbets-favored crowd. Premarket action now shows a modest 1%–4% rebound across Nebius Group, Sandisk, AMD, Micron, Western Digital, AST SpaceMobile, CoreWeave, and Nvidia. That bounce signals aggressive dip buying from retail-focused traders who still believe NVDA is the alpha dog of the AI trade.
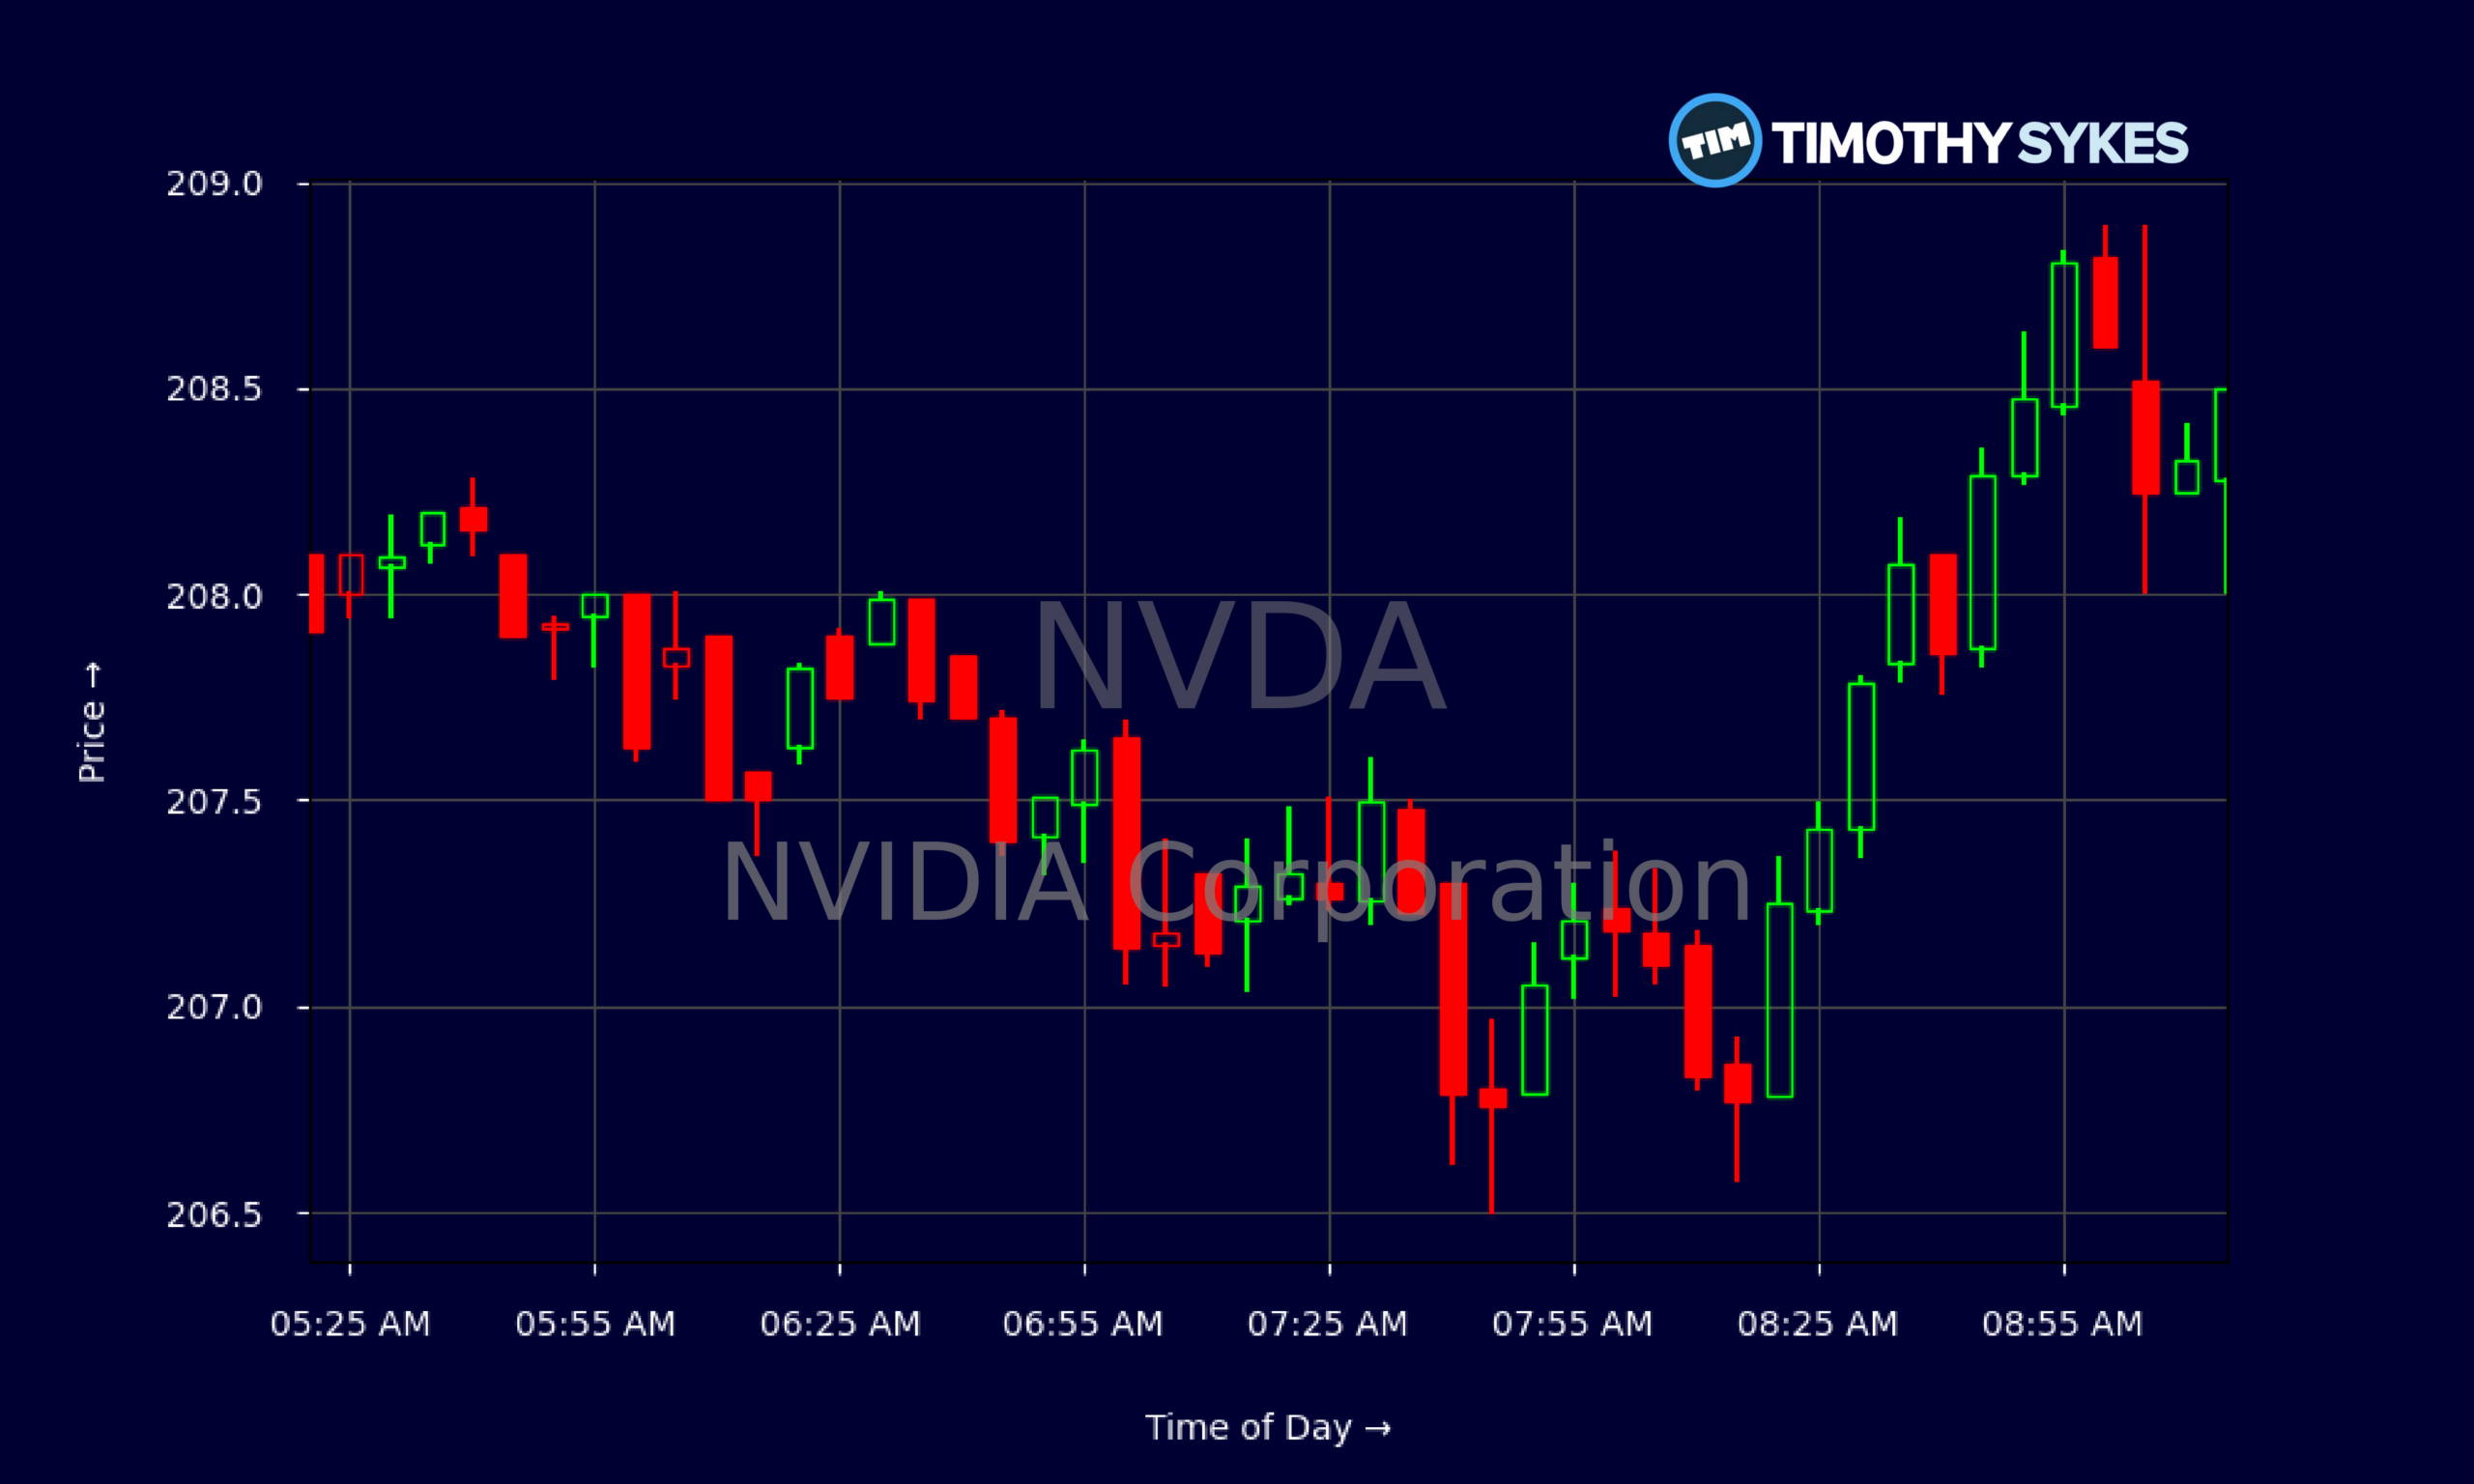
The 5‑minute chart reinforces that picture. NVDA is trading in a tight premarket range around $207–$208, with small, orderly candles and no panic flush. For short-term trading, that usually sets up one of two classic Sykes-style plays: a red-to-green push if buying accelerates off the open, or a fade if the premarket strength gets stuffed. Either way, NVDA remains a prime battlefield for momentum, with the Trump sale and meme rebound framing the narrative rather than rewriting the fundamentals.
Conclusion
For active traders, NVDA right now is a lesson in separating noise from signal. The Trump sale headline looks dramatic, but on the scale of a company with over $320B in assets and roughly $229B in equity value, it is a rounding error. What matters more is that NVDA continues to throw off tens of billions in free cash flow while trading at a valuation the market has already tested over multiple cycles.
Price action tells the rest of the story. NVDA has pulled back from recent highs, but the slide has been controlled, and the latest premarket bounce alongside other Wallstreetbets darlings shows there is still plenty of dip-buying appetite. Strong margins, heavy cash, and low leverage give NVDA room to digest that volatility while traders look for clean risk-reward setups.
This is where discipline separates pros from the crowd. NVDA can be a fantastic trading vehicle, but only for those who respect the volatility and trade the chart, not the headlines. As millionaire penny stock trader and teacher Tim Sykes, says, “Preparation plus patience leads to big profits.” As Tim Sykes likes to remind his students, “The market doesn’t care about your opinion, only your discipline. Cut losses quickly, protect your capital, and you’ll be around for the next pattern.” NVDA will keep offering patterns. The real question is whether traders will bring that discipline to the table.
This article is for educational and research purposes only and is not investment advice.
This is stock news, not investment advice. Timothy Sykes News delivers real-time stock market news focused on key catalysts driving short-term price movements. Our content is tailored for active traders and investors seeking to capitalize on rapid price fluctuations, particularly in volatile sectors like penny stocks. Readers come to us for detailed coverage on earnings reports, mergers, FDA approvals, new contracts, and unusual trading volumes that can trigger significant short-term price action. Some users utilize our news to explain sudden stock movements, while others rely on it for diligent research into potential investment opportunities.
Dive deeper into the world of trading with Timothy Sykes, renowned for his expertise in penny stocks. Explore his top picks and discover the strategies that have propelled him to success with these articles:
- Penny Stocks Trading Guide
- Best Penny Stocks Under $1 to Buy Today
- Top 8 Penny Stocks to Watch on Robinhood
Once you’ve got some stocks on watch, elevate your trading game with StocksToTrade the ultimate platform for traders. With specialized tools for swing and day trading, StocksToTrade will guide you through the market’s twists and turns.
Dig into StocksToTrade’s watchlists here:





Leave a reply