

Netcapital Inc. faces intensified downside risk as regulatory scrutiny and financing setbacks deepen bearish sentiment, with stocks trading down by -40.22 percent.
What Traders Need To Know
- The SEC has charged Netcapital Inc. (NCPL) with securities fraud for allegedly overstating about $14M in revenue through related-party consulting agreements tied to John Fanning, inflating reported revenue roughly 345%.
- Multiple securities class actions and law-firm investigations now allege sham, backdated, and in some cases forged consulting agreements, undisclosed related-party deals, and false Sarbanes-Oxley certifications from 2021/12/15 to 2026/09/03.
- Following the SEC enforcement action, Netcapital’s auditor resigned and an audit-committee board member also stepped down, with each disclosure sparking sharp additional declines in NCPL stock.
- News of the SEC charges alone drove about a 12.8% one-day share-price drop, with further governance and legal shocks compounding selling pressure and keeping volatility extremely elevated for traders.
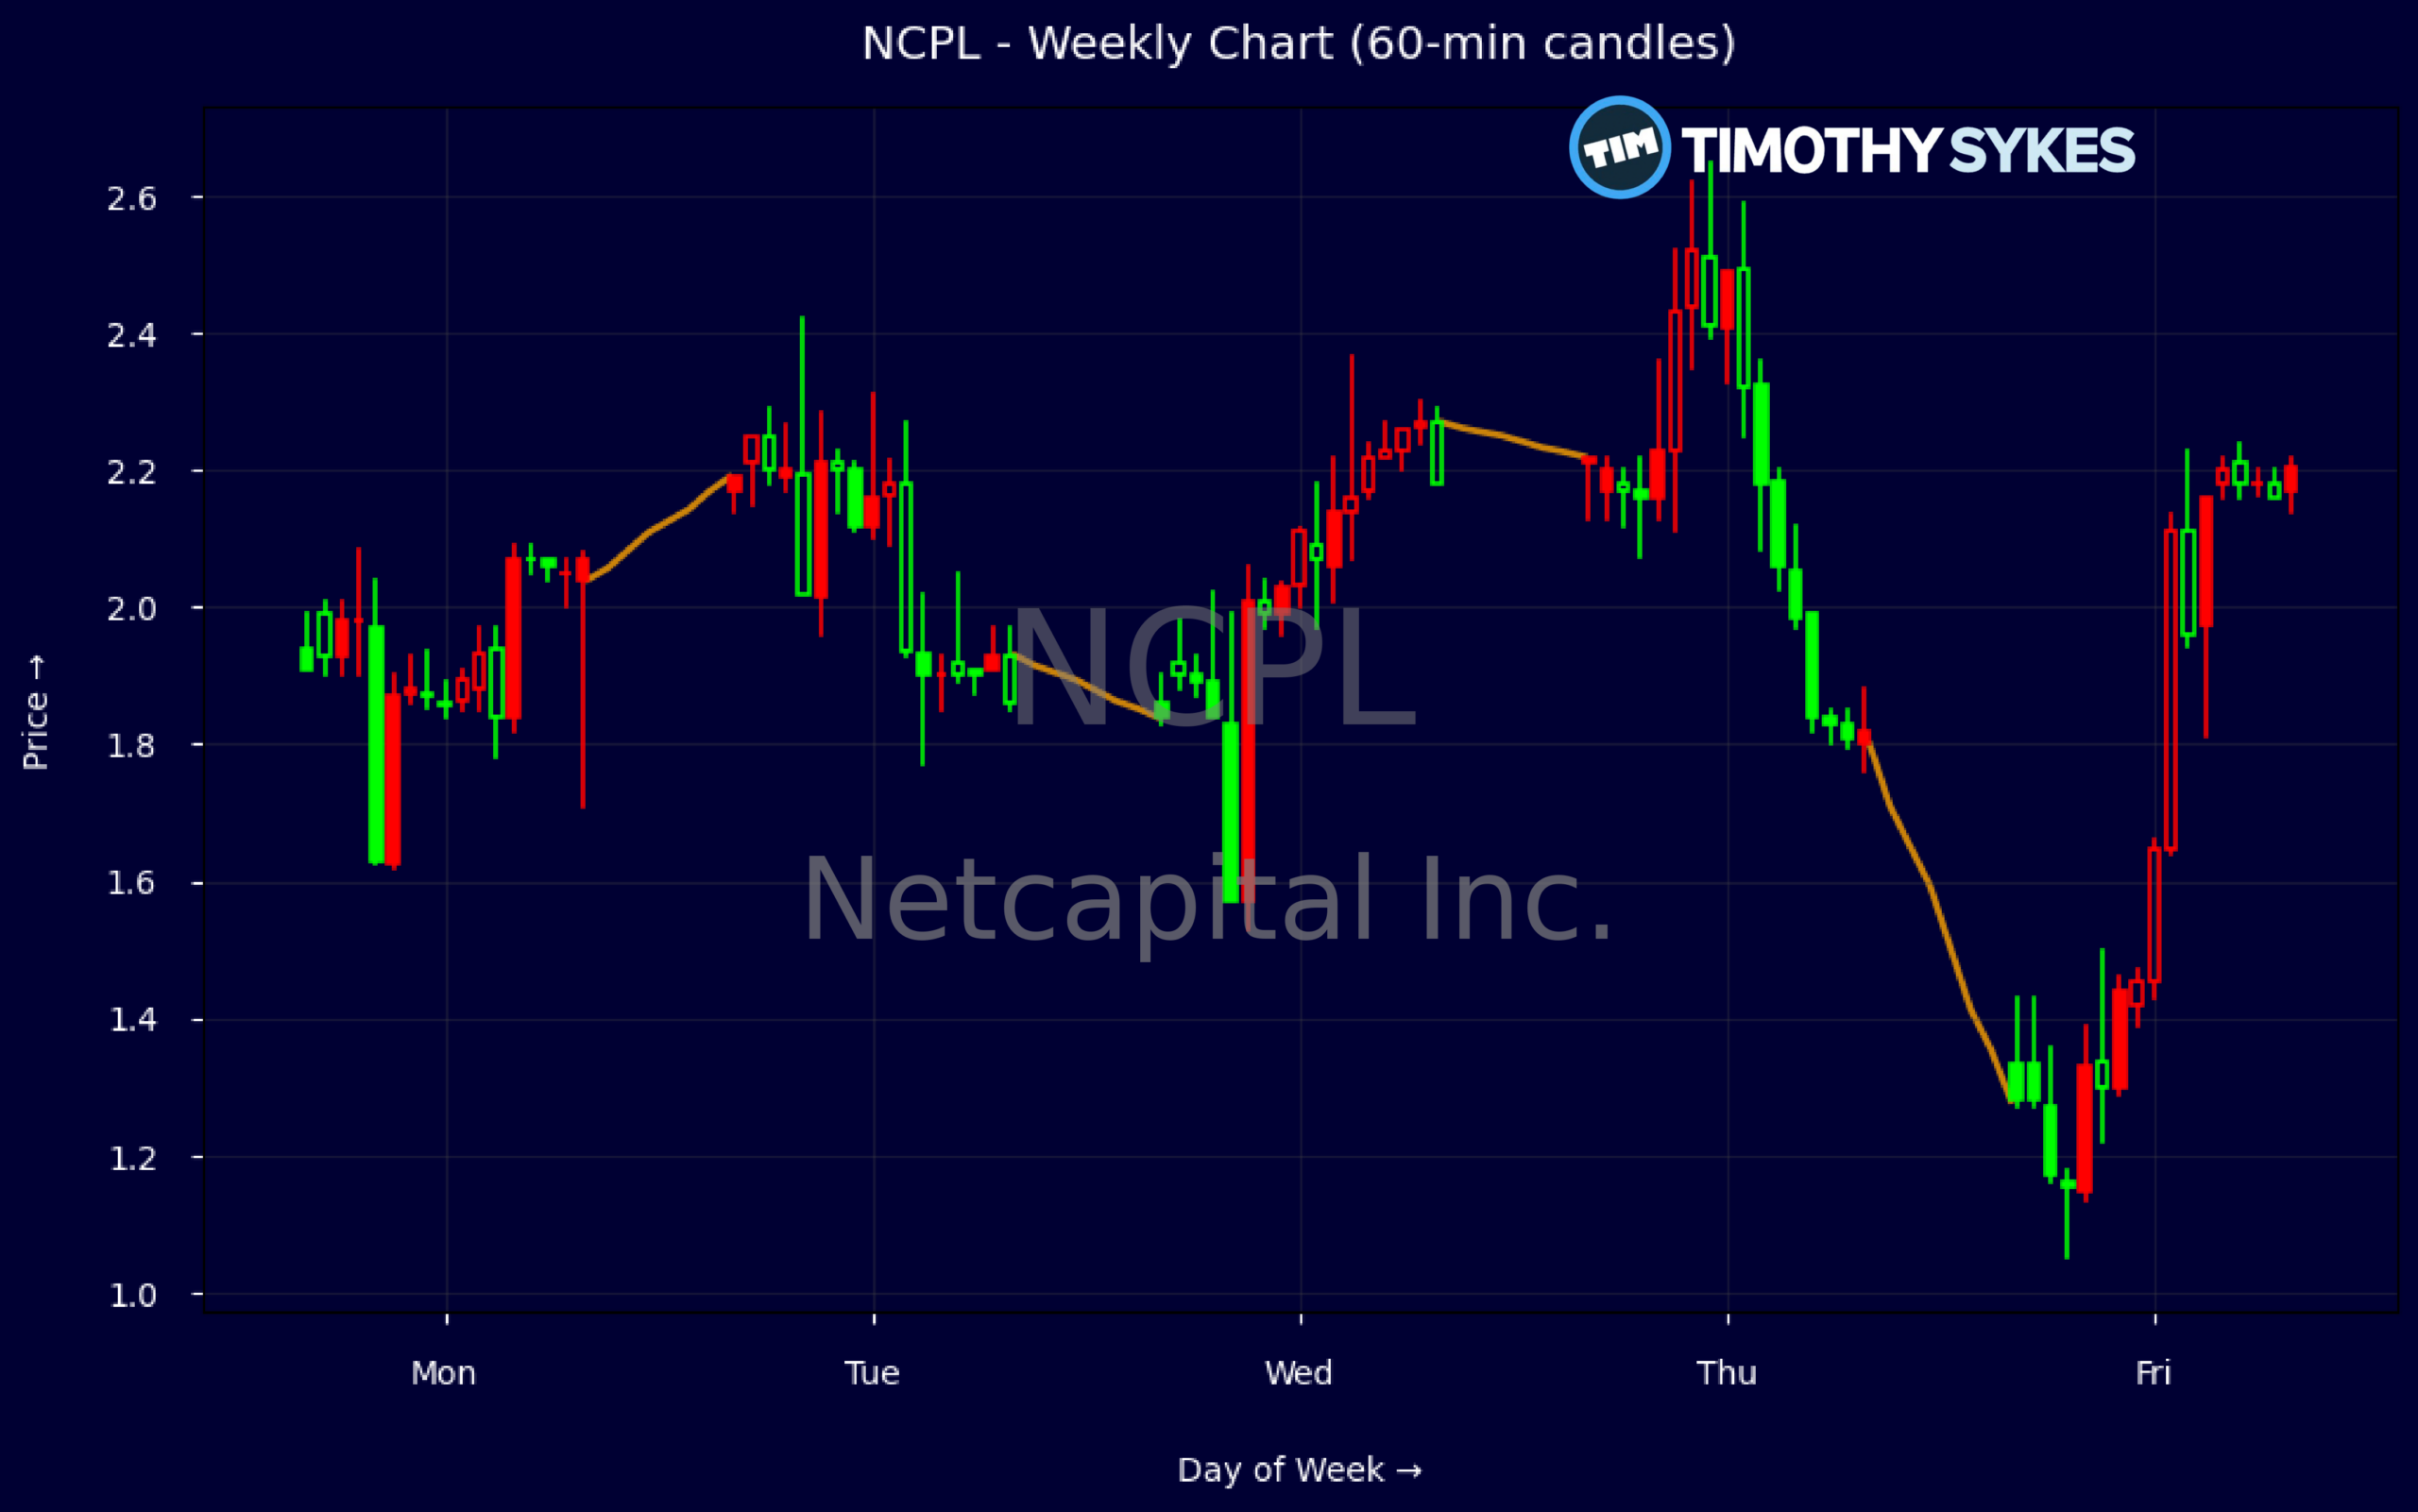
Weekly Update Oct 19 – Oct 23, 2026: On Saturday, October 24, 2026 Netcapital Inc. stock [NASDAQ: NCPL] is trending down by -40.22%! Discover the key drivers behind this movement as well as our expert analysis in the detailed breakdown below.
Finance industry expert:
Analyst sentiment – negative
Netcapital (NCPL) is fundamentally distressed. Reported revenue has collapsed (three‑year CAGR about –53%), and Q3’26 revenue of ~$94k cannot support an opex run‑rate above $2.3m. Margins are catastrophically negative (EBIT margin below –3,700%), ROE near –100%, and free cash flow at –$0.97m for the quarter with only $0.7m cash and a sub‑1 current ratio (0.3), implying acute liquidity risk. Equity is dominated by intangibles and accumulated losses, leaving minimal tangible support.
Technically, NCPL is a high‑volatility microcap with whip-saw weekly action: $1.91→$2.19→$1.84→$2.22→$1.33 closes, reflecting news‑driven spikes and rapid reversals. The dominant trend is down, with lower lows and a sharp break from $2.20 resistance. Intraday 5‑minute candles show heavy volume clustering near $1.25–$1.40, where liquidity concentrates. For trading, $1.30 is the key actionable level: below it, short bias is justified; only sustained closes back above $2.20 would signal any durable squeeze.
Catalysts are overwhelmingly negative: SEC fraud charges, multiple securities class actions, alleged 345% revenue overstatement, undisclosed related‑party transactions, and auditor plus audit‑committee resignations. While Nasdaq bid‑price compliance and a new auditor remove an immediate delisting trigger, NCPL still lags on filings and faces severe governance and going‑concern risk, far worse than finance‑sector and capital‑markets peers. My verdict is outright negative: avoid or short with a $0.50 downside target, resistance at $2.20 and near‑term support around $1.00.
More Breaking News
Quick Financial Overview
Netcapital Inc. (NCPL) is trading through a storm where news flow, not fundamentals, is running the tape. Weekly data show the stock whipping between roughly the low $1s and low $2s, with a bounce from about $1.33 to $2.17 before fading again to $1.86 and then back above $2. That pattern, combined with intraday action swinging from above $2.20 down toward $1.22 and closing near $1.33, signals heavy liquidation and short-term scalping on each headline.
On paper, recent financials look fragile even before any restatement risk. Quarterly revenue is small (under $0.1M in the latest report) and the income statement shows a net loss of about $1.81M, with EBITDA around -$1.73M. Margins are deeply negative, with profit margin metrics near -3,800%, while the cash flow statement shows operating cash outflow near $0.87M and free cash flow near -$0.97M, leaving end cash around $0.72M.
Key ratios paint the same stressed picture. Netcapital Inc. carries a high price-to-sales around 12.1 on modest revenue, with book value per share near 2.75 but a low price-to-book near 0.41, reflecting the market’s discount on stated equity. Liquidity is tight: the current ratio sits near 0.3 and quick ratio around 0.2, while working capital is negative by roughly $2.9M, suggesting limited room to absorb shocks if legal and regulatory costs escalate.
Conclusion
This is stock news, not investment advice. Timothy Sykes News delivers real-time stock market news focused on key catalysts driving short-term price movements. Our content is tailored for active traders and investors seeking to capitalize on rapid price fluctuations, particularly in volatile sectors like penny stocks. Readers come to us for detailed coverage on earnings reports, mergers, FDA approvals, new contracts, and unusual trading volumes that can trigger significant short-term price action. Some users utilize our news to explain sudden stock movements, while others rely on it for diligent research into potential investment opportunities.
Dive deeper into the world of trading with Timothy Sykes, renowned for his expertise in penny stocks. Explore his top picks and discover the strategies that have propelled him to success with these articles:
- Penny Stocks Trading Guide
- Best Penny Stocks Under $1 to Buy Today
- Top 8 Penny Stocks to Watch on Robinhood
Once you’ve got some stocks on watch, elevate your trading game with StocksToTrade the ultimate platform for traders. With specialized tools for swing and day trading, StocksToTrade will guide you through the market’s twists and turns.
Dig into StocksToTrade’s watchlists here:





Leave a reply