

AT&T Inc. stocks have been trading down by -7.83 percent following investor concerns over heightened debt levels and dividend sustainability.
What Traders Need To Know
- Shares of AT&T, Verizon, and T-Mobile dropped 10–13% after SpaceX agreed to acquire a nationwide low-band spectrum portfolio, stoking fears of Starlink Mobile disrupting rural and weak-signal markets.
- Scotiabank cut its AT&T Inc. price target, warning SpaceX’s U.S. spectrum deal makes a hybrid satellite–terrestrial model a credible long-term threat that could pressure wireless sector valuations.
- Bernstein downgraded AT&T Inc. from Outperform to Market Perform and trimmed its price target to $24, citing mounting competition from Starlink, softer pricing, and seasonal Q4 headwinds.
- Management now expects Q4 EBITDA to be hit by unfavorable vendor dispute settlements, pointing to higher-than-planned costs or weaker recoveries.
- AT&T Inc. posted stronger Q3 adjusted earnings and revenue and raised full-year earnings guidance, yet the stock still dropped about 5–6.5% as postpaid phone growth lagged expectations.
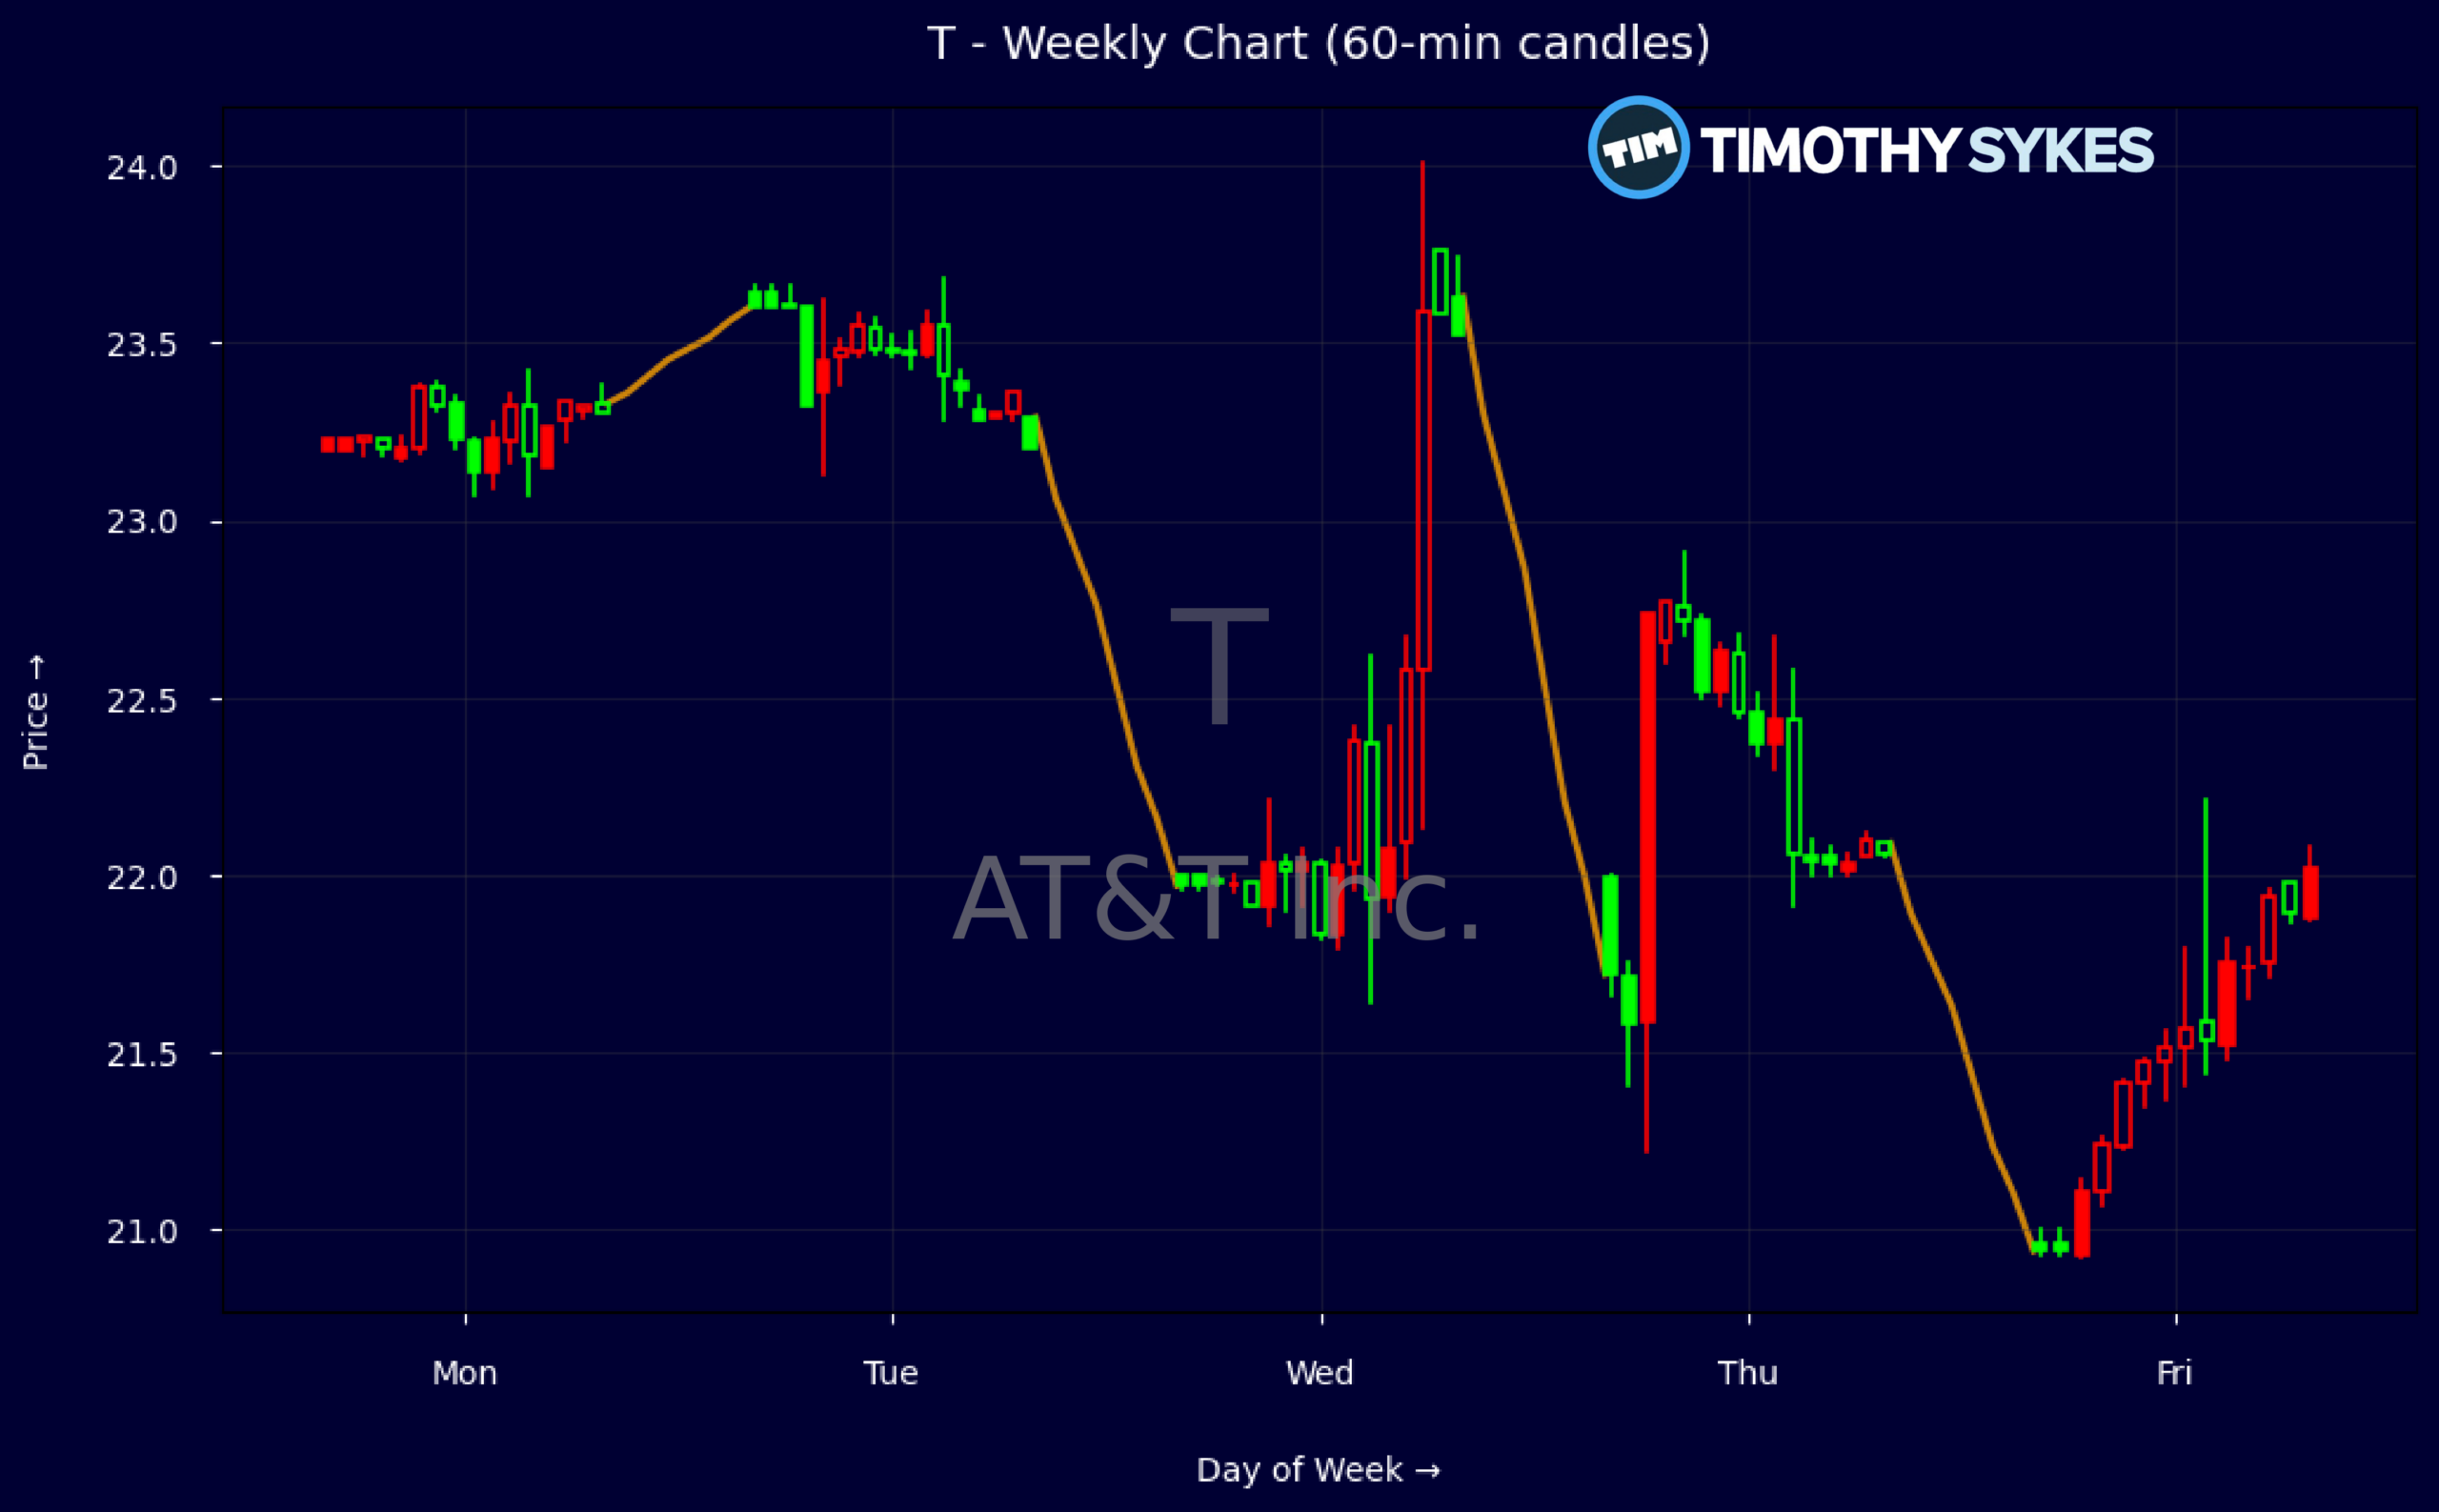
Weekly Update Oct 19 – Oct 23, 2026: On Friday, October 23, 2026 AT&T Inc. stock [NYSE: T] is trending down by -7.83%! Discover the key drivers behind this movement as well as our expert analysis in the detailed breakdown below.
Media & Telecommunications industry expert:
Analyst sentiment – negative
AT&T remains a scale incumbent with $126B in revenue, strong 42% EBITDA and 26% EBIT margins, and solid ROE near 20%, but topline is essentially flat (3‑yr revenue CAGR ~1.6%, 5‑yr negative) and asset turnover is low at 0.3x, confirming a mature, capital-heavy profile. Leverage is high (total debt/equity 1.47x, interest coverage 7.5x) but manageable given 5.8x price-to-free-cash and robust quarterly FCF of ~$5.5B. The ~4.9% dividend yield looks sustainable near term.
Technically, the weekly pattern shows a clear breakdown: the stock rolled over from the mid‑$23s and has accelerated lower into the high‑$20s, with successive lower highs and lower closes confirming a new downtrend. Five‑minute candles show heavy sell volume on breaks below $22 and again below $21, indicating institutional supply. Dominant trend is bearish; the actionable level is $22.00—now strong resistance where failed bounces should be sold with tight stops above $22.50.
Near term, sentiment is negative as SpaceX/Starlink’s 800 MHz spectrum deal reframes competitive risk in U.S. wireless and has triggered sector-wide derating, while vendor dispute settlements will pressure Q4 EBITDA. AT&T’s margins and cash generation still compare favorably to telecom peers, but the market is assigning a structural discount versus both Telecom and broader Media & Telecom benchmarks. My verdict: Neutral-to-negative bias, with resistance at $22 and key support near $20; upside capped unless satellite risks recede.
More Breaking News
Quick Financial Overview
AT&T Inc. is trading under clear pressure despite solid headline fundamentals. Weekly data show the stock slipping from around $23.60 to roughly $20.97 over recent weeks, a decisive breakdown that signals sellers in control. That slide accelerated after the SpaceX spectrum move and Q3 earnings, as traders reset expectations for both growth and competition. From a price action standpoint, any bounce back toward the low-$22s now looks like overhead supply.
Intraday, the 5-minute tape reveals a classic fade day. Early trade held above $21.50 with pre-market prints near $21.90–$22.00, but steady selling drove shares toward $21.00 and then under, with a weak close around $20.97. That pattern tells traders big money is using strength to exit, not build, positions. Until AT&T Inc. can reclaim and hold above the $21.50–$22.00 band, short-term momentum remains clearly bearish.
Fundamentally, the company still throws off meaningful cash. Quarterly revenue sits near $32.32B with gross margin around 59.7% and EBIT margin at 26.2%, supporting a P/E near 7.4 and price-to-cash-flow around 3.5. Free cash flow of about $5.46B in the latest quarter more than covers roughly $1.95B in cash dividends, backing a yield near 4.9%. But leverage is heavy: total debt-to-equity near 1.47 and a leverage ratio just under 4 remind traders that a disrupted margin story can quickly matter for equity valuation.
Conclusion
AT&T Inc. now trades in a market that is openly questioning its long-term wireless moat. SpaceX’s move to buy nationwide low-band spectrum for Starlink Mobile has forced traders to price in a credible satellite-based rival, especially in rural and weak-signal regions. That shock, combined with a post-earnings drop after Q3, has pushed T from the mid-$23s to just under $21 on the weekly chart. The message from the tape is simple: confidence has been hit, and it shows.
At the same time, the financials show why some dip buyers will keep circling AT&T Inc. A single-digit earnings multiple, strong EBITDA margins, and robust free cash flow that covers the dividend all offer support on paper. But the negative Q4 EBITDA outlook tied to vendor disputes, and back-to-back analyst moves from Scotiabank and Bernstein, highlight a rising risk that earnings estimates and multiples both compress. For traders, that means respecting the downtrend first and letting price confirm any bullish ideas later. As millionaire penny stock trader and teacher Tim Sykes says, “Small gains add up over time; focus on building wealth gradually, not chasing jackpots.”. As I tell my students, “You trade the market in front of you, not the story you wish were true — and right now, the market is treating T as a name that must re-earn the benefit of the doubt.”
This is stock news, not investment advice. Timothy Sykes News delivers real-time stock market news focused on key catalysts driving short-term price movements. Our content is tailored for active traders and investors seeking to capitalize on rapid price fluctuations, particularly in volatile sectors like penny stocks. Readers come to us for detailed coverage on earnings reports, mergers, FDA approvals, new contracts, and unusual trading volumes that can trigger significant short-term price action. Some users utilize our news to explain sudden stock movements, while others rely on it for diligent research into potential investment opportunities.
Dive deeper into the world of trading with Timothy Sykes, renowned for his expertise in penny stocks. Explore his top picks and discover the strategies that have propelled him to success with these articles:
- Penny Stocks Trading Guide
- Best Penny Stocks Under $1 to Buy Today
- Top 8 Penny Stocks to Watch on Robinhood
Once you’ve got some stocks on watch, elevate your trading game with StocksToTrade the ultimate platform for traders. With specialized tools for swing and day trading, StocksToTrade will guide you through the market’s twists and turns.
Dig into StocksToTrade’s watchlists here:





Leave a reply