

Netcapital Inc. stocks have been trading up by 46.43 percent, driven by heightened investor optimism from the most impactful headline.
Key Takeaways
- NCPL has dropped from the $2.60s to nearly $1.00 in weeks, showing extreme volatility that short-term traders track closely.
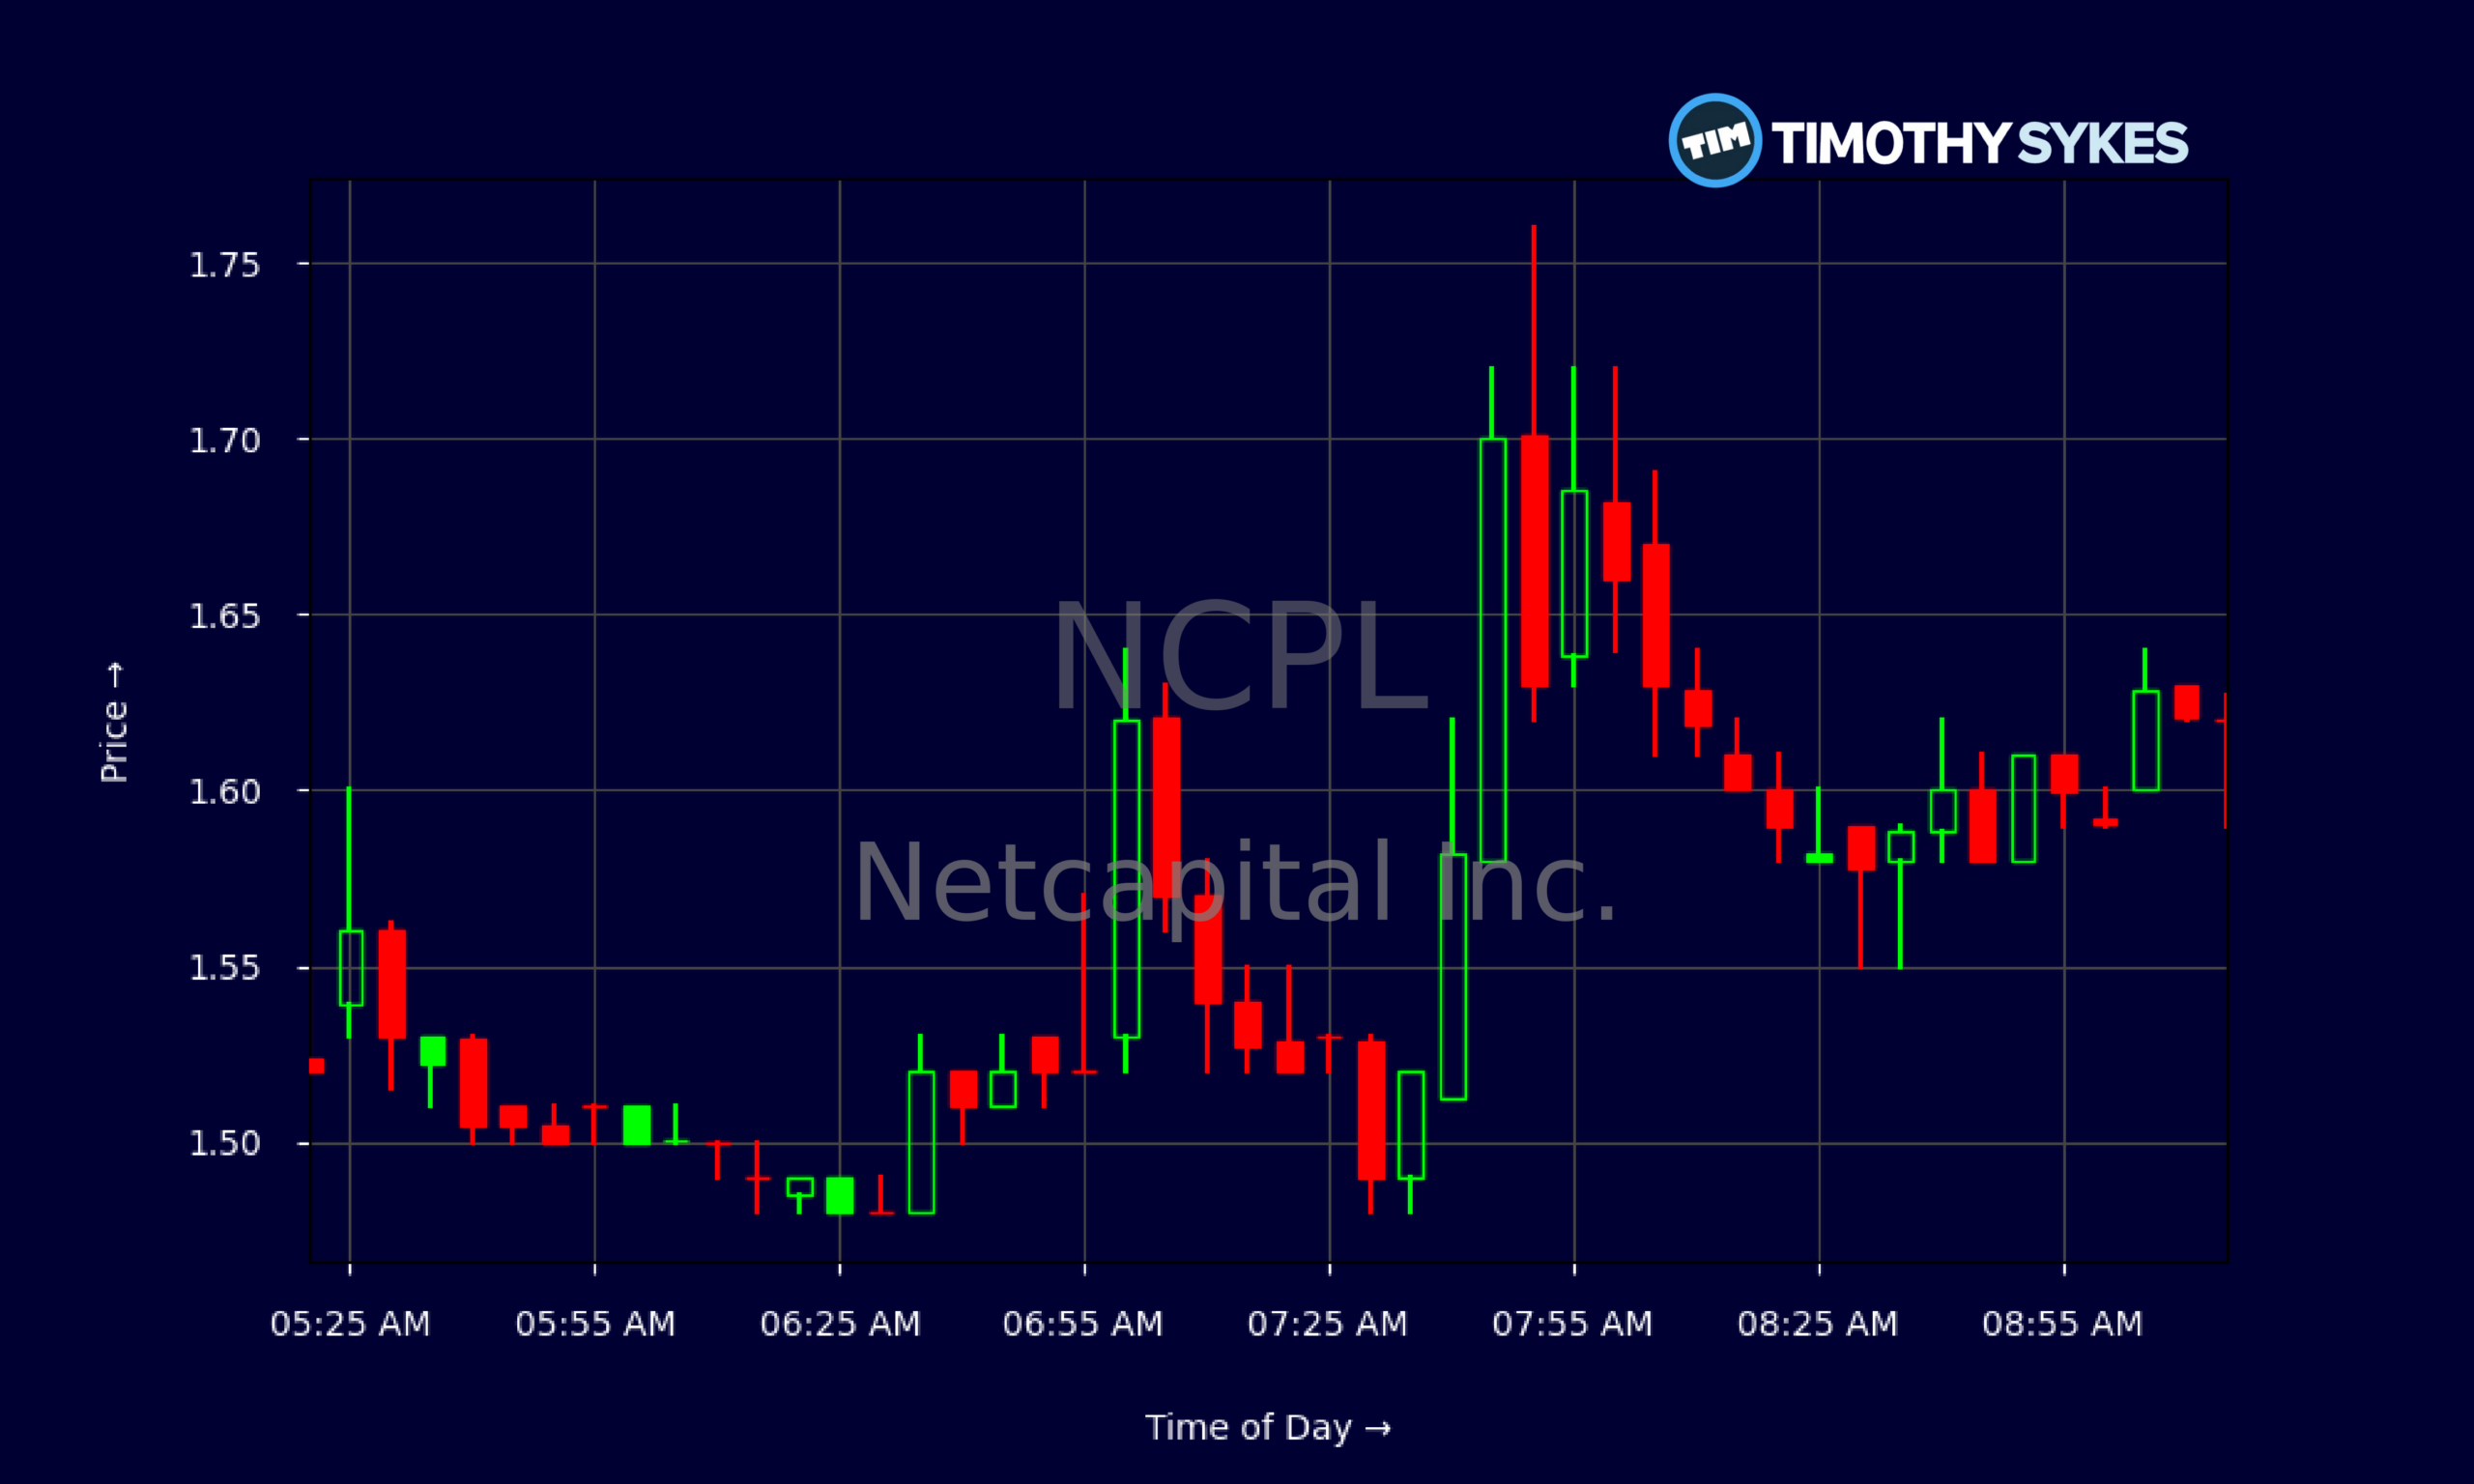
- Recent NCPL intraday action around $1.50–$1.70 shows tight consolidation after heavy selling, hinting at a possible next big move.
- Netcapital Inc.’s latest report shows tiny revenue and steep losses, forcing traders to think about future dilution and financing risk.
- NCPL carries a low price-to-book ratio but negative returns across the board, a classic high-risk, high-volatility small-cap profile.
Live Update At 09:18:59 EDT: On Thursday, October 29, 2026 Netcapital Inc. stock [NASDAQ: NCPL] is trending up by 46.43%! Discover the key drivers behind this movement as well as our expert analysis in the detailed breakdown below.
Quick Financial Overview
NCPL is trading like a classic beaten-down small-cap. The daily chart shows Netcapital Inc. falling from the mid-$2s to near $1.10 in roughly two weeks. That’s a deep drawdown and a clear sign that prior momentum faded fast. For traders, that kind of collapse often sets up either dead-cat bounces or slow grinds lower, depending on volume and sentiment.
Financially, NCPL is tiny. Netcapital Inc. reported about $94,000 in quarterly revenue, yet logged a net loss of roughly $1.8M. That works out to a very high loss relative to sales. The income statement shows heavy operating expenses, especially salaries and G&A, while revenue remains minimal. Profit margins are massively negative, even though gross margin looks near 100% due to the low cost of revenue.
More Breaking News
On the balance sheet, NCPL holds about $715,000 in cash against nearly $4.0M in current liabilities and negative working capital of around $-2.9M. That points to funding pressure. At the same time, Netcapital Inc. shows book value near $2.75 per share and a price-to-book near 0.4, which tells traders the market is heavily discounting those assets because of persistent losses and cash burn.
Why Traders Are Watching NCPL’s Volatile Price Action
NCPL has become a pure price-action story. Look at the recent daily candles: Netcapital Inc. spiked to $2.66 on 2026/10/12, then closed down at $1.54 the same day. That’s a huge intraday range and a nasty fade. Since then, NCPL has put in a series of lower highs, grinding from the low $2s down into the $1.10–$1.30 area by 2026/10/28. This is the DNA of a momentum unwind.
Now focus on the intraday 5-minute chart. NCPL is chopping between roughly $1.45 and $1.70 for hours, with a lot of prints clustering around $1.50–$1.60. That type of tight band after a big downtrend often signals consolidation. Traders know consolidation doesn’t last. Either shorts lock in gains and trigger a sharp bounce, or selling resumes and Netcapital Inc. breaks to new lows.
Layer in the fundamentals and the picture sharpens. NCPL’s revenue is shrinking on a multi-year basis, while losses remain heavy. Cash flow from operations is negative, and free cash flow sits around -$0.97M for the recent period. That tells traders Netcapital Inc. still needs capital to keep going. In small caps, that usually means potential equity raises and dilution.
So why watch it? Because NCPL combines three things traders love to study: low price, heavy volatility, and a clear fundamental overhang that fuels both bearish trends and violent short squeezes. Netcapital Inc. can become a textbook chart for traders learning to manage risk in thin, news-light names that still move big.
Conclusion
NCPL is a reminder of how brutal the market can be to small, unprofitable platforms. Netcapital Inc. has strong reported gross margins but almost no scale. Revenue remains tiny, operating costs are high, and every major profitability and return metric is deep in the red. Add weak liquidity and negative working capital, and traders need to assume more capital raises are on the table, which often pressures the share price.
At the same time, NCPL still attracts attention because of its chart. Big swings from the $2.60s down to near $1.00, plus tight intraday consolidation, create a playground for pattern watchers. Netcapital Inc. gives traders the chance to map support, resistance, and panic points in real time. Those who track NCPL can practice reading failed spikes, breakdowns, and potential short-covering bounces.
The key is discipline. NCPL is not a steady compounder; it is a speculative, volatile trading vehicle. That demands strict rules. As Tim Sykes always says, “Cut losses quickly, because big losses usually start out as small ones.” As millionaire penny stock trader and teacher Tim Sykes says, “The goal is not to win every trade but to protect your capital and keep moving forward.”. For anyone studying NCPL, that one line should frame every trade plan around Netcapital Inc. — focus on the chart, respect the risk, and treat every move as an educational opportunity, not a guarantee of profit.
This is stock news, not investment advice. Timothy Sykes News delivers real-time stock market news focused on key catalysts driving short-term price movements. Our content is tailored for active traders and investors seeking to capitalize on rapid price fluctuations, particularly in volatile sectors like penny stocks. Readers come to us for detailed coverage on earnings reports, mergers, FDA approvals, new contracts, and unusual trading volumes that can trigger significant short-term price action. Some users utilize our news to explain sudden stock movements, while others rely on it for diligent research into potential investment opportunities.
Dive deeper into the world of trading with Timothy Sykes, renowned for his expertise in penny stocks. Explore his top picks and discover the strategies that have propelled him to success with these articles:
- Penny Stocks Trading Guide
- Best Penny Stocks Under $1 to Buy Today
- Top 8 Penny Stocks to Watch on Robinhood
Once you’ve got some stocks on watch, elevate your trading game with StocksToTrade the ultimate platform for traders. With specialized tools for swing and day trading, StocksToTrade will guide you through the market’s twists and turns.
Dig into StocksToTrade’s watchlists here:





Leave a reply