

Leverage Shares 2X Short SPCX Daily faces heightened bearish sentiment as underlying SPAC-related stocks have been trading down by -14.04 percent.
Key Takeaways
- SSPC has swung from around $9.50 to the mid-$8s this month, showing sharp volatility that active traders track for short-term moves.
- Recent SSPC daily candles highlight wide ranges and frequent reversals, signaling a tug-of-war between bullish and bearish momentum.
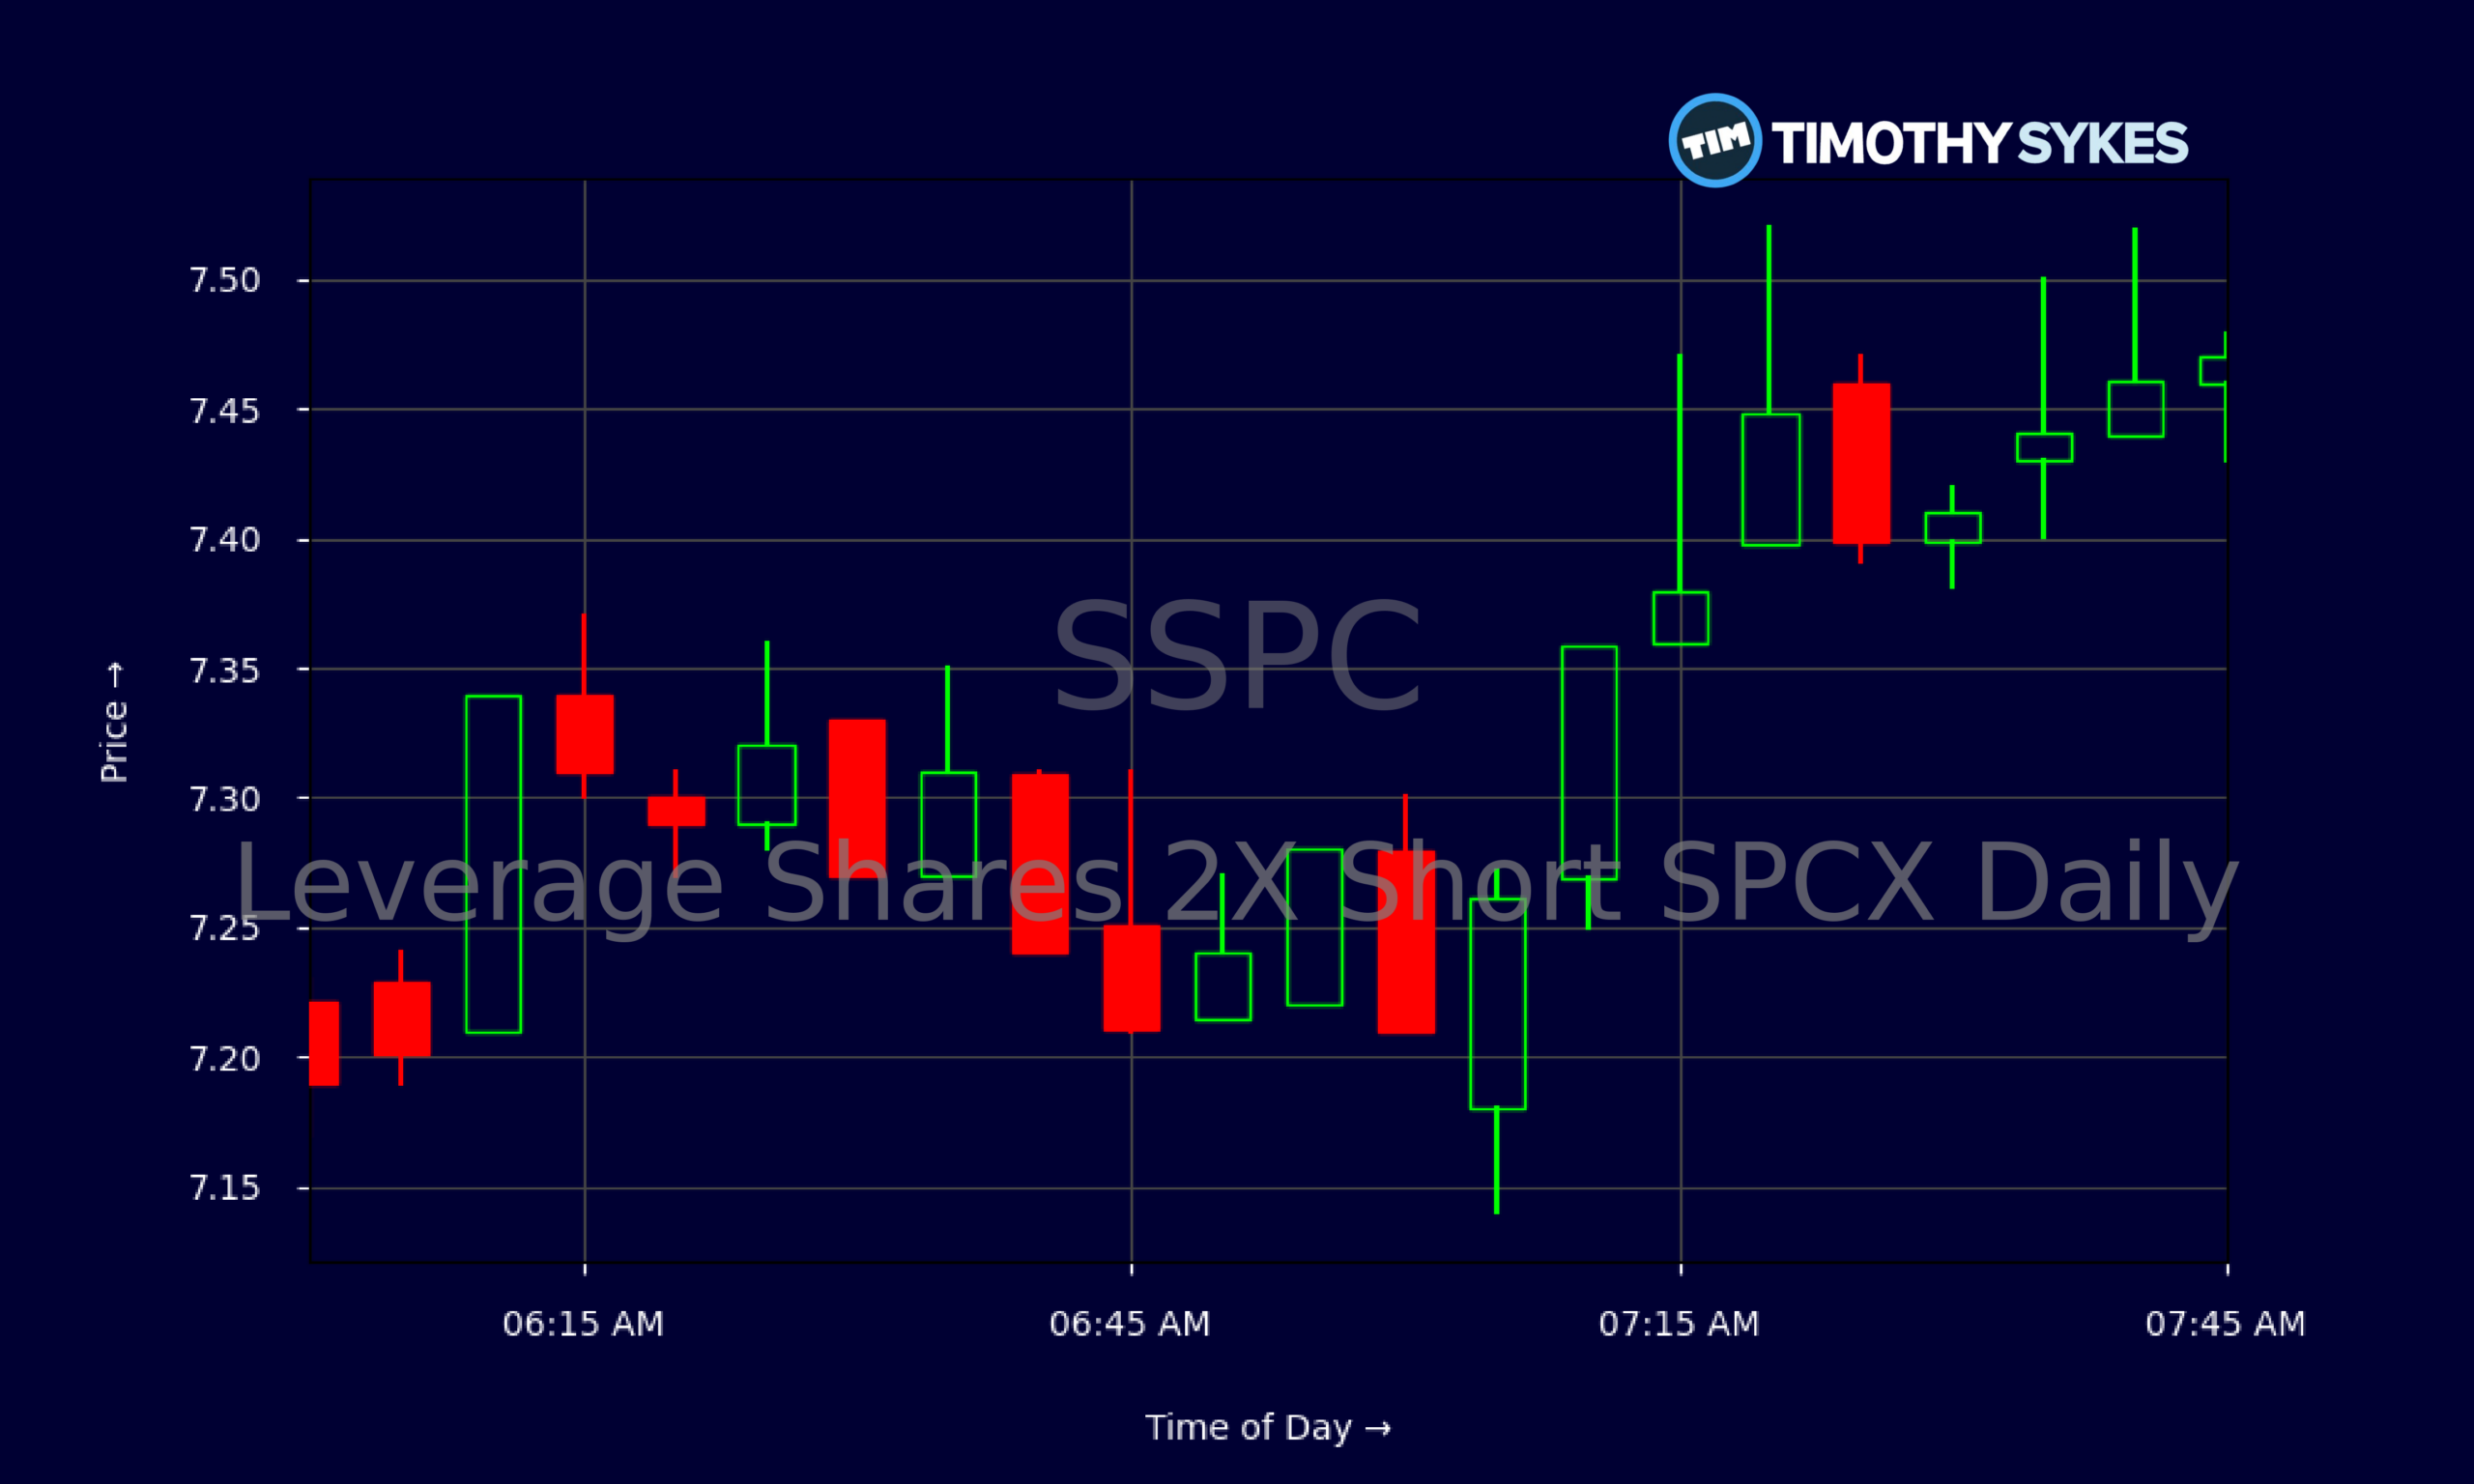
- Intraday SSPC trading shows tight consolidation around the low-$7s, a common setup before bigger trend breaks.
- With no clear fundamental ratios reported, SSPC trading appears driven largely by price action and sentiment around its leveraged, short exposure.
Live Update At 07:50:14 EDT: On Wednesday, October 21, 2026 Leverage Shares 2X Short SPCX Daily stock [BATS Global Markets: SSPC] is trending down by -14.04%! Discover the key drivers behind this movement as well as our expert analysis in the detailed breakdown below.
Quick Financial Overview
SSPC, the Leverage Shares 2X Short SPCX Daily product, is built for traders, not for buy‑and‑hold. It is a leveraged, daily reset vehicle designed to move roughly twice in the opposite direction of its underlying exposure on a daily basis. That alone makes SSPC a high‑octane tool that demands strict risk control.
From late September to late October, SSPC has traded roughly between $6.50 and $9.50. That’s a very wide band in a short window. The daily chart shows SSPC pushing above $9 on 2026/09/28 and again on 2026/10/16, but failing to hold those levels and slipping back into the $8s. This kind of action tells traders that SSPC is a fast mover that routinely overshoots before snapping back.
More Breaking News
Key ratios and classic fundamentals for SSPC are essentially blank, which is normal for a leveraged trading vehicle rather than an operating company. For active traders, price and volume are the real “financials” here. SSPC’s recent pullback from near $9.50 down into the high‑$8s puts it squarely in “watchlist” territory for those who trade volatility and short-term mean reversion.
Why Traders Are Watching SSPC’s Volatility
SSPC has the kind of chart that grabs attention in chat rooms. On 2026/09/28, SSPC pushed from an intraday low near $8.87 to a high of $9.53 before closing slightly lower. That wide range showed aggressive trading interest on both sides. Since then, SSPC has printed a series of big candles, with many days showing moves of $0.60 to $1.00 or more from low to high.
For a sub‑$10 product, those are serious percentage swings. Between 2026/10/06 and 2026/10/14, SSPC slid from a close near $6.56 to about $8.22. Then, between 2026/10/12 and 2026/10/16, SSPC rallied from around $7.19 to an intraday high above $9.25 before closing at $8.90. These rip-and-fade moves show why traders treat SSPC as a pure momentum and sentiment play.
The intraday 5‑minute chart reinforces that story. SSPC has been oscillating tightly around $7.20–$7.50, with repeated small pushes and quick pullbacks. That type of chop often signals accumulation or distribution ahead of a sharper move. Short-term traders study levels like $7.20 support and $7.50 resistance to plan their risk.
Because SSPC is leveraged and short, traders also understand that daily compounding can cut both ways. Strong trends in the underlying can produce outsized moves in SSPC in either direction. That is why many experienced traders in the Sykes community will day trade or very tightly swing a product like SSPC, rather than park capital in it.
Conclusion
For active traders, SSPC is all about discipline. The daily chart shows violent swings from the low‑$6s up toward $9.50 and back into the $8s within weeks. The intraday tape shows tight consolidation bands that often precede breakouts or breakdowns. When you pair that with SSPC’s leveraged, short design, you get a trading vehicle that rewards planning and punishes guessing.
Traders focusing on SSPC are watching a few things: how price behaves around recent support in the low‑$7s, whether the mid‑$8s to $9 zone turns into a ceiling, and how volume reacts on each push. SSPC’s lack of traditional earnings or balance-sheet data shifts the edge toward pure technicals and understanding how leveraged products behave over time.
This is exactly the type of setup the Sykes-style community studies: clear volatility, clear levels, and clear risk. As Tim Sykes likes to remind traders, “I’m not in this game to be right, I’m in it to trade what’s in front of me and cut losses quickly.” As millionaire penny stock trader and teacher Tim Sykes says, “The goal is not to win every trade but to protect your capital and keep moving forward.”. SSPC demands that mindset. Used thoughtfully, with strict risk controls and a rule-based plan, it can be a powerful educational case study in how leverage and momentum really work in live markets.
This is stock news, not investment advice. Timothy Sykes News delivers real-time stock market news focused on key catalysts driving short-term price movements. Our content is tailored for active traders and investors seeking to capitalize on rapid price fluctuations, particularly in volatile sectors like penny stocks. Readers come to us for detailed coverage on earnings reports, mergers, FDA approvals, new contracts, and unusual trading volumes that can trigger significant short-term price action. Some users utilize our news to explain sudden stock movements, while others rely on it for diligent research into potential investment opportunities.
Dive deeper into the world of trading with Timothy Sykes, renowned for his expertise in penny stocks. Explore his top picks and discover the strategies that have propelled him to success with these articles:
- Penny Stocks Trading Guide
- Best Penny Stocks Under $1 to Buy Today
- Top 8 Penny Stocks to Watch on Robinhood
Once you’ve got some stocks on watch, elevate your trading game with StocksToTrade the ultimate platform for traders. With specialized tools for swing and day trading, StocksToTrade will guide you through the market’s twists and turns.
Dig into StocksToTrade’s watchlists here:





Leave a reply