

Opendoor Technologies Inc faces pressure as bearish housing market headlines weigh on investor sentiment; stocks have been trading down by -4.02 percent.
Key Takeaways
- OPEN has slipped from late-September closes near $2.57 to roughly $2.05, putting the stock in a short-term downtrend on the daily chart.
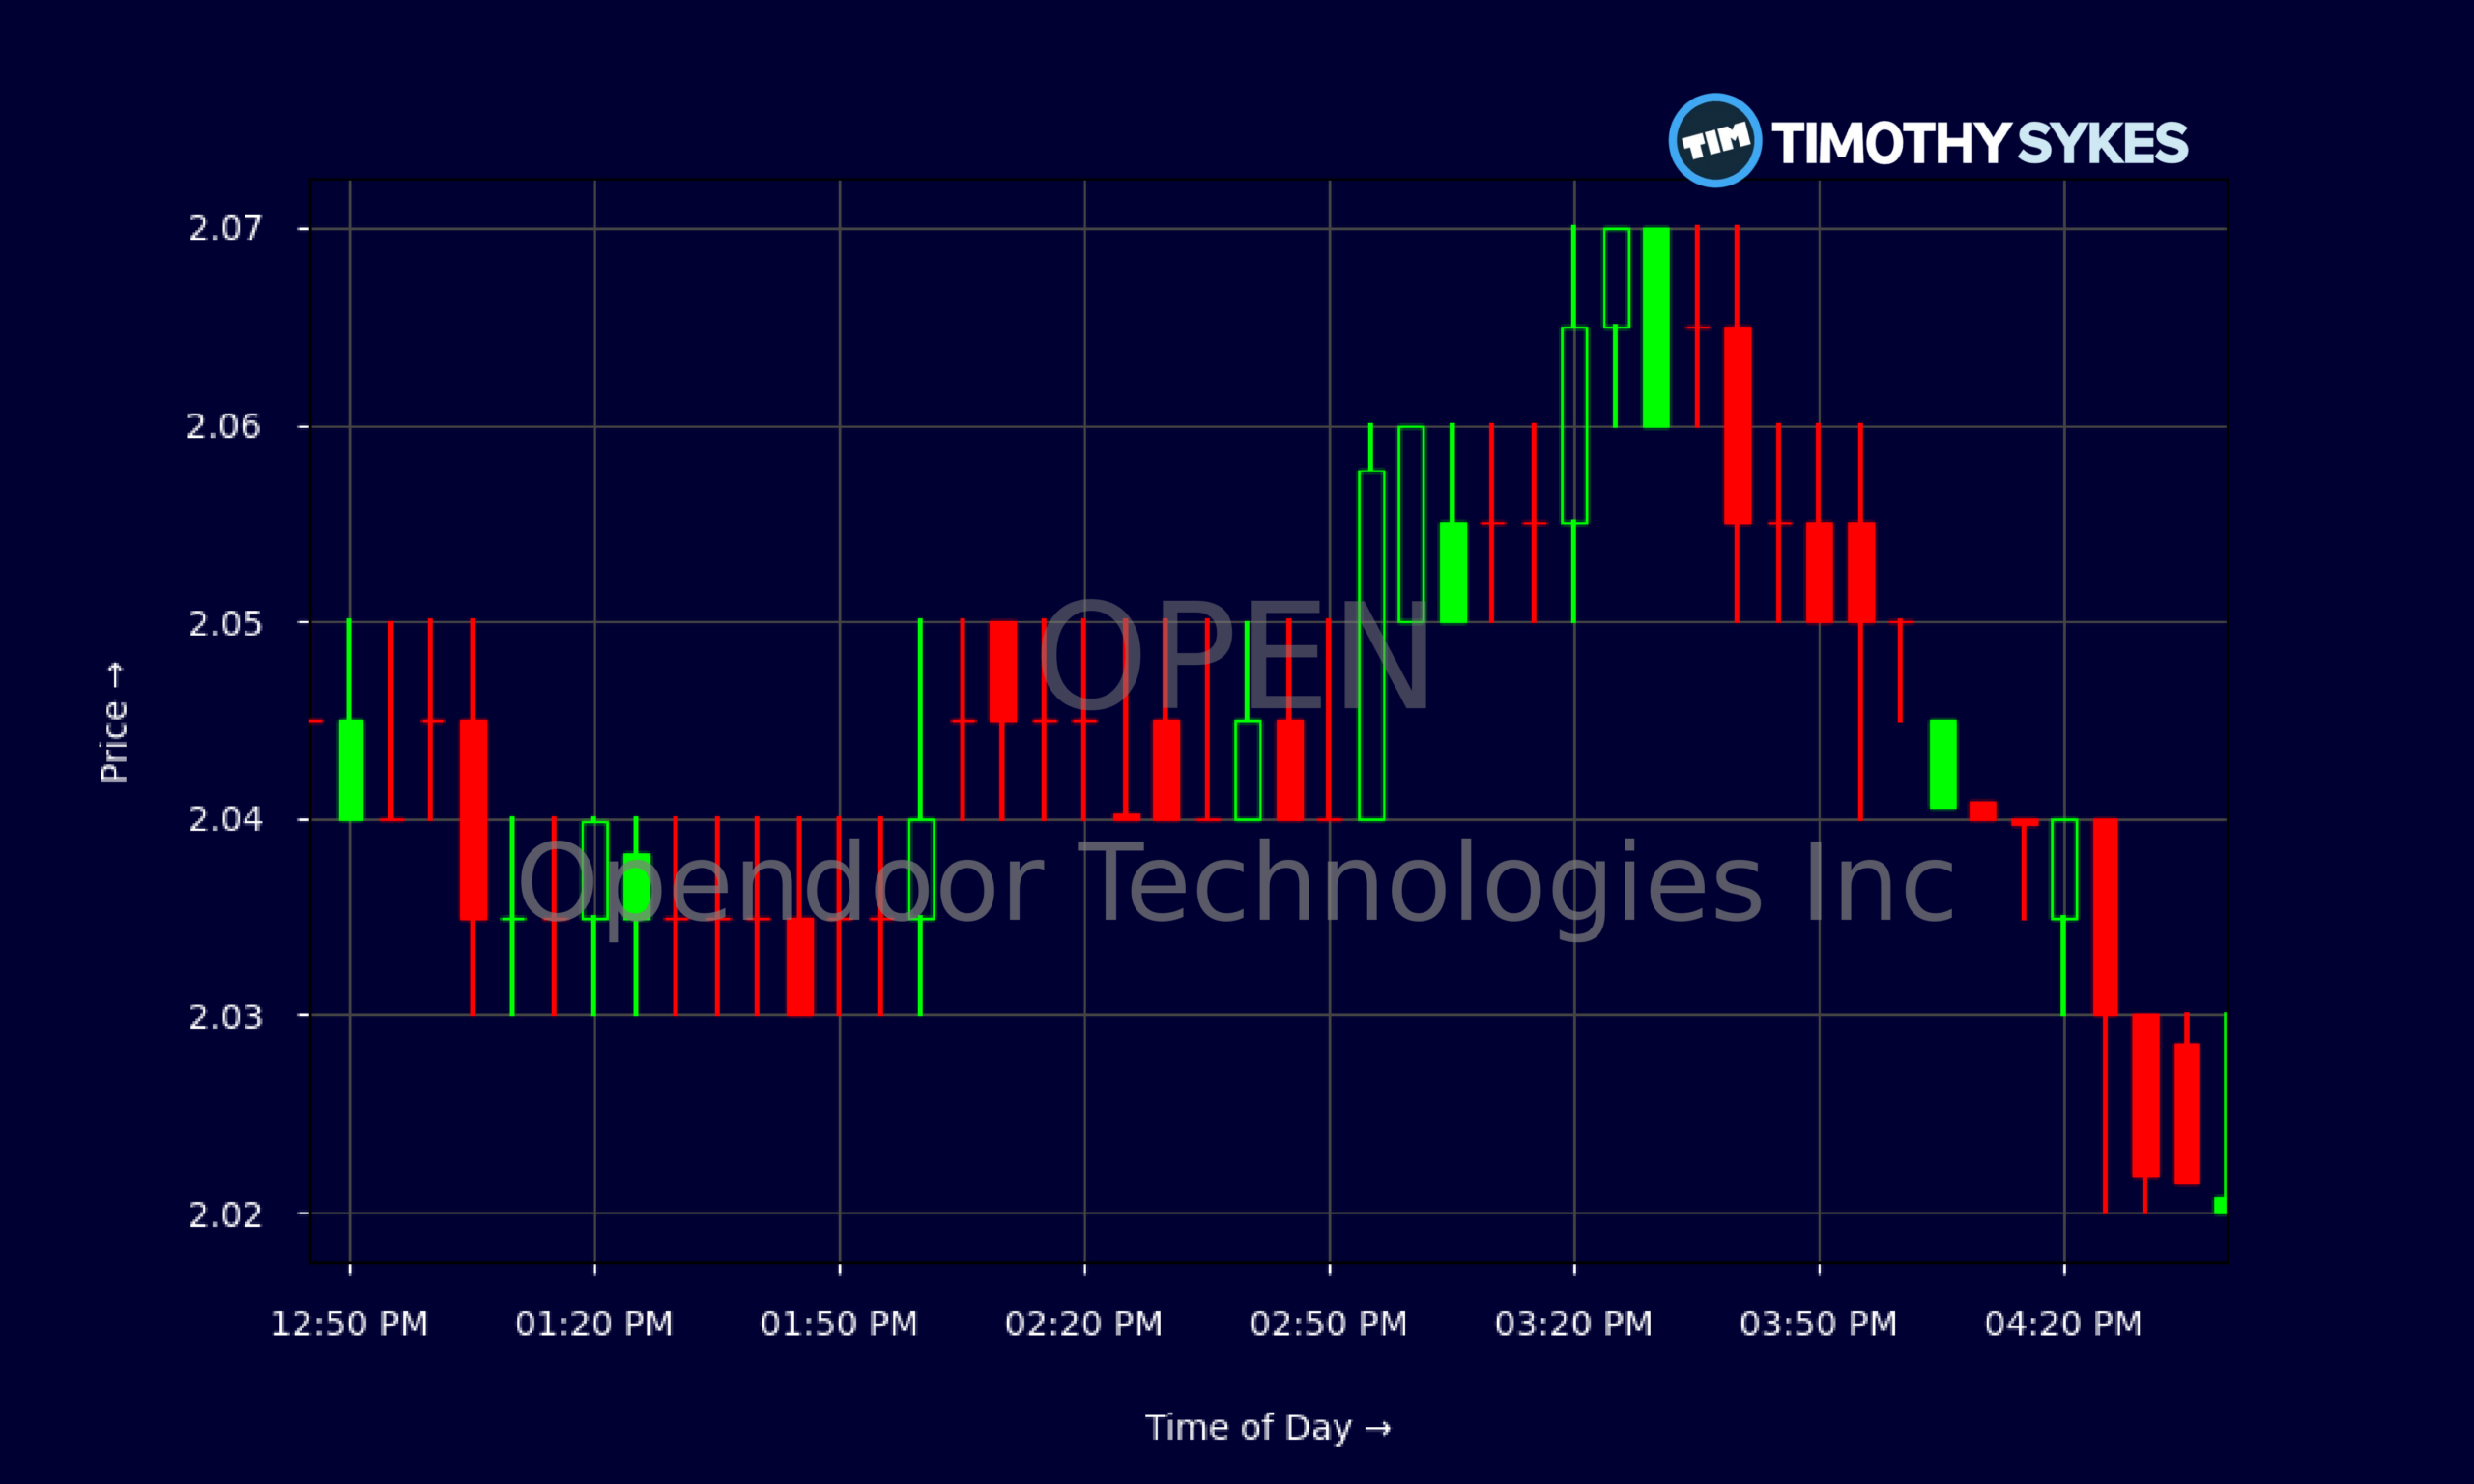
- Intraday action shows tight trading between $2.02 and $2.07, signaling consolidation as traders wait for the next momentum push.
- Opendoor Technologies Inc posted about $4.37B in revenue but is still running heavy losses with negative margins.
- OPEN carries significant debt but also strong liquidity, with nearly $1B in cash and solid working capital, giving traders a cushion-focused risk lens.
Live Update At 16:47:06 EDT: On Monday, October 19, 2026 Opendoor Technologies Inc stock [NASDAQ: OPEN] is trending down by -4.02%! Discover the key drivers behind this movement as well as our expert analysis in the detailed breakdown below.
Quick Financial Overview
Opendoor Technologies Inc is a classic high-growth, high-burn story that traders love to study. OPEN generated about $4.37B in revenue, which is big, but the quality of that revenue matters. The company’s gross margin sits around 8.6%, and profit margins are deep in the red, with overall profit near -47%. That tells traders OPEN is selling a lot of homes but not capturing much profit per deal.
On the balance sheet, OPEN shows total assets near $2.96B and equity around $914M. Long-term debt is just over $1.07B, and total debt to equity is about 2.15, which means leverage is real. At the same time, Opendoor Technologies Inc holds roughly $896M in cash and almost $1.88B in working capital, giving the business runway to keep operating and adjusting its model.
More Breaking News
OPEN trades at about 0.66 times sales and around 2.36 times book value. Those valuation markers tell traders the market is cautiously pricing in future upside but has not written the story off. Negative returns on equity and assets, though, keep this firmly in “speculative” territory for any trading plan.
Why Traders Are Watching OPEN Price Action
The chart is where the real story shows up for traders. In late September 2026, OPEN closed near $2.57 on 2026/09/25 and held around $2.53–$2.43 into 2026/10/01–2026/10/02. Since then, the slope has turned lower. By 2026/10/19, Opendoor Technologies Inc closed at $2.05 after opening at $2.13 and tagging a low of $2.03. That’s a steady grind down from the mid-$2.50s to the low $2s.
For short-term traders, OPEN now sits in a key zone. There is a cluster of recent lows between $2.03 and $2.09 that forms a short-term support band. If Opendoor Technologies Inc cracks convincingly below $2.00, traders will likely treat that as a breakdown and look for lower targets or tighter risk, depending on their strategy.
Zoom in to the intraday 5-minute chart and you see a different picture. OPEN spent most of the day trading in a narrow range, roughly $2.03–$2.07, with very little expansion in either direction. That kind of sideways action after a pullback often signals consolidation — a pause where both long and short traders wait for confirmation.
For pattern-focused traders, OPEN is essentially coiling under prior resistance from the $2.20–$2.30 area and above psychological support near $2.00. A push back through $2.15–$2.20 with volume would show bulls waking up. A flush under $2.00 would hand control to bears. Either way, Opendoor Technologies Inc is setting up as a “level-to-level” trading stock, not a passive hold.
Conclusion
OPEN sits at an important crossroads where fundamentals and price action both demand respect. On one side, Opendoor Technologies Inc is burning cash, with recent free cash flow around -$723M and operating cash flow solidly negative. Margins are weak, and returns on equity and assets are sharply below zero. That backdrop explains why the stock has sagged from the $2.50s to the low $2s and why many traders treat OPEN as a short-term trading vehicle rather than a long-term comfort play.
On the other side, the company still commands multi-billion dollar revenue, nearly $896M in cash, and over $1.88B of working capital. That financial runway lets OPEN keep testing and refining its model, which is enough to keep momentum traders on alert whenever the chart starts to move. Tight intraday ranges near $2.05 show that both bulls and bears are watching the same levels and waiting for a breakout or breakdown.
For active traders, the game plan around Opendoor Technologies Inc comes down to preparation and discipline. Study the daily and intraday levels, track volume, and know exactly where you will cut losses. As millionaire penny stock trader and teacher Tim Sykes, says, “Embrace the journey, the ups and downs; each mistake is a lesson to improve your strategy.”. As Tim Sykes likes to say, “The best traders are the best risk managers.” With OPEN, that mindset is not optional — it is the whole edge. This analysis is for educational and research purposes only and is not investment advice.
This is stock news, not investment advice. Timothy Sykes News delivers real-time stock market news focused on key catalysts driving short-term price movements. Our content is tailored for active traders and investors seeking to capitalize on rapid price fluctuations, particularly in volatile sectors like penny stocks. Readers come to us for detailed coverage on earnings reports, mergers, FDA approvals, new contracts, and unusual trading volumes that can trigger significant short-term price action. Some users utilize our news to explain sudden stock movements, while others rely on it for diligent research into potential investment opportunities.
Dive deeper into the world of trading with Timothy Sykes, renowned for his expertise in penny stocks. Explore his top picks and discover the strategies that have propelled him to success with these articles:
- Penny Stocks Trading Guide
- Best Penny Stocks Under $1 to Buy Today
- Top 8 Penny Stocks to Watch on Robinhood
Once you’ve got some stocks on watch, elevate your trading game with StocksToTrade the ultimate platform for traders. With specialized tools for swing and day trading, StocksToTrade will guide you through the market’s twists and turns.
Dig into StocksToTrade’s watchlists here:





Leave a reply