

Leverage Shares 2X Long SPCX Daily jumped as SPAC-related optimism surged, and its stocks have been trading up by 16.0 percent.
Key Takeaways
- SPCH has slid from above $13 to the high-$9s, signaling a sharp momentum shift after an aggressive run.
- Daily candles show heavy intraday swings, highlighting how leveraged SPCH amplifies the underlying SPCX moves.
- Intraday tape points to tight consolidation around $10–$11, as traders battle over short-term direction.
- Lack of clear financial ratios keeps the focus squarely on price action and disciplined risk management.
- Active traders are watching prior support and resistance levels to frame potential day and swing trades.
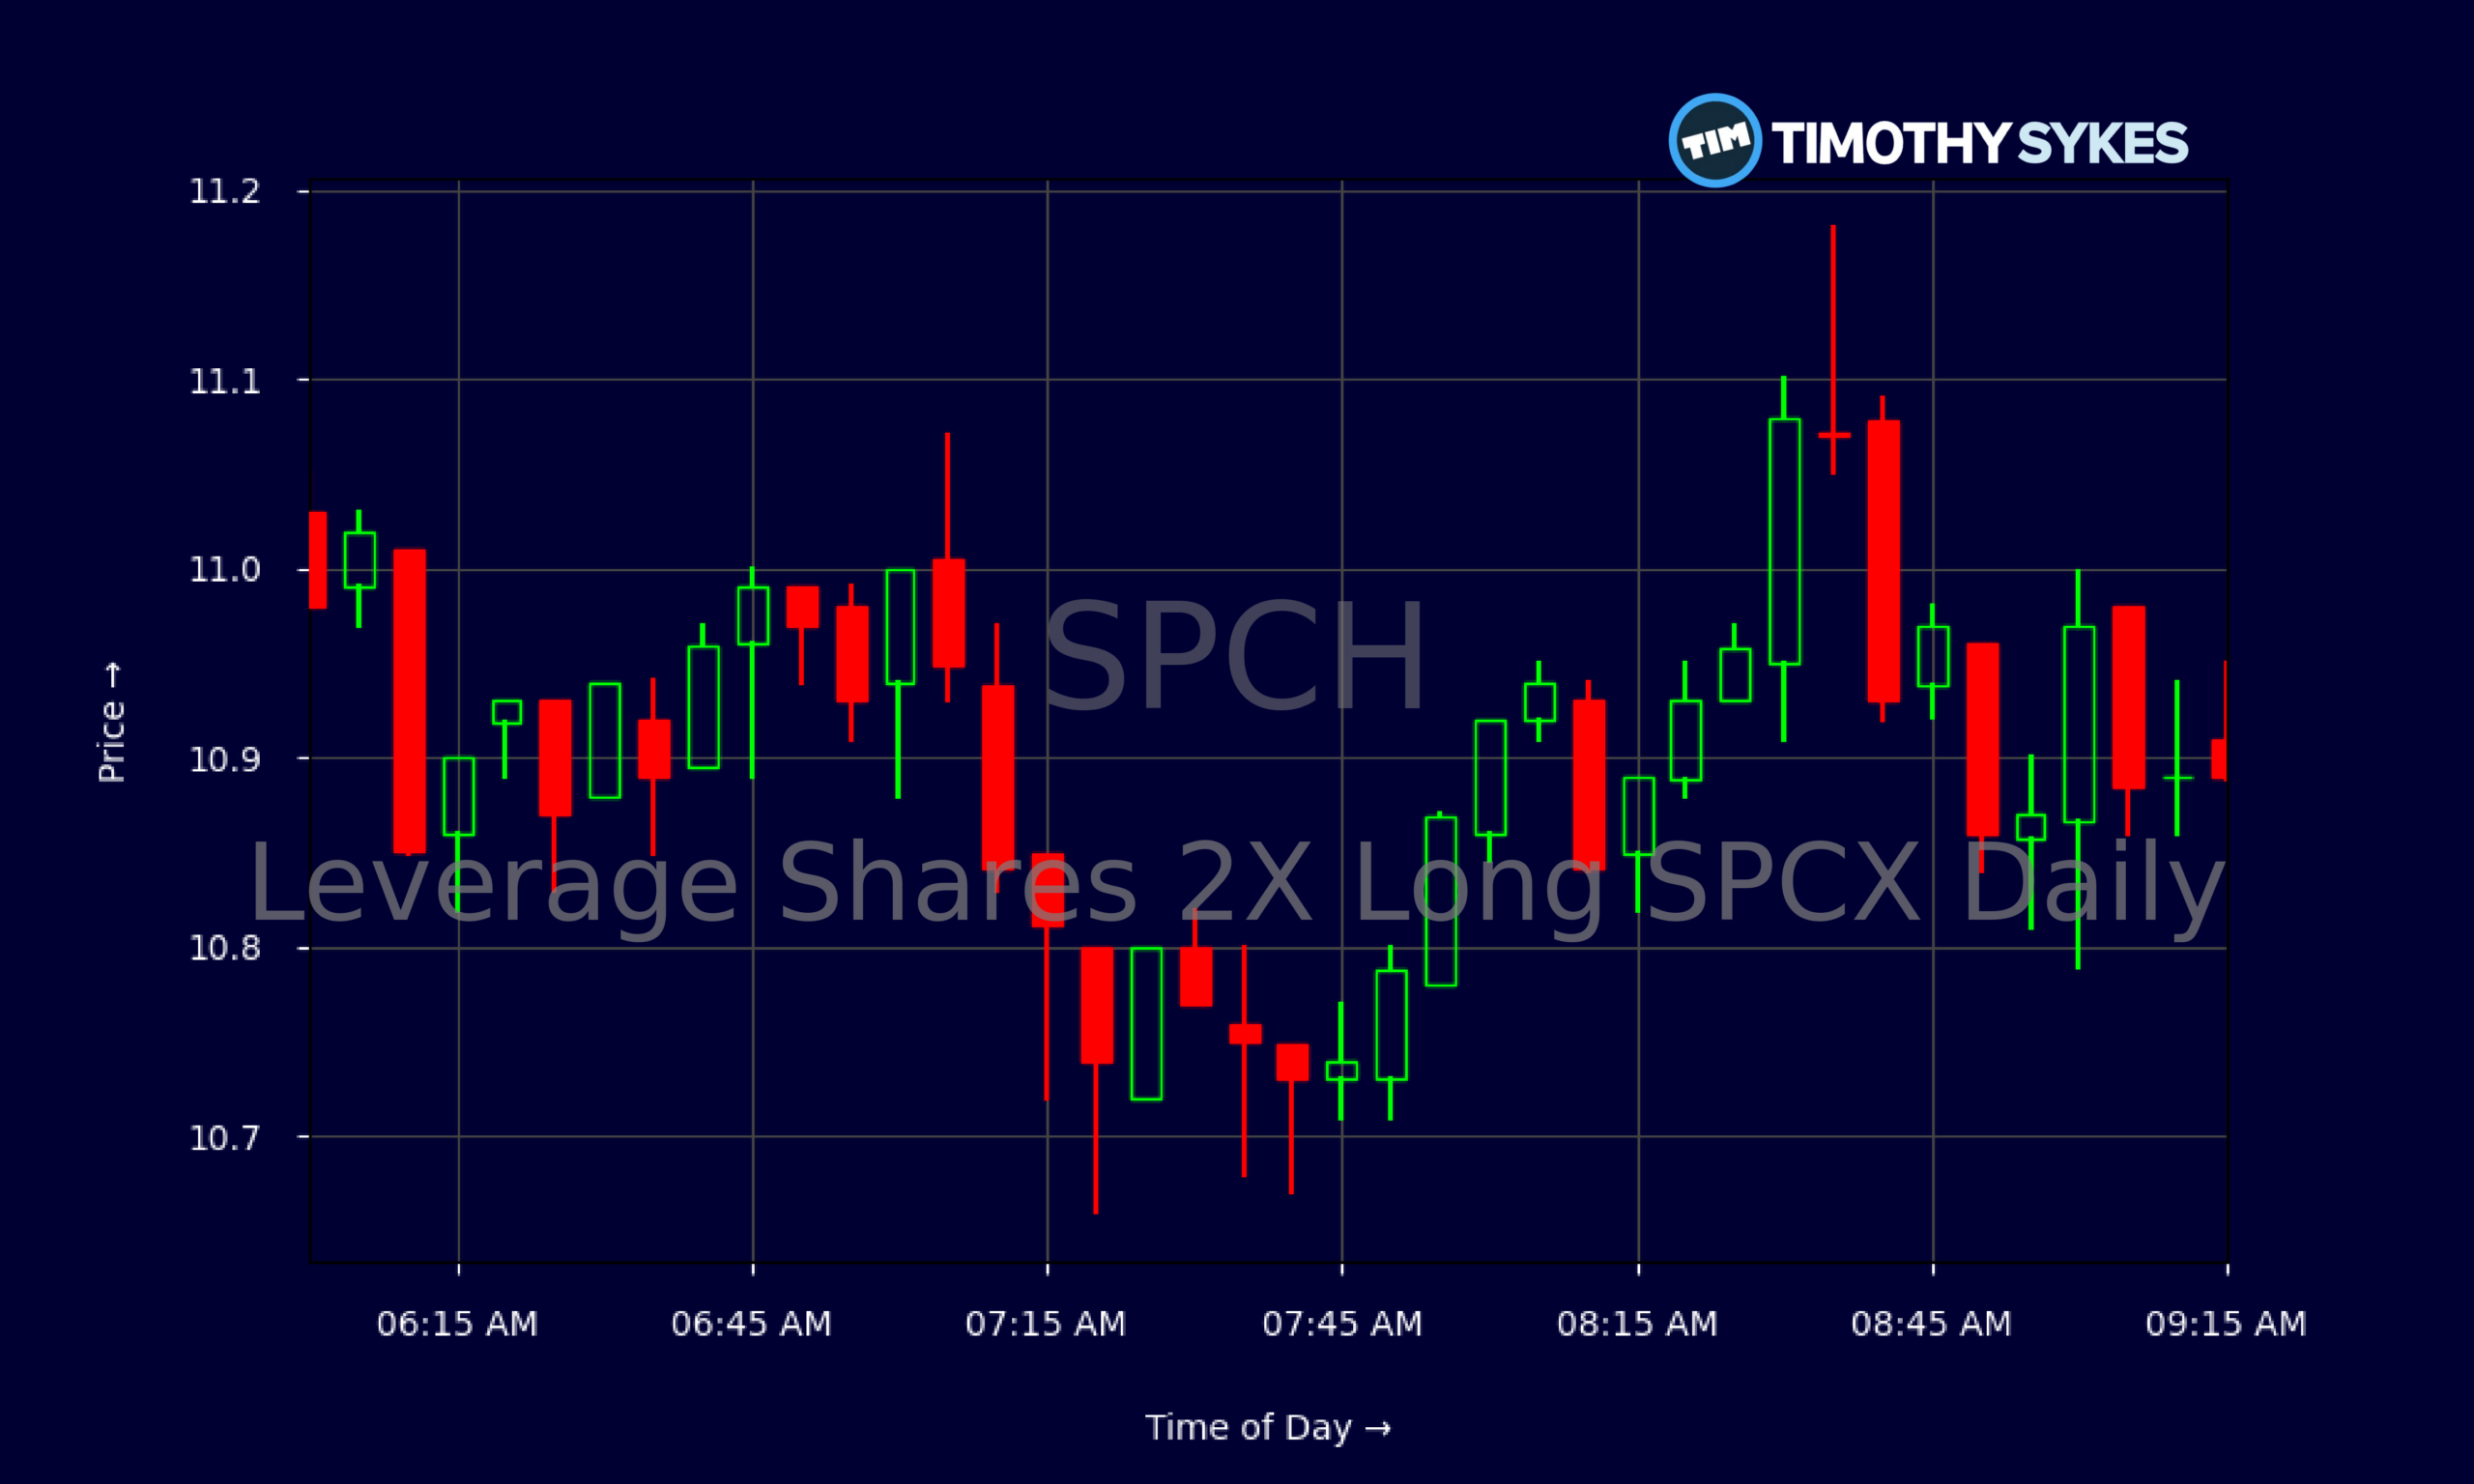
Live Update At 09:21:41 EDT: On Wednesday, October 21, 2026 Leverage Shares 2X Long SPCX Daily stock [BATS Global Markets: SPCH] is trending up by 16.0%! Discover the key drivers behind this movement as well as our expert analysis in the detailed breakdown below.
Quick Financial Overview
Leverage Shares 2X Long SPCX Daily, trading under ticker SPCH, is built as a trading product, not a classic fundamental story. The key ratios page is basically a blank slate. That tells traders one thing: SPCH is about price action, leverage, and short-term direction on its underlying, not earnings or balance sheets.
Over the past few weeks, SPCH has traded roughly between $9 and $13, with a recent close near $9.41 after a high near $13.55 earlier in the month. That’s a big percentage swing in a short window. For traders, that means opportunity, but it also means real danger for anyone who over-sizes or overstays.
More Breaking News
The daily candles show wide ranges and frequent reversals. SPCH often gaps, spikes, and then retraces, typical of leveraged exchange-traded products. Since this is a 2X product, every move in the underlying is magnified on the SPCH chart, both up and down. Without earnings, dividends, or valuation anchors, traders must lean on chart levels, volume, and volatility bands to navigate this name.
Why Traders Are Watching SPCH Price Action
SPCH has been delivering the kind of intraday swings that attract momentum traders. Earlier this month, SPCH ripped from around $9.80 to over $12.90 in a handful of sessions, a move of more than 30%. Since then, it has backed off toward the mid-$9s, showing how quickly leveraged products can round-trip gains.
The daily chart of SPCH looks like a series of mini rollercoasters. One day it opens near $11.80, pushes above $12, then closes lower around $11.57. Another day it taps the mid-$13s before fading. This pattern tells experienced traders that SPCH is a textbook “trade the move, not the story” vehicle. The story here is leverage — nothing more, nothing less.
Zoom in to the intraday five-minute chart and the message is the same. SPCH spends long stretches chopping between $10.80 and $11.10, then throws quick pushes to $11.18 or dips into the $10.70s. Those 3–4% intraday swings become fuel for scalpers and short-term breakout traders.
Because SPCH tracks a SPAC-focused product with 2X leverage, broad sentiment toward speculative growth and SPAC exposure can hit it fast. When risk-on flows return to that corner of the market, SPCH tends to react aggressively. When traders de-risk, the selling pressure can be just as violent. For now, the tape shows a recent downtrend from the $13 area but with active two-sided trading around $10–$11, a clear battleground for short-term setups.
Conclusion
For active traders, SPCH is a pure volatility play. With no meaningful revenue, margin, or debt metrics to anchor long-term valuations, Leverage Shares 2X Long SPCX Daily trades like a levered sentiment gauge on a SPAC-heavy basket. The recent slide from the $13s to under $10 is not a quiet drift; it’s a sharp reset that punishes late chasers and rewards traders who respected prior resistance.
Intraday, SPCH continues to show steady liquidity and tight ranges that occasionally explode into fast moves. Those pops above $11 and flushes into the high-$10s are where disciplined traders find their edge, using clear risk levels and tight stops. The daily support band around $9–$9.20, and resistance zones near $11.50–$12, are the obvious levels on most screens.
The key with SPCH is remembering what it is: a leveraged tool. That demands strict rules. As Tim Sykes loves to hammer home, “The market doesn’t owe you anything — trade the pattern, cut losses quickly, and don’t fall in love with any ticker.” As millionaire penny stock trader and teacher Tim Sykes, says, “It’s better to go home at zero than to go home in the red.”. For traders using SPCH, that mindset isn’t optional. It’s survival. This analysis is for educational and research purposes only, and every trader needs a plan before touching a product that can move this fast.
This is stock news, not investment advice. Timothy Sykes News delivers real-time stock market news focused on key catalysts driving short-term price movements. Our content is tailored for active traders and investors seeking to capitalize on rapid price fluctuations, particularly in volatile sectors like penny stocks. Readers come to us for detailed coverage on earnings reports, mergers, FDA approvals, new contracts, and unusual trading volumes that can trigger significant short-term price action. Some users utilize our news to explain sudden stock movements, while others rely on it for diligent research into potential investment opportunities.
Dive deeper into the world of trading with Timothy Sykes, renowned for his expertise in penny stocks. Explore his top picks and discover the strategies that have propelled him to success with these articles:
- Penny Stocks Trading Guide
- Best Penny Stocks Under $1 to Buy Today
- Top 8 Penny Stocks to Watch on Robinhood
Once you’ve got some stocks on watch, elevate your trading game with StocksToTrade the ultimate platform for traders. With specialized tools for swing and day trading, StocksToTrade will guide you through the market’s twists and turns.
Dig into StocksToTrade’s watchlists here:





Leave a reply