

FTC Solar Inc. stocks have been trading up by 12.41 percent after upbeat coverage of its solar tracking technology growth prospects.
Key Takeaways Traders Need To Watch
- U.S. manufacturers are nearing commercialization of higher‑efficiency tandem solar panels, with FTC Solar (FTCI) named among companies that may benefit from greater balance‑of‑system demand.
- The company amended its credit deal, pushing a $5M repayment to 2027 and easing covenants, giving FTCI near‑term liquidity relief but spotlighting balance‑sheet strain.
- An upcoming Q3 2026 earnings call will put FTC Solar’s cash burn, order pipeline, and execution under the microscope for active traders.
- A cluster of Form 4 filings shows insider ownership changes in FTCI, but with no transaction detail, the trading signal remains unclear.
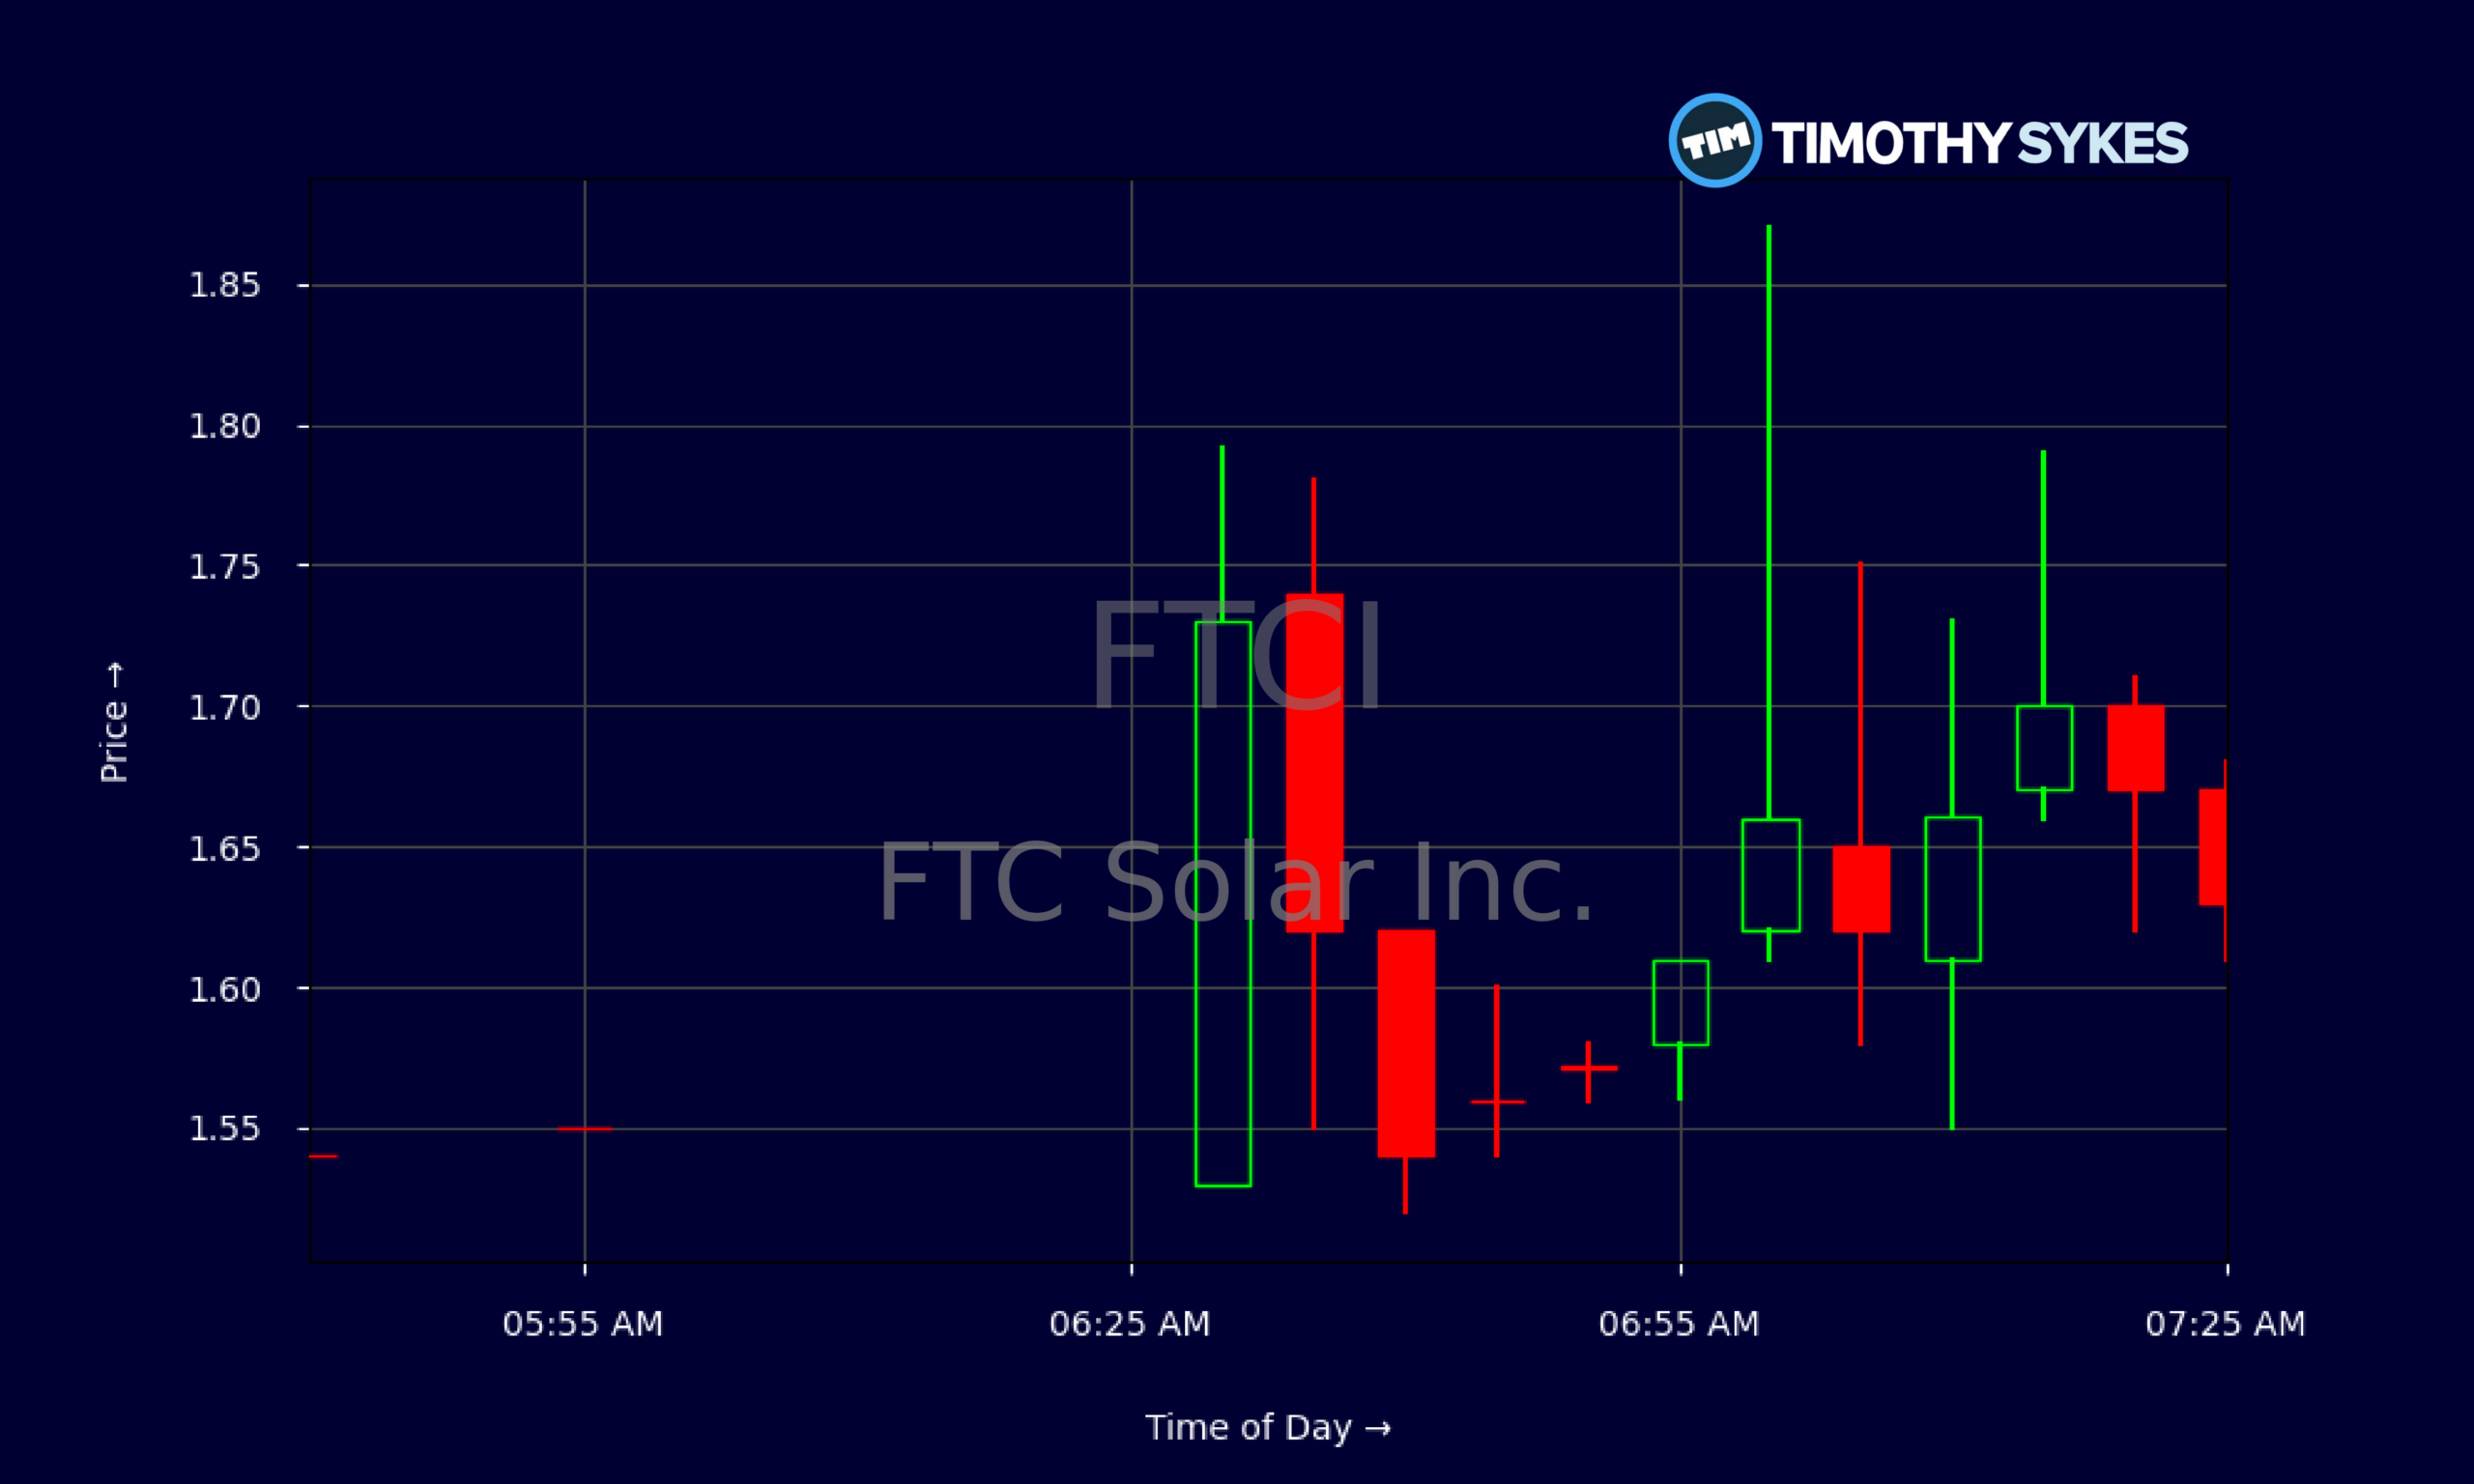
Live Update At 07:32:38 EST: On Wednesday, November 04, 2026 FTC Solar Inc. stock [NASDAQ: FTCI] is trending up by 12.41%! Discover the key drivers behind this movement as well as our expert analysis in the detailed breakdown below.
Quick Financial Overview
FTCI is trading in classic “battleground small cap” territory. Over the recent multi‑week stretch, the stock slid from closes near $1.83–$1.94 down toward the mid‑$1.40s, showing a steady downtrend with short-lived bounces. Daily ranges have been tight, which tells traders the big money is not piling in yet, but dip buyers are still willing to probe support.
Intraday, the 5‑minute tape around $1.60–$1.70 shows sharp spikes and quick fades. That kind of whippy action is what momentum traders look for, but it also punishes anyone who hesitates. FTCI is not a sleepy solar name; it’s a trading vehicle.
Under the hood, the numbers show why the stock trades like this. FTC Solar posted about $26.2M in quarterly revenue but a net loss of roughly $27.1M. Gross margin was slightly negative and profit margins deeply in the red, with EBIT margin around -38%. Return on assets near -52% and a current ratio of 0.9 signal real financial stress.
More Breaking News
At the same time, the valuation looks washed‑out. A price‑to‑sales ratio near 0.34 and enterprise value around $40.7M imply the market is pricing FTCI like a turnaround long shot. For traders, that mix of weak fundamentals and low expectations is exactly what can fuel violent moves when any good news hits.
Why Traders Are Watching FTCI Right Now
What puts FTC Solar on more watchlists today is the collision of industry tech shifts and balance‑sheet drama. The New York Times highlighted that U.S. solar manufacturers are close to rolling out tandem solar panels, which can deliver roughly 25% more energy than traditional modules. FTCI is not building those panels, but it is listed among the solar‑exposed public companies positioned to benefit from the ripple effects.
Here’s the key point for traders: higher‑efficiency modules usually mean more value per square foot, which tends to support demand for smarter trackers and balance‑of‑system solutions. That’s FTC Solar’s lane. If tandem panels scale, utility‑scale developers will care more about squeezing out every extra watt and minimizing land usage. That reinforces the long‑term narrative for FTCI’s tracker systems, software, and engineering services.
At the same time, FTC Solar just renegotiated its credit agreement. Management secured a deferral of a $5M principal payment to 2027/03/31, got its financial covenants suspended for the rest of 2026, and agreed to looser cash and EBITDA tests that only kick in during early 2027. For equity traders, this matters. It lowers near‑term default risk and buys FTCI time to execute, but it also confirms that lenders wanted protection and that the business has been running hot on cash.
Layer on top the series of Form 4 filings. Insiders and major holders have recently changed their stakes in FTC Solar, though the disclosures do not say whether they were buying or selling, or at what size. That means the filings are a “heads‑up,” not a green or red light. Active traders in FTCI should treat them as a reminder that people close to the story are moving pieces around, then focus on the chart and upcoming catalysts.
Conclusion
For traders who live on volatility and news catalysts, FTC Solar sits right in the sweet spot. The tape shows a beaten‑down solar small cap with heavy losses, thin liquidity, and a chart that can snap a dime at a time on relatively modest volume. At the same time, FTCI is now tied to a bigger narrative: tandem solar technology that promises 25% more energy output and fresh demand for advanced balance‑of‑system hardware.
The amended credit agreement gives FTC Solar breathing room, pushing that $5M payment out to 2027 and relaxing covenants until after 2026. That is a short‑term win for liquidity, but traders should not ignore the red flags in the financials: negative equity, a current ratio below 1, and margins deep in the red. The upcoming Q3 2026 earnings release and conference call become the next major checkpoint for anyone trading FTCI around the catalyst.
As Tim Sykes likes to hammer home, “Patterns repeat, but only if you’re prepared.” As millionaire penny stock trader and teacher Tim Sykes says, “Embrace the journey, the ups and downs; each mistake is a lesson to improve your strategy.”. FTC Solar is a classic example. The pattern here is a high‑risk, low‑priced name with real sector tailwinds, serious financial strain, and constant headline flow. Traders who track FTCI closely, manage risk, and react to price action rather than hope are the ones most likely to get paid. This analysis is for educational and research purposes only, but it outlines why FTC Solar remains a name to watch on every active trader’s screen.
This is stock news, not investment advice. Timothy Sykes News delivers real-time stock market news focused on key catalysts driving short-term price movements. Our content is tailored for active traders and investors seeking to capitalize on rapid price fluctuations, particularly in volatile sectors like penny stocks. Readers come to us for detailed coverage on earnings reports, mergers, FDA approvals, new contracts, and unusual trading volumes that can trigger significant short-term price action. Some users utilize our news to explain sudden stock movements, while others rely on it for diligent research into potential investment opportunities.
Dive deeper into the world of trading with Timothy Sykes, renowned for his expertise in penny stocks. Explore his top picks and discover the strategies that have propelled him to success with these articles:
- Penny Stocks Trading Guide
- Best Penny Stocks Under $1 to Buy Today
- Top 8 Penny Stocks to Watch on Robinhood
Once you’ve got some stocks on watch, elevate your trading game with StocksToTrade the ultimate platform for traders. With specialized tools for swing and day trading, StocksToTrade will guide you through the market’s twists and turns.
Dig into StocksToTrade’s watchlists here:





Leave a reply