
Leverage Shares 2X Long CBRS Daily ETF surged as upbeat sentiment on CBRS-related growth prospects drove stocks have been trading up by 11.73 percent.
Key Takeaways
- Price action in Leverage Shares 2X Long CBRS Daily ETF shows a sharp slide from mid-October highs, followed by choppy attempts to base around $1.00.
- Volatility in CBRG has expanded, with multiple daily ranges over 20%, creating both opportunity and elevated risk for short-term trading.
- Intraday tape shows CBRG grinding higher off the open and then stabilizing, hinting at short-term consolidation after heavy selling.
- Lack of clear fundamental ratios or cash-flow data keeps CBRG a chart-driven product, where price, volume, and the underlying index dominate trading decisions.
Live Update At 12:32:14 EDT: On Thursday, October 29, 2026 Leverage Shares 2X Long CBRS Daily ETF stock [BATS Global Markets: CBRG] is trending up by 11.73%! Discover the key drivers behind this movement as well as our expert analysis in the detailed breakdown below.
Quick Financial Overview
CBRG, the Leverage Shares 2X Long CBRS Daily ETF, is built for traders who want leveraged exposure, not quiet, buy-and-hold action. The recent chart confirms that. From early October, CBRG traded near $2.70–$2.80, then pushed as high as the $2.80s before rolling over hard. Over the next three weeks, CBRG bled lower in stages, closing near $1.09 on 2026/10/29. That is a drop of roughly 60% from the early-month highs.
Because CBRG is a leveraged ETF tied to an underlying index, traditional valuation ratios, earnings, or profit margins don’t tell the story. The key driver is underlying price action, and leverage amplifies every move. For traders, that means CBRG behaves like a high-beta momentum vehicle. When the underlying trends, CBRG can move fast in the same direction; when the underlying chops or reverses, this ETF can decay or whipsaw.
More Breaking News
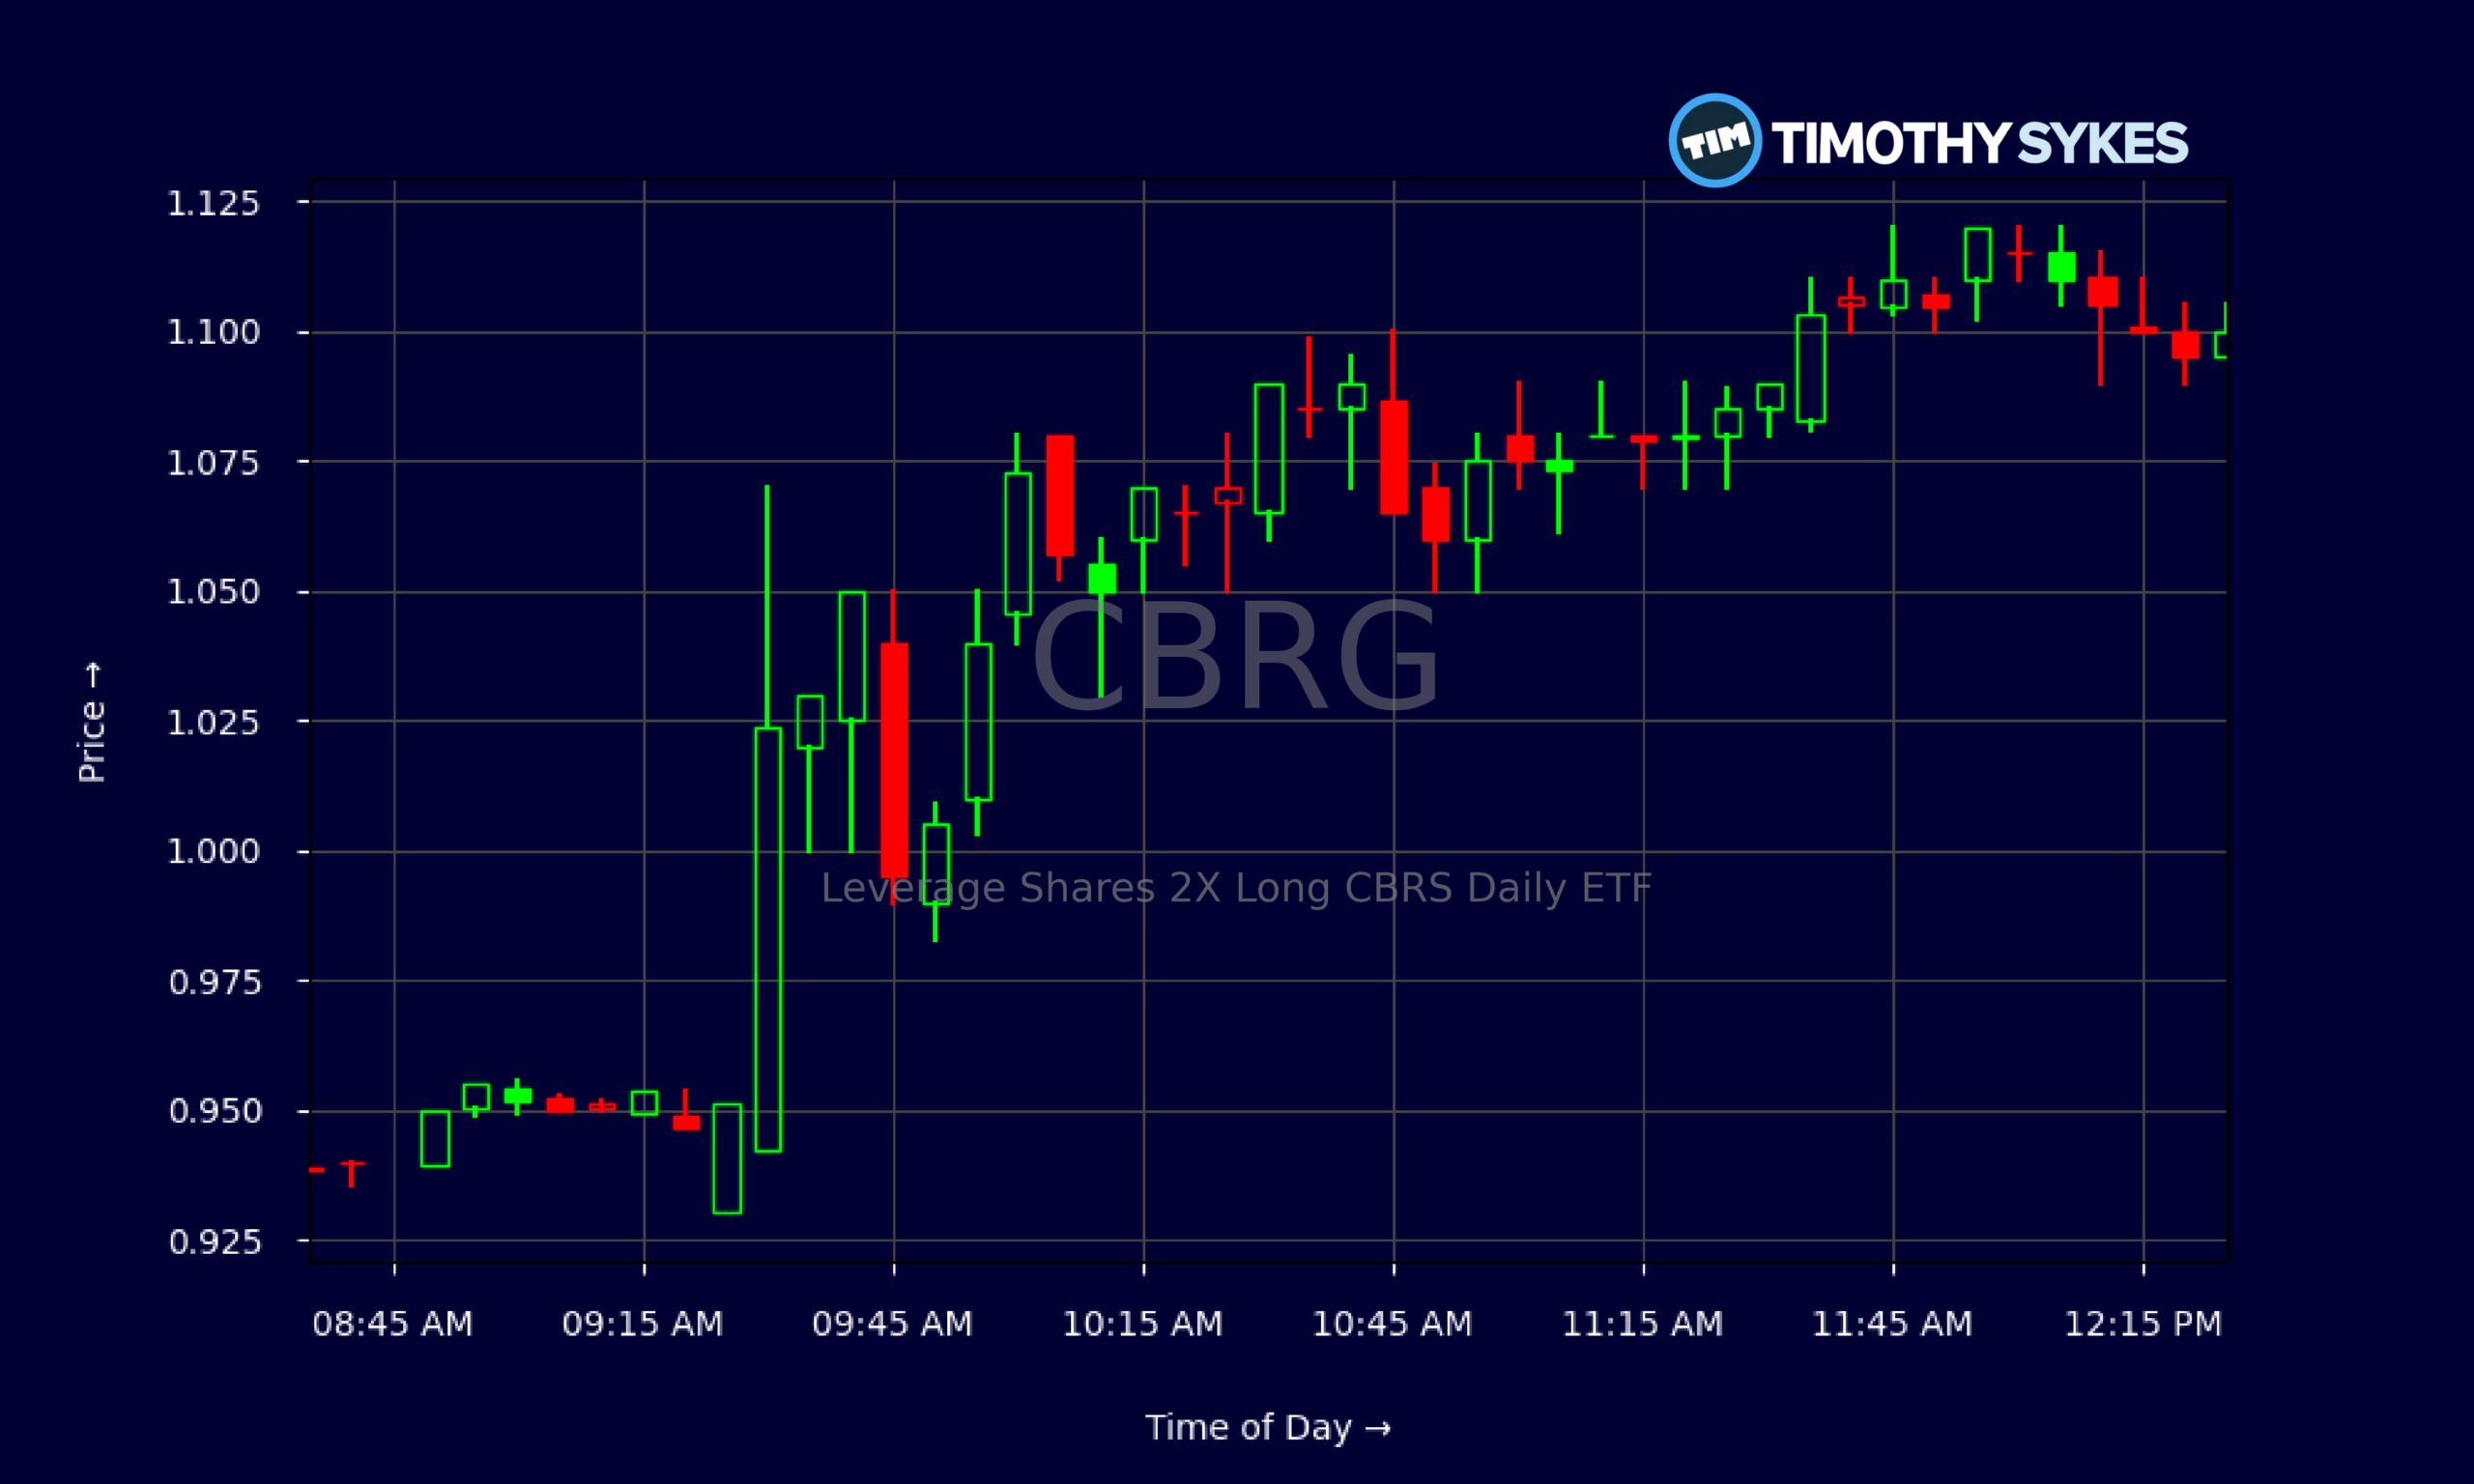
On the daily chart, CBRG is now trading well below its earlier range, which warns that trend-followers are in control. But the recent tight intraday consolidation around $1.05–$1.11 also signals a potential pause where short-term traders will look for the next break.
Why Traders Are Watching CBRG’s Volatile Chart
CBRG’s recent path is a textbook leveraged unwind. On 2026/10/05 and 2026/10/06, Leverage Shares 2X Long CBRS Daily ETF closed above $2.60, printing strong, wide ranges that attracted momentum traders chasing upside. The next few sessions held that $2.40–$2.80 band, keeping CBRG elevated and liquid. Then the floor gave way.
From 2026/10/12 onward, CBRG started stepping down: $2.16, then the $1.70s, then the $1.60s. By 2026/10/19, price closed near $1.16, almost cutting the ETF in half in less than two weeks. That’s exactly what leveraged products do when the underlying trend flips — they don’t just pull back, they compress hard.
The selloff didn’t stop there. CBRG drifted into the low $1s, even tagging sub-$1 intraday levels around 2026/10/28. For traders, those breaks under $1.00 matter. They can trigger stop orders, margin rules, and psychological fear, all of which feed volatility.
Now zoom into the intraday tape for 2026/10/29. CBRG opened around $0.94 in premarket, then ripped above $1.02 right after the open. The ETF spent most of the day stair-stepping between $1.05 and $1.12, with repeated tests of the low $1.10s. That intraday behavior shows two important tells: dip buyers are finally showing up, and short sellers are no longer in full control. When a leveraged product like CBRG stops making fresh lows and starts grinding sideways, experienced traders pay attention. It often sets up the next big move — either a relief bounce or another leg down.
Conclusion
For active traders, CBRG is a pure price-action classroom right now. The Leverage Shares 2X Long CBRS Daily ETF has shown how a strong uptrend can flip into an aggressive downtrend, wiping out early October gains and punishing anyone who overstayed. At the same time, the intraday consolidation near $1.00 highlights how markets don’t move in straight lines. Even in downtrends, there are bounces, bases, and fake-outs.
Because CBRG is a leveraged ETF without traditional earnings or cash-flow anchors, every trade comes back to three things: trend, volatility, and risk control. The downtrend on the daily chart tells traders not to blindly guess bottoms. The expanding ranges warn that position sizing and tight risk levels matter even more than usual. And the recent stabilization in the $1.05–$1.11 band gives a clear technical zone to plan around.
This is exactly the kind of setup Tim Sykes and his community study day in, day out — fast movers where discipline is the edge, not predictions. As millionaire penny stock trader and teacher Tim Sykes, says, “Cut losses quickly, let profits ride, and don’t overtrade.”. As Tim Sykes likes to remind traders, “Trade like a sniper, not a machine gunner. Wait for the best setups, then strike with a plan and cut losses fast.” For anyone watching CBRG, that mindset is not optional — it is survival.
This is stock news, not investment advice. Timothy Sykes News delivers real-time stock market news focused on key catalysts driving short-term price movements. Our content is tailored for active traders and investors seeking to capitalize on rapid price fluctuations, particularly in volatile sectors like penny stocks. Readers come to us for detailed coverage on earnings reports, mergers, FDA approvals, new contracts, and unusual trading volumes that can trigger significant short-term price action. Some users utilize our news to explain sudden stock movements, while others rely on it for diligent research into potential investment opportunities.
Dive deeper into the world of trading with Timothy Sykes, renowned for his expertise in penny stocks. Explore his top picks and discover the strategies that have propelled him to success with these articles:
- Penny Stocks Trading Guide
- Best Penny Stocks Under $1 to Buy Today
- Top 8 Penny Stocks to Watch on Robinhood
Once you’ve got some stocks on watch, elevate your trading game with StocksToTrade the ultimate platform for traders. With specialized tools for swing and day trading, StocksToTrade will guide you through the market’s twists and turns.
Dig into StocksToTrade’s watchlists here:





Leave a reply