

Imperial Oil Limited stocks have been trading up by 8.73 percent amid bullish sentiment on strong energy demand fundamentals.
What Traders Need To Know
- Scotiabank raised its price target on Imperial Oil to C$183 from C$156 while maintaining a Sector Perform rating, pointing to better valuation but only mid-pack expectations.
- RBC increased its price target on Imperial Oil to C$133 from C$123 yet kept an underperform rating, reinforcing a cautious stance.
- The broader analyst consensus remains underweight on Imperial Oil Limited, with a higher mean target price near C$160.53.
- An upcoming 2026 third-quarter earnings call on 2026/10/30 will give traders fresh Q3 results and management commentary via webcast.
- Management has contingency plans if EDGAR filings are delayed, aiming to keep earnings materials accessible and information flow stable.
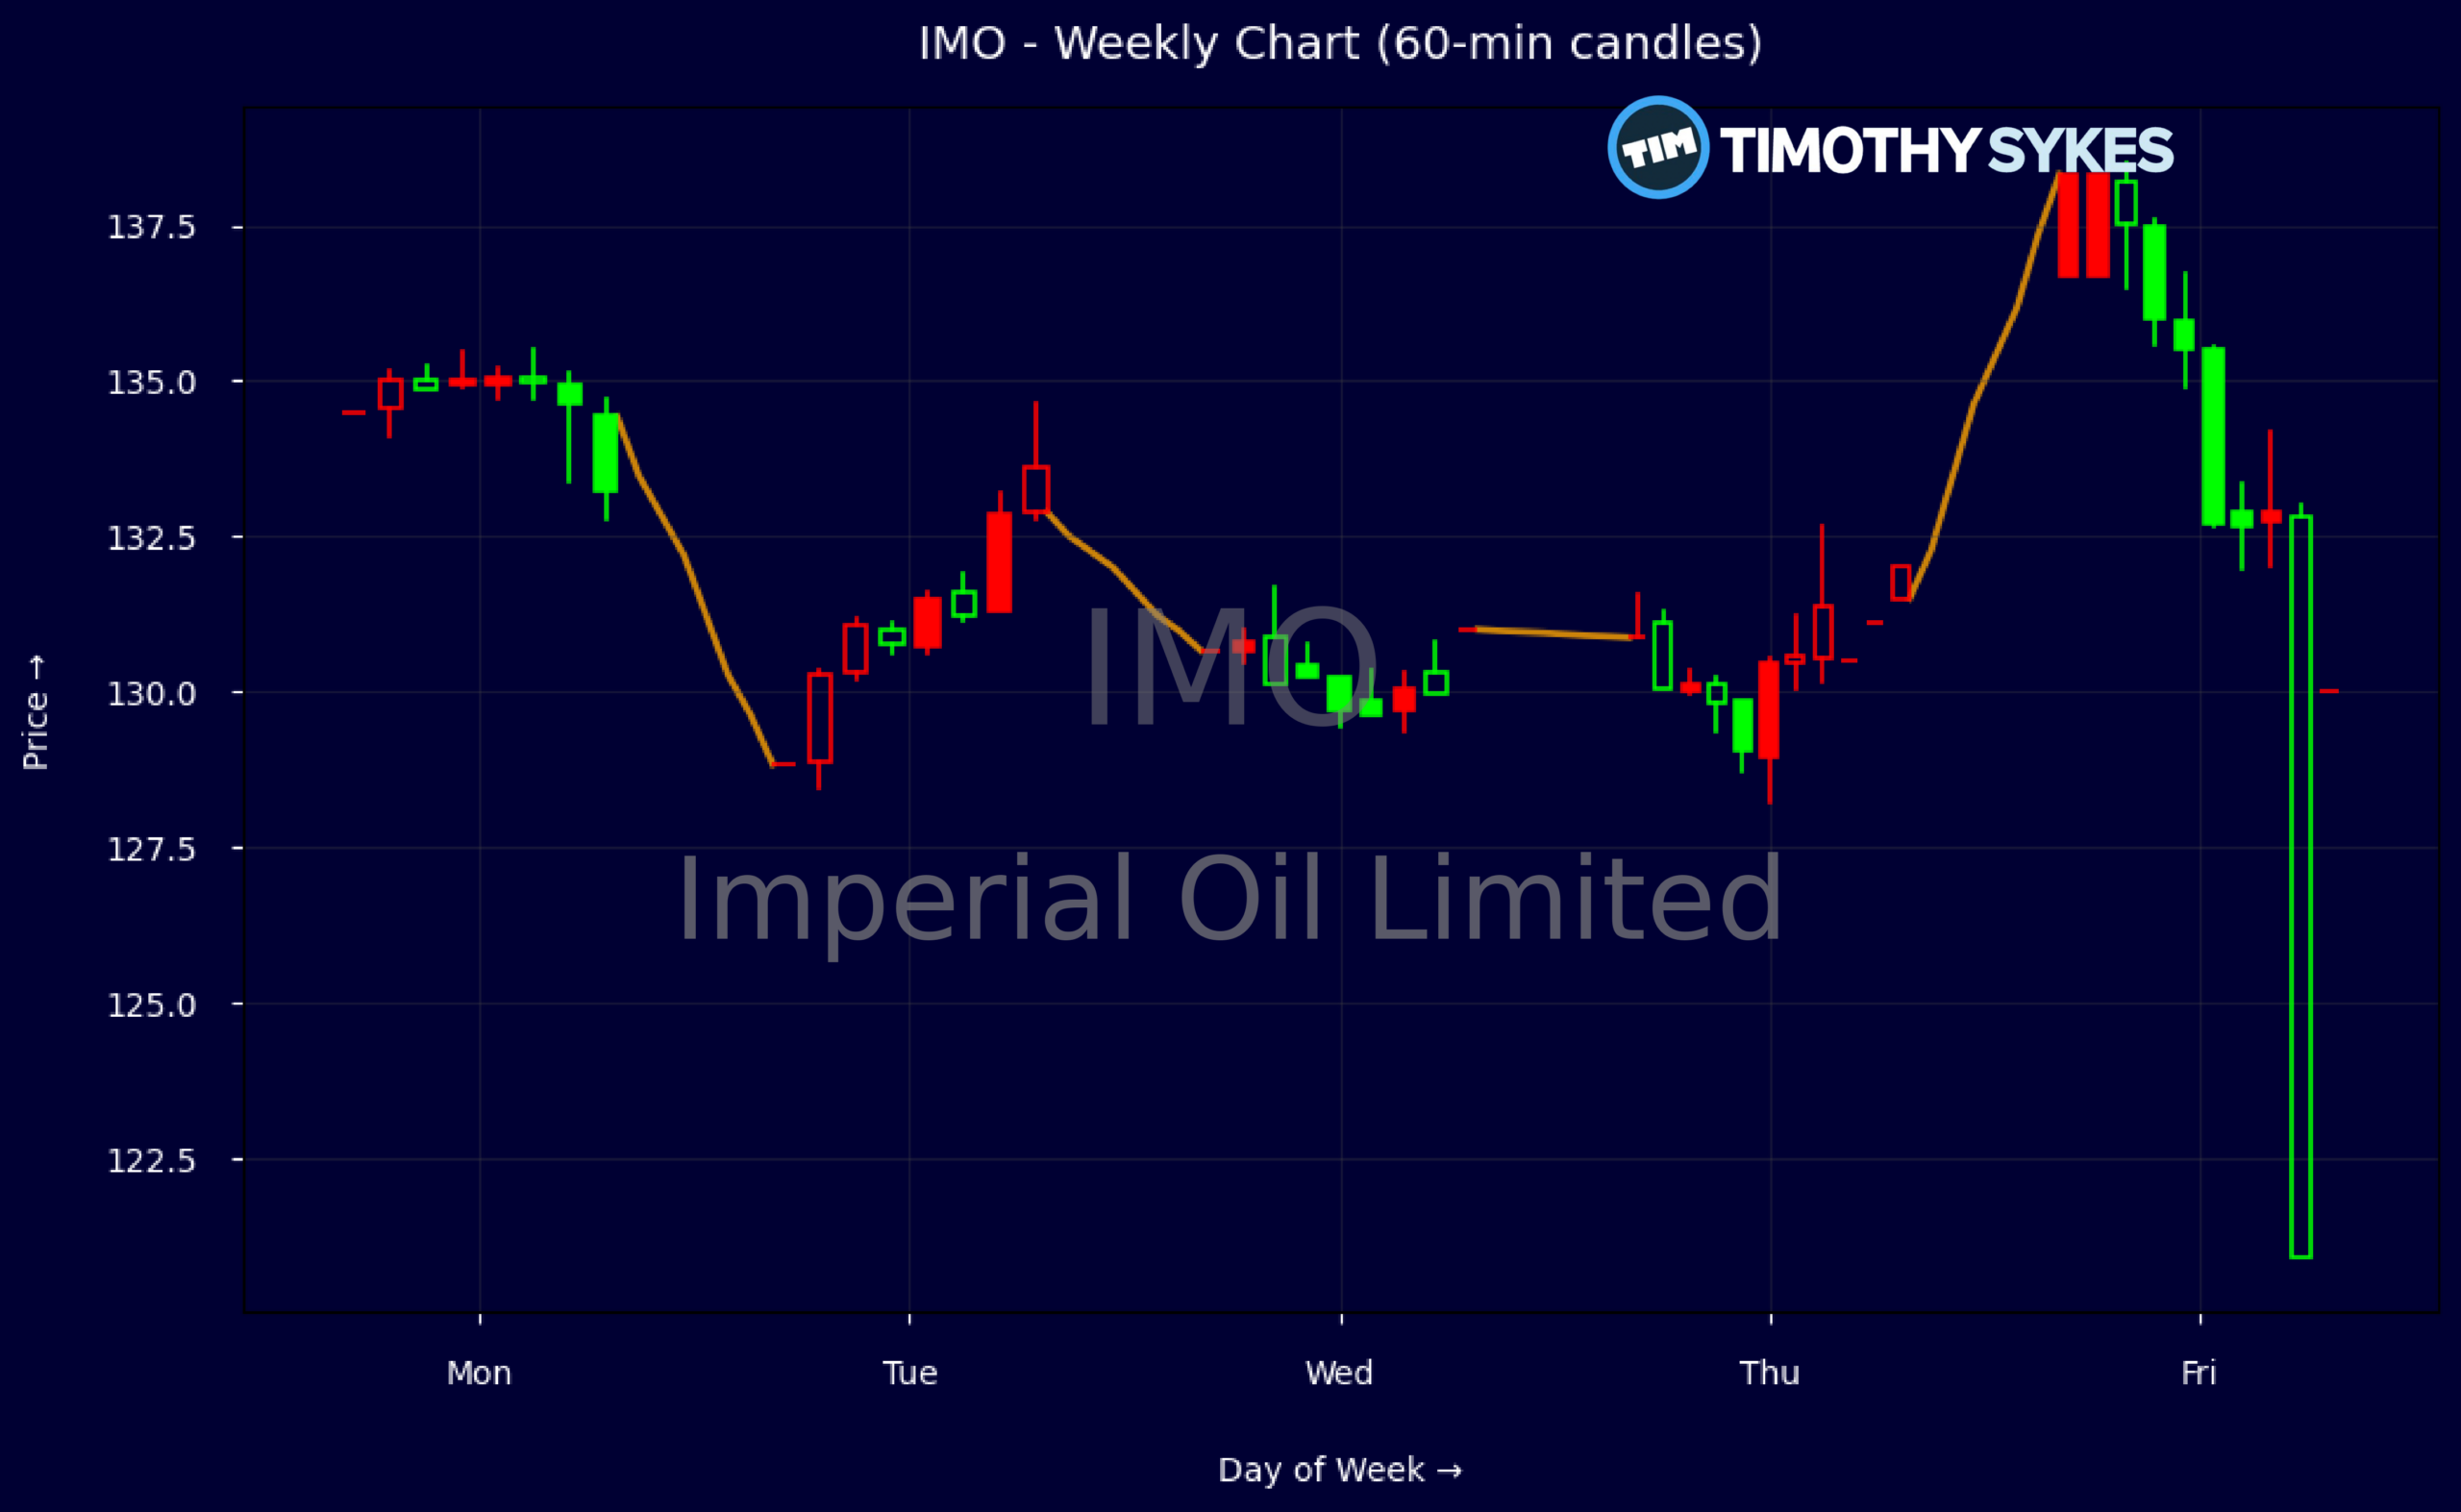
Weekly Update Oct 26 – Oct 30, 2026: On Friday, October 30, 2026 Imperial Oil Limited stock [NYSE American: IMO] is trending up by 8.73%! Discover the key drivers behind this movement as well as our expert analysis in the detailed breakdown below.
Energy industry expert:
Analyst sentiment – positive
Imperial Oil (IMO) sits in the first quartile of the global integrated energy peer group on returns, with ROIC near 33% and ROA above 9% supported by an EBIT margin of ~11% and EBITDA margin of 16%. Revenue has been volatile (3-year CAGR -16.4%) but longer-term 5-year growth of ~15% underscores cyclicality rather than structural decline. Balance sheet strength is exemplary: net debt is minimal (total debt/equity 0.17, interest coverage 192x), funding C$2.17B quarterly free cash flow and a ~1.9% dividend yield growing >20% annually, implying ample room for further capital returns.
Technically, IMO is in a short-term uptrend after rebounding from C$128.83 to C$136.69 over the week, with higher highs and a strong push from the C$130–131 consolidation band. Intraday 5-minute candles show buyers consistently absorbing dips near C$134–135 with expanding volume into the C$136–138 zone, suggesting active accumulation rather than distribution. The key actionable level is C$134: above this, long entries are favored with tight risk; a decisive break below C$130 would negate the bullish bias and signal a shift back to range trading or corrective downside.
Upcoming Q3 results and the October 30 earnings call are the main near-term catalysts, likely to highlight sustained free cash flow and capital return policy. Street targets are moving higher (Scotiabank to C$183, RBC to C$133 despite underperform), while consensus remains cautious versus broader Energy benchmarks, where majors often trade on lower P/E and similar or weaker balance sheets. Relative to fossil-fuel peers, IMO’s superior ROIC and low leverage justify a premium; I see fair value in the C$150–160 range over 12 months, with support at C$130 and resistance near C$140–145 short term.
More Breaking News
Quick Financial Overview
Imperial Oil Limited shows a steady upward bias in recent weekly prices, with the stock pushing from the low C$130s to a close near C$136.69. Intraday action reveals a strong opening drive from roughly C$120.89 at the open to above C$130 within the first minutes, then a controlled grind higher into the C$137–C$138 area before a slight fade into the close. For short-term traders, that pattern signals active demand on dips and responsive selling into strength, rather than a blow-off move.
On the fundamental side, Imperial Oil Limited generated quarterly revenue of about $15.9B with net income of roughly $2.19B, producing a profit margin just above 8%. Operating income of about $2.79B and EBITDA near $3.39B line up with solid profitability metrics: EBIT margin around 10.8% and EBITDA margin near 16%. Key ratios like a price-to-earnings near 20.6 and price-to-sales about 1.68 suggest the market is willing to pay a fair premium, but not an extreme one, for these earnings and cash flows.
Cash generation is a clear strength. Operating cash flow of about $2.70B and free cash flow around $2.17B in the recent quarter support both capex of roughly $530M and dividends of about $421M. The balance sheet is conservative, with total debt-to-equity near 0.17, strong interest coverage around 192, and current and quick ratios of 1.4 and 1.1, respectively. Add in return on equity close to 50% and return on capital above 30%, and Imperial Oil Limited screens as an efficient, cash-rich operator, even while revenue has been shrinking over the last three years.
Conclusion
Imperial Oil Limited sits in an interesting middle ground for traders. Price action shows clear buying interest, with the stock ramping sharply off the open and then holding most of the gains into the C$135–C$138 zone. That kind of trend day tells you there are real bids under the market, but the late-day cooling hints at short-term traders locking in profits rather than long-term capital chasing aggressively.
On the research side, Scotiabank lifting its target to C$183 and RBC nudging theirs to C$133 show that Street models are drifting higher, yet the Sector Perform and underperform ratings keep a lid on enthusiasm. The broader underweight stance and mean target around C$160.53 say the crowd still expects Imperial Oil Limited to perform in line with or slightly behind peers, not break away. For active traders, that usually translates into a name you trade around levels and catalysts, not one you blindly chase.
The next clear catalyst is the 2026/10/30 third-quarter earnings call, which will let the market test these higher targets against fresh Q3 numbers and management tone. Until then, the key is watching how price behaves around the recent C$130–C$138 band, and whether pullbacks get bought quickly or start to deepen. As I tell my own students, “Your edge in names like IMO comes from reading the tape around known catalysts and respecting what the price is actually doing, not what you hope it will do.” As millionaire penny stock trader and teacher Tim Sykes, says, “Embrace the journey, the ups and downs; each mistake is a lesson to improve your strategy.”
This is stock news, not investment advice. Timothy Sykes News delivers real-time stock market news focused on key catalysts driving short-term price movements. Our content is tailored for active traders and investors seeking to capitalize on rapid price fluctuations, particularly in volatile sectors like penny stocks. Readers come to us for detailed coverage on earnings reports, mergers, FDA approvals, new contracts, and unusual trading volumes that can trigger significant short-term price action. Some users utilize our news to explain sudden stock movements, while others rely on it for diligent research into potential investment opportunities.
Dive deeper into the world of trading with Timothy Sykes, renowned for his expertise in penny stocks. Explore his top picks and discover the strategies that have propelled him to success with these articles:
- Penny Stocks Trading Guide
- Best Penny Stocks Under $1 to Buy Today
- Top 8 Penny Stocks to Watch on Robinhood
Once you’ve got some stocks on watch, elevate your trading game with StocksToTrade the ultimate platform for traders. With specialized tools for swing and day trading, StocksToTrade will guide you through the market’s twists and turns.
Dig into StocksToTrade’s watchlists here:





Leave a reply