

Cypherpunk Technologies Inc. stocks have been trading up by 12.25 percent amid heightened optimism around its expanding crypto-investment strategy.
Key Takeaways
- Price action in CYPH shows a pullback from early-month highs above $4 toward the mid-$2 range, with signs of short-term stabilization.
- The latest quarter shows Cypherpunk Technologies Inc. booking a large net income on gains from securities, while core operations remain cash-burning.
- CYPH carries zero long-term debt and a very strong current ratio, giving traders confidence the company can weather volatility.
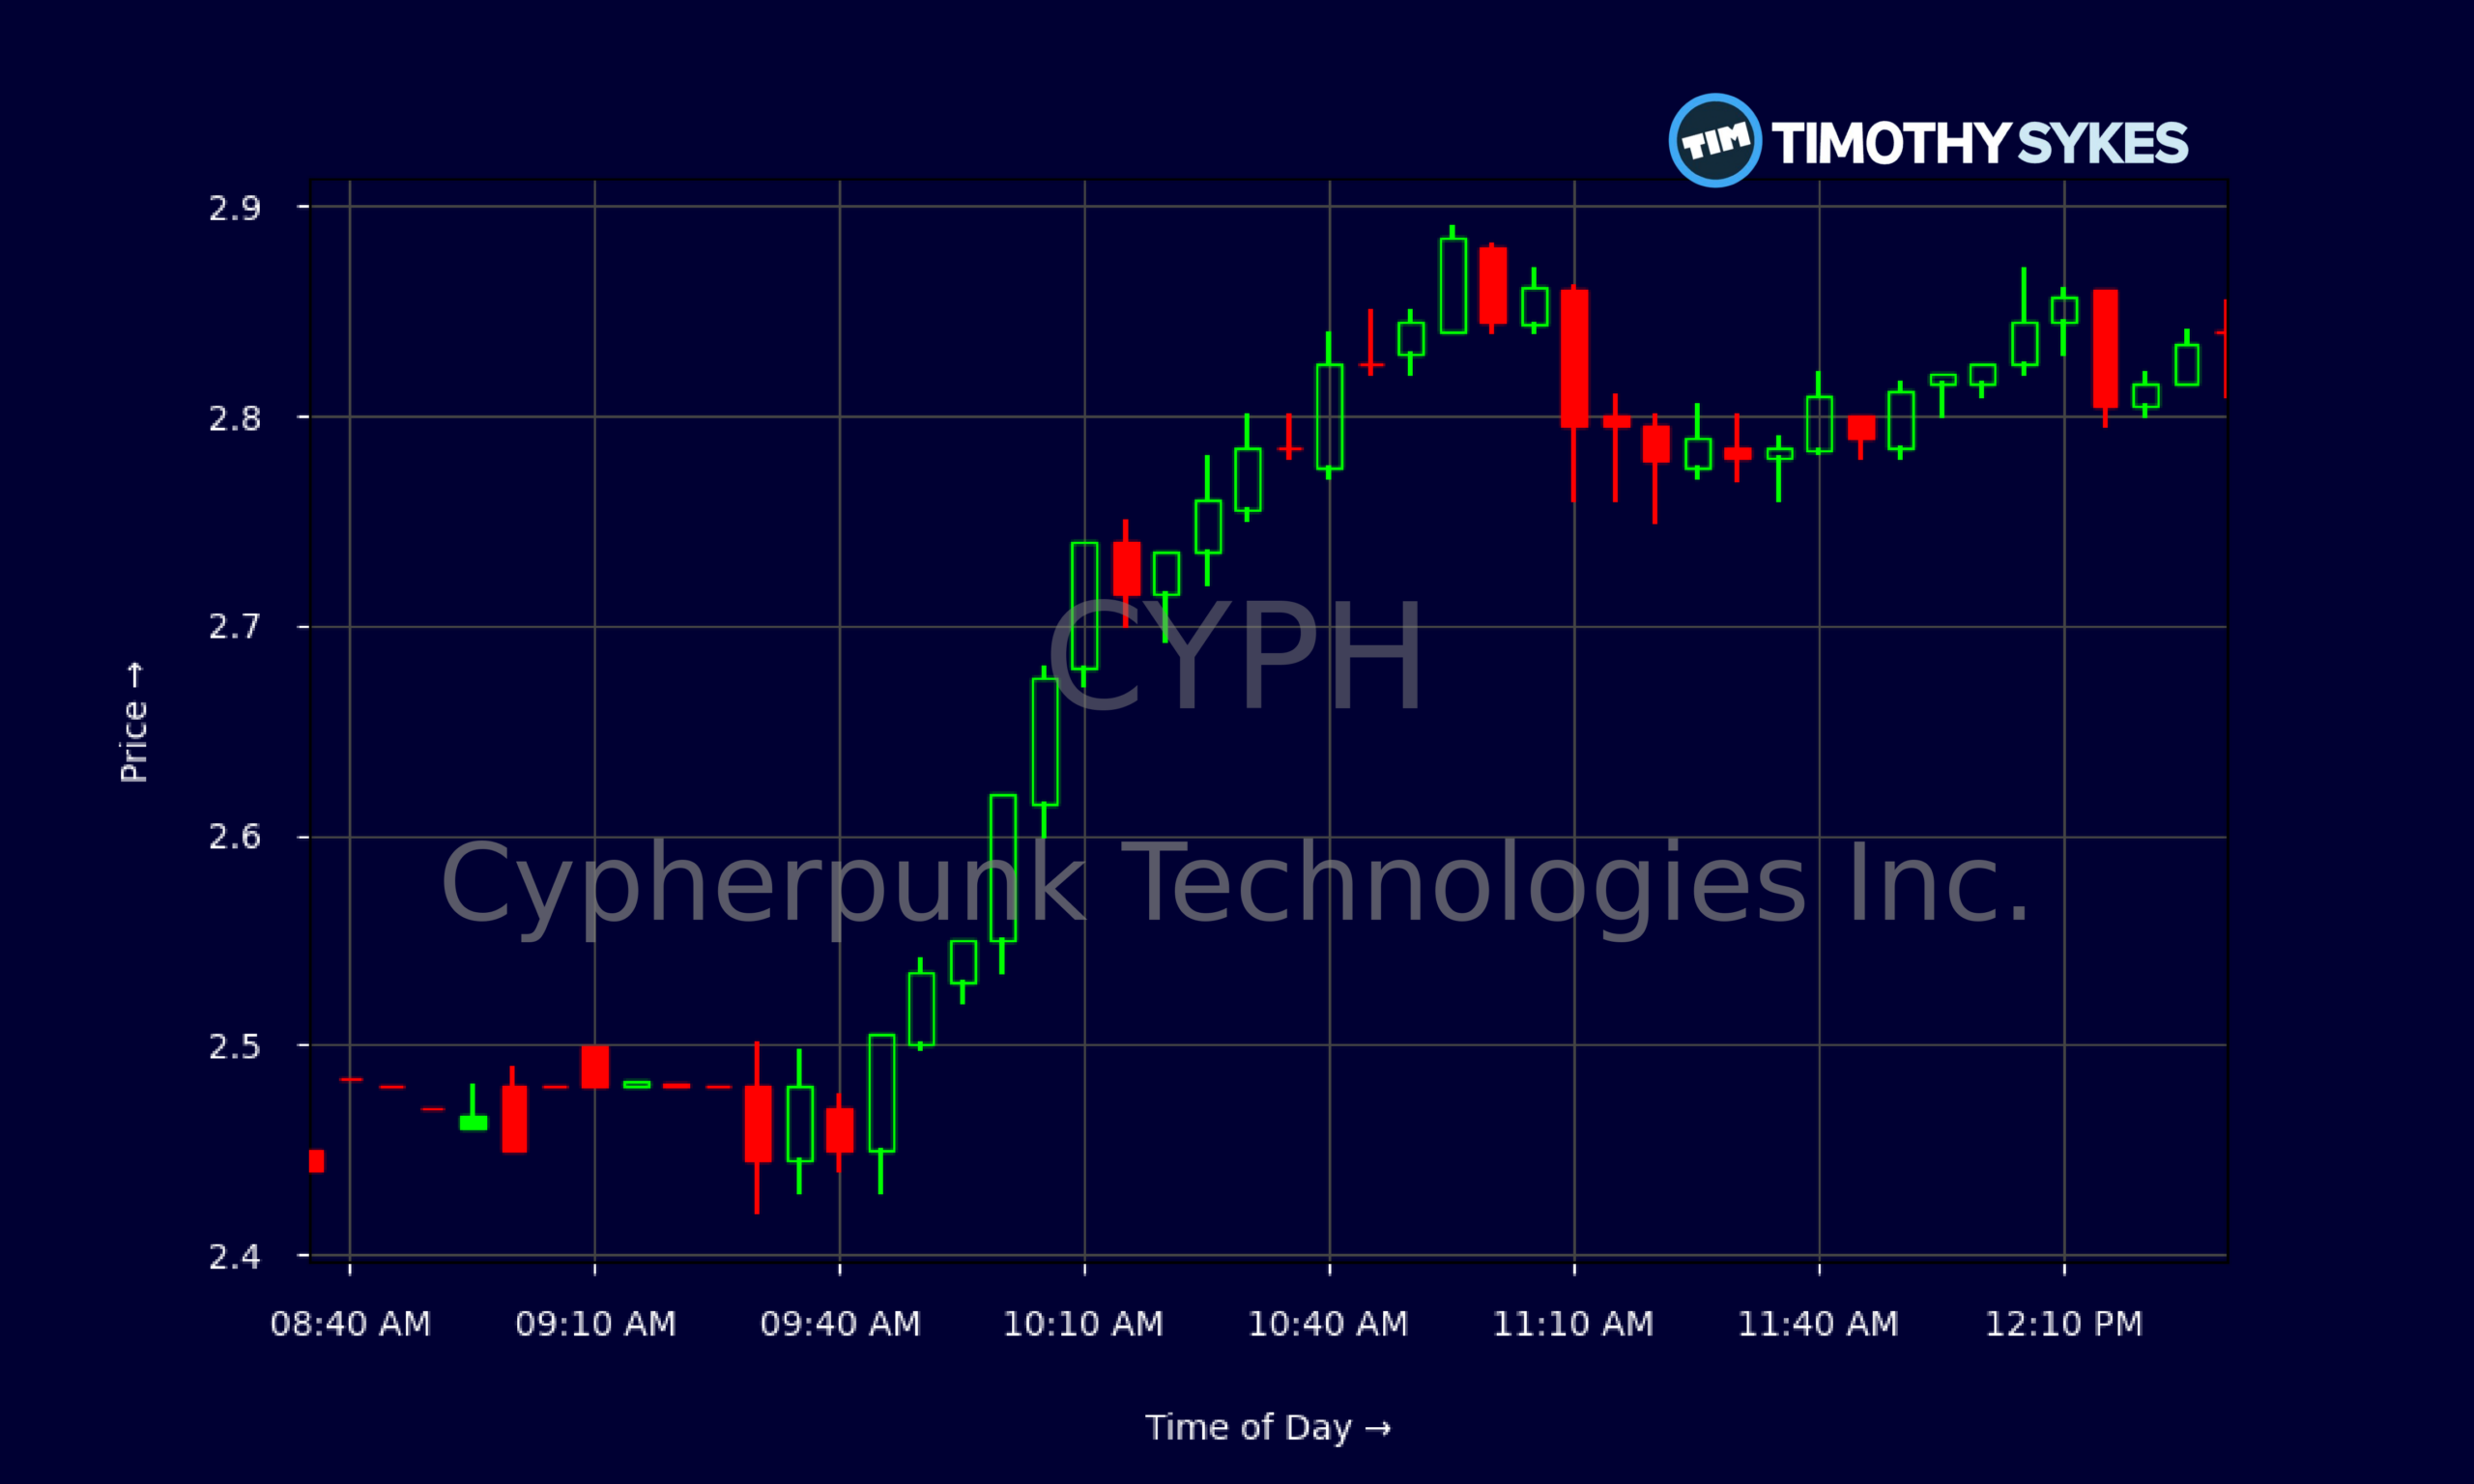
- Intraday CYPH trading shows tight consolidation around $2.80, suggesting a battle between profit-takers and dip buyers.
Live Update At 12:33:06 EDT: On Tuesday, October 20, 2026 Cypherpunk Technologies Inc. stock [NASDAQ: CYPH] is trending up by 12.25%! Discover the key drivers behind this movement as well as our expert analysis in the detailed breakdown below.
Quick Financial Overview
Cypherpunk Technologies Inc. sits in a strange but tradable spot. On paper, the latest quarter looks explosive. CYPH reported about $39.4M in net income and roughly $0.18 in diluted EPS, driven mainly by a big gain on sale of securities. For momentum traders, that kind of headline profitability can attract attention fast.
Dig deeper, though, and the story looks different. Operating income for Cypherpunk Technologies Inc. was negative, with about $4.7M in operating expenses and no clear recurring revenue base in the reported numbers. Operating cash flow was roughly -$2.7M and free cash flow around -$12.2M, so CYPH is still spending more than it brings in from its core business.
More Breaking News
The good news for traders: the balance sheet is strong. CYPH shows total assets near $143M, equity around $139M, and essentially no meaningful long-term debt. The current ratio is sky-high, and leverage is minimal. That means Cypherpunk Technologies Inc. has runway to keep operating and trading as a speculative vehicle. Combine that with a P/E near 5 on this noisy earnings print and CYPH becomes a classic battleground between value hunters and skeptics.
Why Traders Are Watching CYPH Price Action
CYPH’s chart is where the real story sits right now. Cypherpunk Technologies Inc. ran to the $4.00–$4.20 area in late September, then faded steadily into the high $2s by late October. For active traders, that’s a classic momentum blow-off followed by digestion. Volatility has cooled, but the range is still wide enough to offer trades.
Look at the daily closes: CYPH dropped from about $4.12 to the low $3s, then into the $2.50–$2.90 channel. That’s a clear downtrend, but not a collapse. In the most recent session, Cypherpunk Technologies Inc. opened around $2.48 and closed near $2.84, with a high just under $2.90. Buyers stepped in aggressively after a soft open and held gains all day.
The 5-minute intraday chart backs that up. Early trading in CYPH pushed the stock from the mid-$2.40s up through $2.60 and $2.70, then into a tight band between $2.80 and $2.86 for most of midday. That kind of consolidation after a morning push often signals a potential base, especially if volume supports it.
For short-term traders, the $2.40–$2.50 area in Cypherpunk Technologies Inc. now looks like a key support zone, while $3.00–$3.10 becomes the first resistance band to watch. If CYPH can build higher lows above $2.70 on future sessions, momentum players may lean long for a possible retest of the $3s. If it cracks $2.40 with range expanding, many will look for a fast flush and possible panic-bounce setup.
Conclusion
CYPH is a textbook example of a speculative name with real trading range, a quirky income statement, and a surprisingly strong balance sheet. Cypherpunk Technologies Inc. just printed big net income thanks to securities gains, but underneath that, operations are still losing cash. That disconnect is exactly what draws experienced traders: the numbers look bold, yet the underlying story remains uncertain.
On the chart, CYPH has clearly cooled off from the $4+ spike, but the recent bounce from the mid-$2s into the high-$2s shows the bid is not dead. The intraday grind around $2.80 hints that Cypherpunk Technologies Inc. is trying to form a volatility base, where future catalysts — even sector-wide risk-on moves in speculative tech or crypto-adjacent names — can trigger sharp pushes.
For now, traders in CYPH should focus on levels and risk, not hope. Support near $2.40, resistance near $3.00, and the behavior around those zones matter more than any single ratio. As millionaire penny stock trader and teacher Tim Sykes, says, “Consistency is key in trading; don’t let emotions dictate your trades.”. As Tim Sykes likes to say, “Patterns repeat, but you have to be prepared and you have to cut losses quickly.” Applied to CYPH, that means stalking the setup, respecting the volatility, and treating every trade as an educational, research-driven process — not a blind bet.
This is stock news, not investment advice. Timothy Sykes News delivers real-time stock market news focused on key catalysts driving short-term price movements. Our content is tailored for active traders and investors seeking to capitalize on rapid price fluctuations, particularly in volatile sectors like penny stocks. Readers come to us for detailed coverage on earnings reports, mergers, FDA approvals, new contracts, and unusual trading volumes that can trigger significant short-term price action. Some users utilize our news to explain sudden stock movements, while others rely on it for diligent research into potential investment opportunities.
Dive deeper into the world of trading with Timothy Sykes, renowned for his expertise in penny stocks. Explore his top picks and discover the strategies that have propelled him to success with these articles:
- Penny Stocks Trading Guide
- Best Penny Stocks Under $1 to Buy Today
- Top 8 Penny Stocks to Watch on Robinhood
Once you’ve got some stocks on watch, elevate your trading game with StocksToTrade the ultimate platform for traders. With specialized tools for swing and day trading, StocksToTrade will guide you through the market’s twists and turns.
Dig into StocksToTrade’s watchlists here:





Leave a reply