

Cypherpunk Technologies Inc. stocks have been trading up by 12.28 percent amid heightened enthusiasm for privacy-focused blockchain investments.
Key Takeaways
- Shares have faded from a recent push above $4, with CYPH now consolidating in the low-$3s after a sharp multi-day run.
- Intraday action shows tight trading between $3.16 and $3.28, signaling a battle between breakout traders and profit-takers.
- Cypherpunk Technologies Inc. carries strong liquidity and no long-term debt, giving CYPH breathing room despite mixed earnings quality.
- Key ratios show negative returns on assets and equity, so traders are betting more on momentum and sector sentiment than current profitability.

Live Update At 09:18:45 EDT: On Friday, October 02, 2026 Cypherpunk Technologies Inc. stock [NASDAQ: CYPH] is trending up by 12.28%! Discover the key drivers behind this movement as well as our expert analysis in the detailed breakdown below.
Quick Financial Overview
CYPH has been trading like a classic momentum name. On the daily chart, Cypherpunk Technologies Inc. ramped from the low-$2s to above $4 in roughly two weeks, then pulled back to close near $2.92 on the latest day. That’s a big round trip, and it tells traders this name can move fast in both directions.
The latest quarterly report shows Cypherpunk Technologies Inc. with about $7.6M in cash and roughly $143M in total assets. Current liabilities sit under $2M, and total debt is effectively zero. For a small-cap like CYPH, that balance sheet is a major cushion. The current ratio north of 70 and no long-term debt give the company time to execute without constant financing pressure.
More Breaking News
But the income side is messy. CYPH prints a positive EPS mainly because of gains on securities, while core operations still lose money. Return on assets and equity are deeply negative, which tells traders the business engine is not yet firing. In simple terms, Cypherpunk Technologies Inc. has a solid cash runway but is still searching for consistent operating strength, making CYPH a sentiment and chart-driven trading vehicle right now.
Why Traders Are Watching CYPH Price Action
CYPH has quickly turned into a volatility magnet. Daily candles show Cypherpunk Technologies Inc. blasting from around $2.20 on 2026/09/15 to highs above $4.19 by 2026/09/25, then rolling over into a controlled fade. That’s the type of move short-term traders look for: clean waves of expansion and contraction.
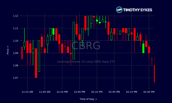
On the latest day, CYPH opened near $3.13 and closed around $2.92, with a high near $3.27. That intraday range is tight compared with the prior week, hinting that Cypherpunk Technologies Inc. is shifting from pure momentum to consolidation. The 5‑minute chart backs this up: for hours, CYPH bounced in a narrow band between roughly $3.16 and $3.28. That’s textbook sideways action after a pullback, where both long and short traders are sizing each other up.
For active traders, this matters more than any headline. A stock like CYPH, with a reasonably clean cap table, decent cash, and weak underlying profitability, often trades as a pure vehicle for sentiment and technicals. When Cypherpunk Technologies Inc. builds a base like this after a strong run, traders start marking clear levels. The recent range around $3 is now the key battleground. Above the mid-$3s, prior resistance looms from the $3.70–$4.20 zone. Below $2.70, Cypherpunk Technologies Inc. would be giving back a bigger chunk of that September push, opening the door to a deeper washout.
Conclusion
CYPH is exactly the kind of stock that rewards prepared traders and punishes lazy ones. The fundamentals of Cypherpunk Technologies Inc. show a cash-rich, low-debt balance sheet but a business that has yet to produce reliable operating profits. That mix creates a playground for momentum, not a steady compounding story. For short-term traders, the message is simple: respect the risk, trade the levels.
Right now, CYPH is sitting in a consolidation pocket after a strong spike and fade. The tight intraday band between roughly $3.16 and $3.28 shows that Cypherpunk Technologies Inc. is in a decision zone. A break over recent highs can squeeze shorts and draw in breakout traders; a crack under recent lows can trigger stop-loss waves from late longs. Either way, the chart will likely move faster than the fundamentals.
As Tim Sykes loves to say, “Patterns repeat, but people don’t study them enough.” That idea ties directly into another core trading rule that applies perfectly here: As millionaire penny stock trader and teacher Tim Sykes, says, “Cut losses quickly, let profits ride, and don’t overtrade.”. CYPH gives traders a live case study in that idea. Study how Cypherpunk Technologies Inc. ran, where it topped, how it pulled back, and how it’s now basing. Use that to build your trading plan — with tight risk, clear levels, and zero emotion. This is educational material, not a buy or sell call, and the real edge comes from doing the work before the next big move hits.
This is stock news, not investment advice. Timothy Sykes News delivers real-time stock market news focused on key catalysts driving short-term price movements. Our content is tailored for active traders and investors seeking to capitalize on rapid price fluctuations, particularly in volatile sectors like penny stocks. Readers come to us for detailed coverage on earnings reports, mergers, FDA approvals, new contracts, and unusual trading volumes that can trigger significant short-term price action. Some users utilize our news to explain sudden stock movements, while others rely on it for diligent research into potential investment opportunities.
Dive deeper into the world of trading with Timothy Sykes, renowned for his expertise in penny stocks. Explore his top picks and discover the strategies that have propelled him to success with these articles:
- Penny Stocks Trading Guide
- Best Penny Stocks Under $1 to Buy Today
- Top 8 Penny Stocks to Watch on Robinhood
Once you’ve got some stocks on watch, elevate your trading game with StocksToTrade the ultimate platform for traders. With specialized tools for swing and day trading, StocksToTrade will guide you through the market’s twists and turns.
Dig into StocksToTrade’s watchlists here:



Leave a reply