
Nebius Group N.V. stocks have been trading down by -3.38 percent amid investor concerns over its latest AI infrastructure expansion strategy
Key Takeaways
- Shares have logged repeated premarket drops, including a roughly 4% slide on 2026/10/20 that erased the prior day’s bounce in NBIS and other Wallstreetbets names.
- On 2026/10/15, Nebius Group fell again before the bell after a prior double‑digit plunge, with no fresh catalyst driving the selloff.
- Selling in NBIS has been persistent, with a 2.1% premarket drop after nearly 5% down on Monday and a 1.7% loss after a 1.5% decline the day before.
- Michael Burry shifted from a straight short in Nebius Group to June put options at double‑digit strikes, a leveraged bearish bet against the AI‑linked story.
- After sharp losses on Friday, NBIS and other Wallstreetbets‑favored stocks briefly rebounded 1%–4% premarket on 2026/10/19, a relief bounce inside a broader downtrend.
Live Update At 08:32:28 EDT: On Thursday, October 22, 2026 Nebius Group N.V. stock [NASDAQ: NBIS] is trending down by -3.38%! Discover the key drivers behind this movement as well as our expert analysis in the detailed breakdown below.
Quick Financial Overview
Nebius Group N.V. (NBIS) trades like a classic momentum AI story stock, but its numbers tell a very different tale. Recent daily action shows a clear downtrend. NBIS has fallen from the mid‑$240s at the end of September to the low‑$170s by 2026/10/21. That’s a major haircut in just a few weeks, with violent swings both ways along the path down.
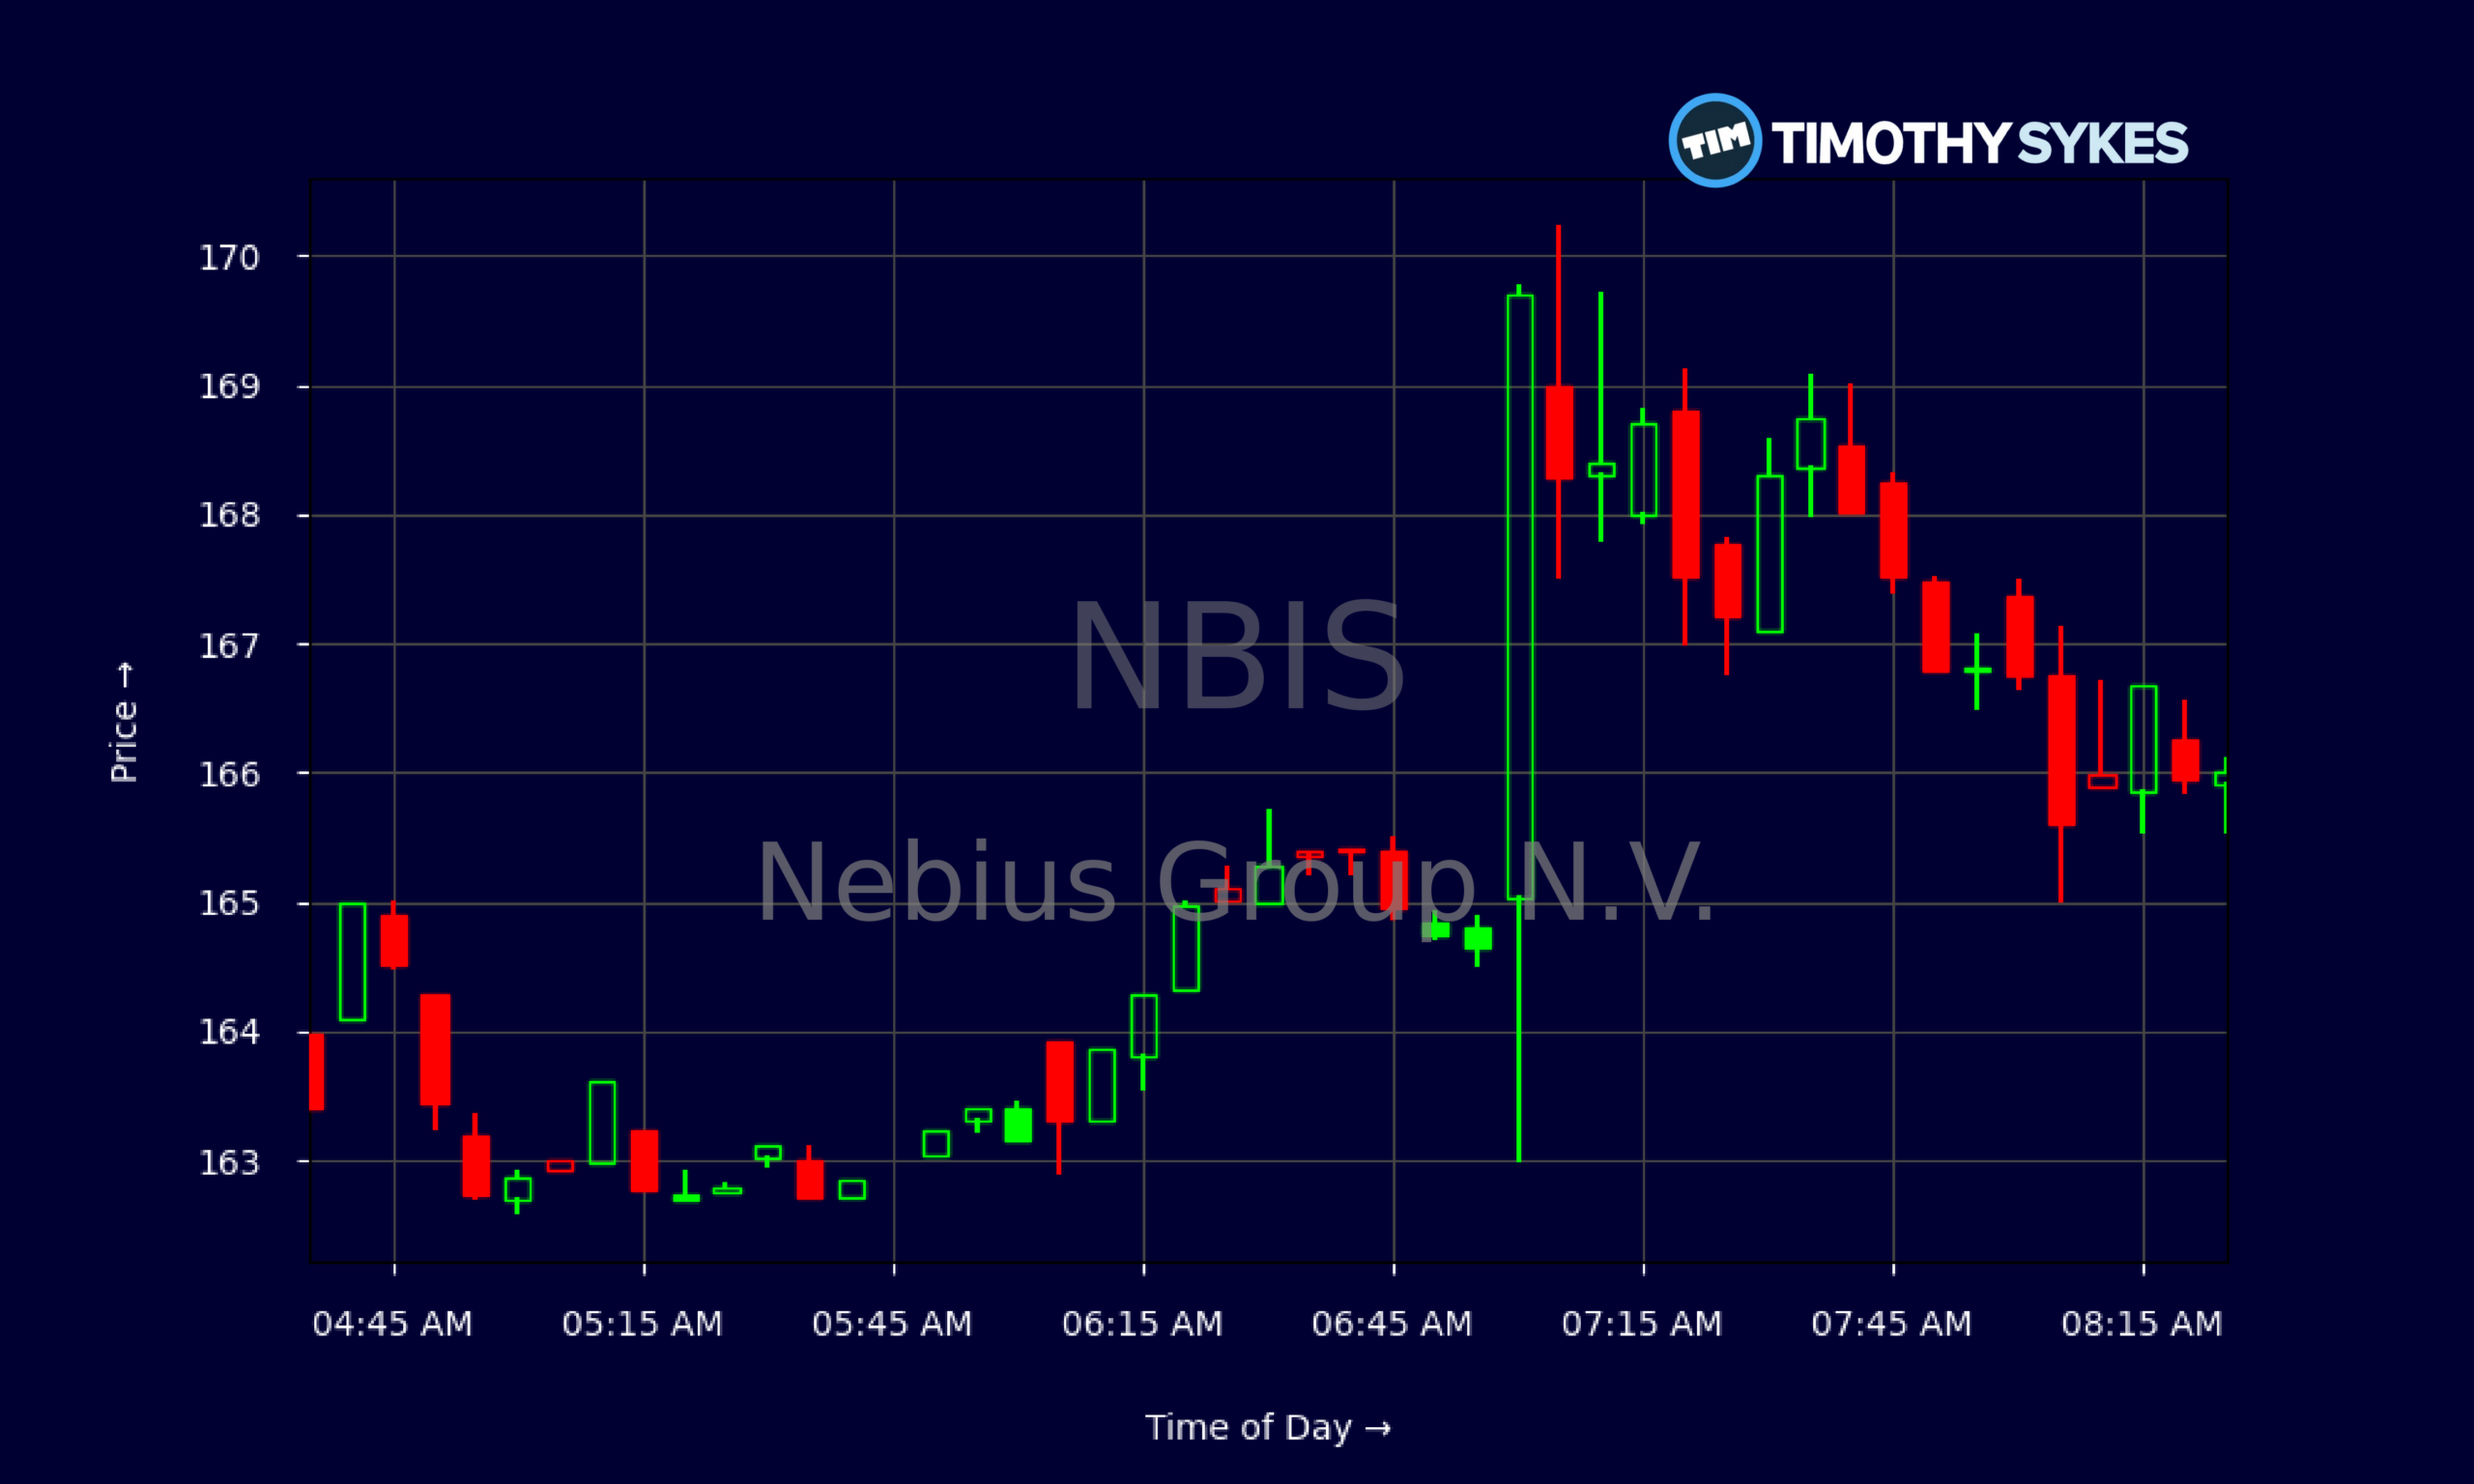
The intraday tape backs this up. On the latest premarket 5‑minute chart, NBIS chops mostly between $162 and $170, with quick spikes and fades but no strong follow‑through. That type of action says algos and short‑term traders are in control, not steady buyers.
More Breaking News
Fundamentals look stretched. Revenue is about $529.8M, yet the reported price‑to‑sales ratio is an extreme 9,546.51. The price‑to‑book on NBIS is over 1,100, even though return on assets is negative and pretax margins are around ‑1.7%. Nebius Group does have a solid cash pile of roughly $3.68B against $4.10B of long‑term debt, but leverage of 2.7 times and shrinking revenue trends mean the story is all about future AI growth. For traders, that disconnect between sky‑high valuation and weak profitability is exactly what fuels big moves both up and down.
Why Traders Are Watching NBIS Volatility
Traders are locked in on Nebius Group N.V. because the tape has turned into a real‑time lesson in momentum psychology. The news stream on NBIS over the past few weeks has been one hit after another. On 2026/10/13, Nebius Group was already down nearly 5% on Monday, then slid another 2.1% premarket, showing that dip‑buyers were getting steamrolled. The very next days, on 2026/10/14 and 2026/10/16, NBIS dropped 1.7% and 1.8% premarket after prior red sessions or shallow bounces, confirming persistent selling pressure.
That’s what a controlled bleed looks like. No single bombshell headline, just air leaking out as traders slowly give up. On 2026/10/15, Nebius Group was falling again pre‑bell after a double‑digit slide the day before, and still there was no specific catalyst. When a stock like NBIS sells off hard on “no news,” it usually means sentiment and technicals are driving the action, not fundamentals.
Then you have the memes. Nebius Group shows up repeatedly alongside other Wallstreetbets favorites. On 2026/10/19, NBIS joined a 1%–4% premarket rebound after sharp Friday losses across these names. That kind of snap‑back rally looks nice on a 1‑day chart, but by 2026/10/20 Nebius Group was back to being down roughly 4% premarket, giving back the entire move. Traders who chased NBIS strength got trapped quickly.
The wildcard is Michael Burry. He replaced his short in Nebius Group with June put options at double‑digit strikes, a classic leveraged bearish play against an AI‑driven valuation he sees as over‑hyped. For active traders, that’s a signal that some sophisticated money is positioning for more downside, or at least major volatility, in NBIS.
Conclusion
NBIS right now is a pure trading vehicle, not a comfort stock. The chart on Nebius Group N.V. shows a sharp multi‑week downtrend from the $240s into the $160s and $170s, with repeated premarket gaps lower. News flow confirms the pressure: back‑to‑back red sessions on 2026/10/13 and 2026/10/14, a double‑digit drop followed by more weakness on 2026/10/15, and a roughly 4% premarket slide on 2026/10/20 after a brief Wallstreetbets‑fueled bounce. Every time NBIS tries to rally, supply hits the tape.
Fundamentals do not offer much support. Nebius Group’s extreme price‑to‑sales and price‑to‑book ratios, combined with negative margins and soft returns on assets, mean traders are paying for a distant AI future that has not shown up in the income statement yet. That’s exactly the kind of setup contrarians like Burry target with options, and his June put position underscores how polarized sentiment around NBIS has become.
For short‑term traders, the lesson is to respect both the volatility and the downside trend. Spikes in NBIS can be tempting, but they have faded fast. As Tim Sykes loves to remind his community, “The market doesn’t care about your hopes, it only cares about price action. Trade the chart, not the story.” As millionaire penny stock trader and teacher Tim Sykes, says, “You must adapt to the market; the market will not adapt to you.”. For anyone studying Nebius Group, that quote fits the current tape perfectly. This coverage is strictly for educational and research purposes, and every trader should do their own work before making any trading decisions on NBIS.
This is stock news, not investment advice. Timothy Sykes News delivers real-time stock market news focused on key catalysts driving short-term price movements. Our content is tailored for active traders and investors seeking to capitalize on rapid price fluctuations, particularly in volatile sectors like penny stocks. Readers come to us for detailed coverage on earnings reports, mergers, FDA approvals, new contracts, and unusual trading volumes that can trigger significant short-term price action. Some users utilize our news to explain sudden stock movements, while others rely on it for diligent research into potential investment opportunities.
Dive deeper into the world of trading with Timothy Sykes, renowned for his expertise in penny stocks. Explore his top picks and discover the strategies that have propelled him to success with these articles:
- Penny Stocks Trading Guide
- Best Penny Stocks Under $1 to Buy Today
- Top 8 Penny Stocks to Watch on Robinhood
Once you’ve got some stocks on watch, elevate your trading game with StocksToTrade the ultimate platform for traders. With specialized tools for swing and day trading, StocksToTrade will guide you through the market’s twists and turns.
Dig into StocksToTrade’s watchlists here:




Leave a reply