

Asbury Automotive Group Inc stocks have been trading up by 12.74 percent amid strong earnings momentum and upbeat dealership performance
Key Takeaways
- Q3 2026 results and a conference call will put Asbury Automotive Group’s national footprint and long-term growth strategy under the microscope for active traders.
- Bank of America slashed its ABG price target to $234 from $275, trimming auto dealer Q3 EPS estimates roughly 5.9% on softer new-vehicle volumes and affordability pressure.
- UBS cut its ABG target to $193 from $250, flagging slower parts and service growth, higher SG&A, and rising floor plan interest costs after a roughly 27% post-Q2 slide.
- Street consensus on Asbury Automotive Group still sits at an average Hold with a mean target near $229.90, even after the latest cuts.
- Management will host a virtual Seaport meeting on 2026/10/30, adding another touchpoint for large shareholders and analysts around ABG’s outlook.
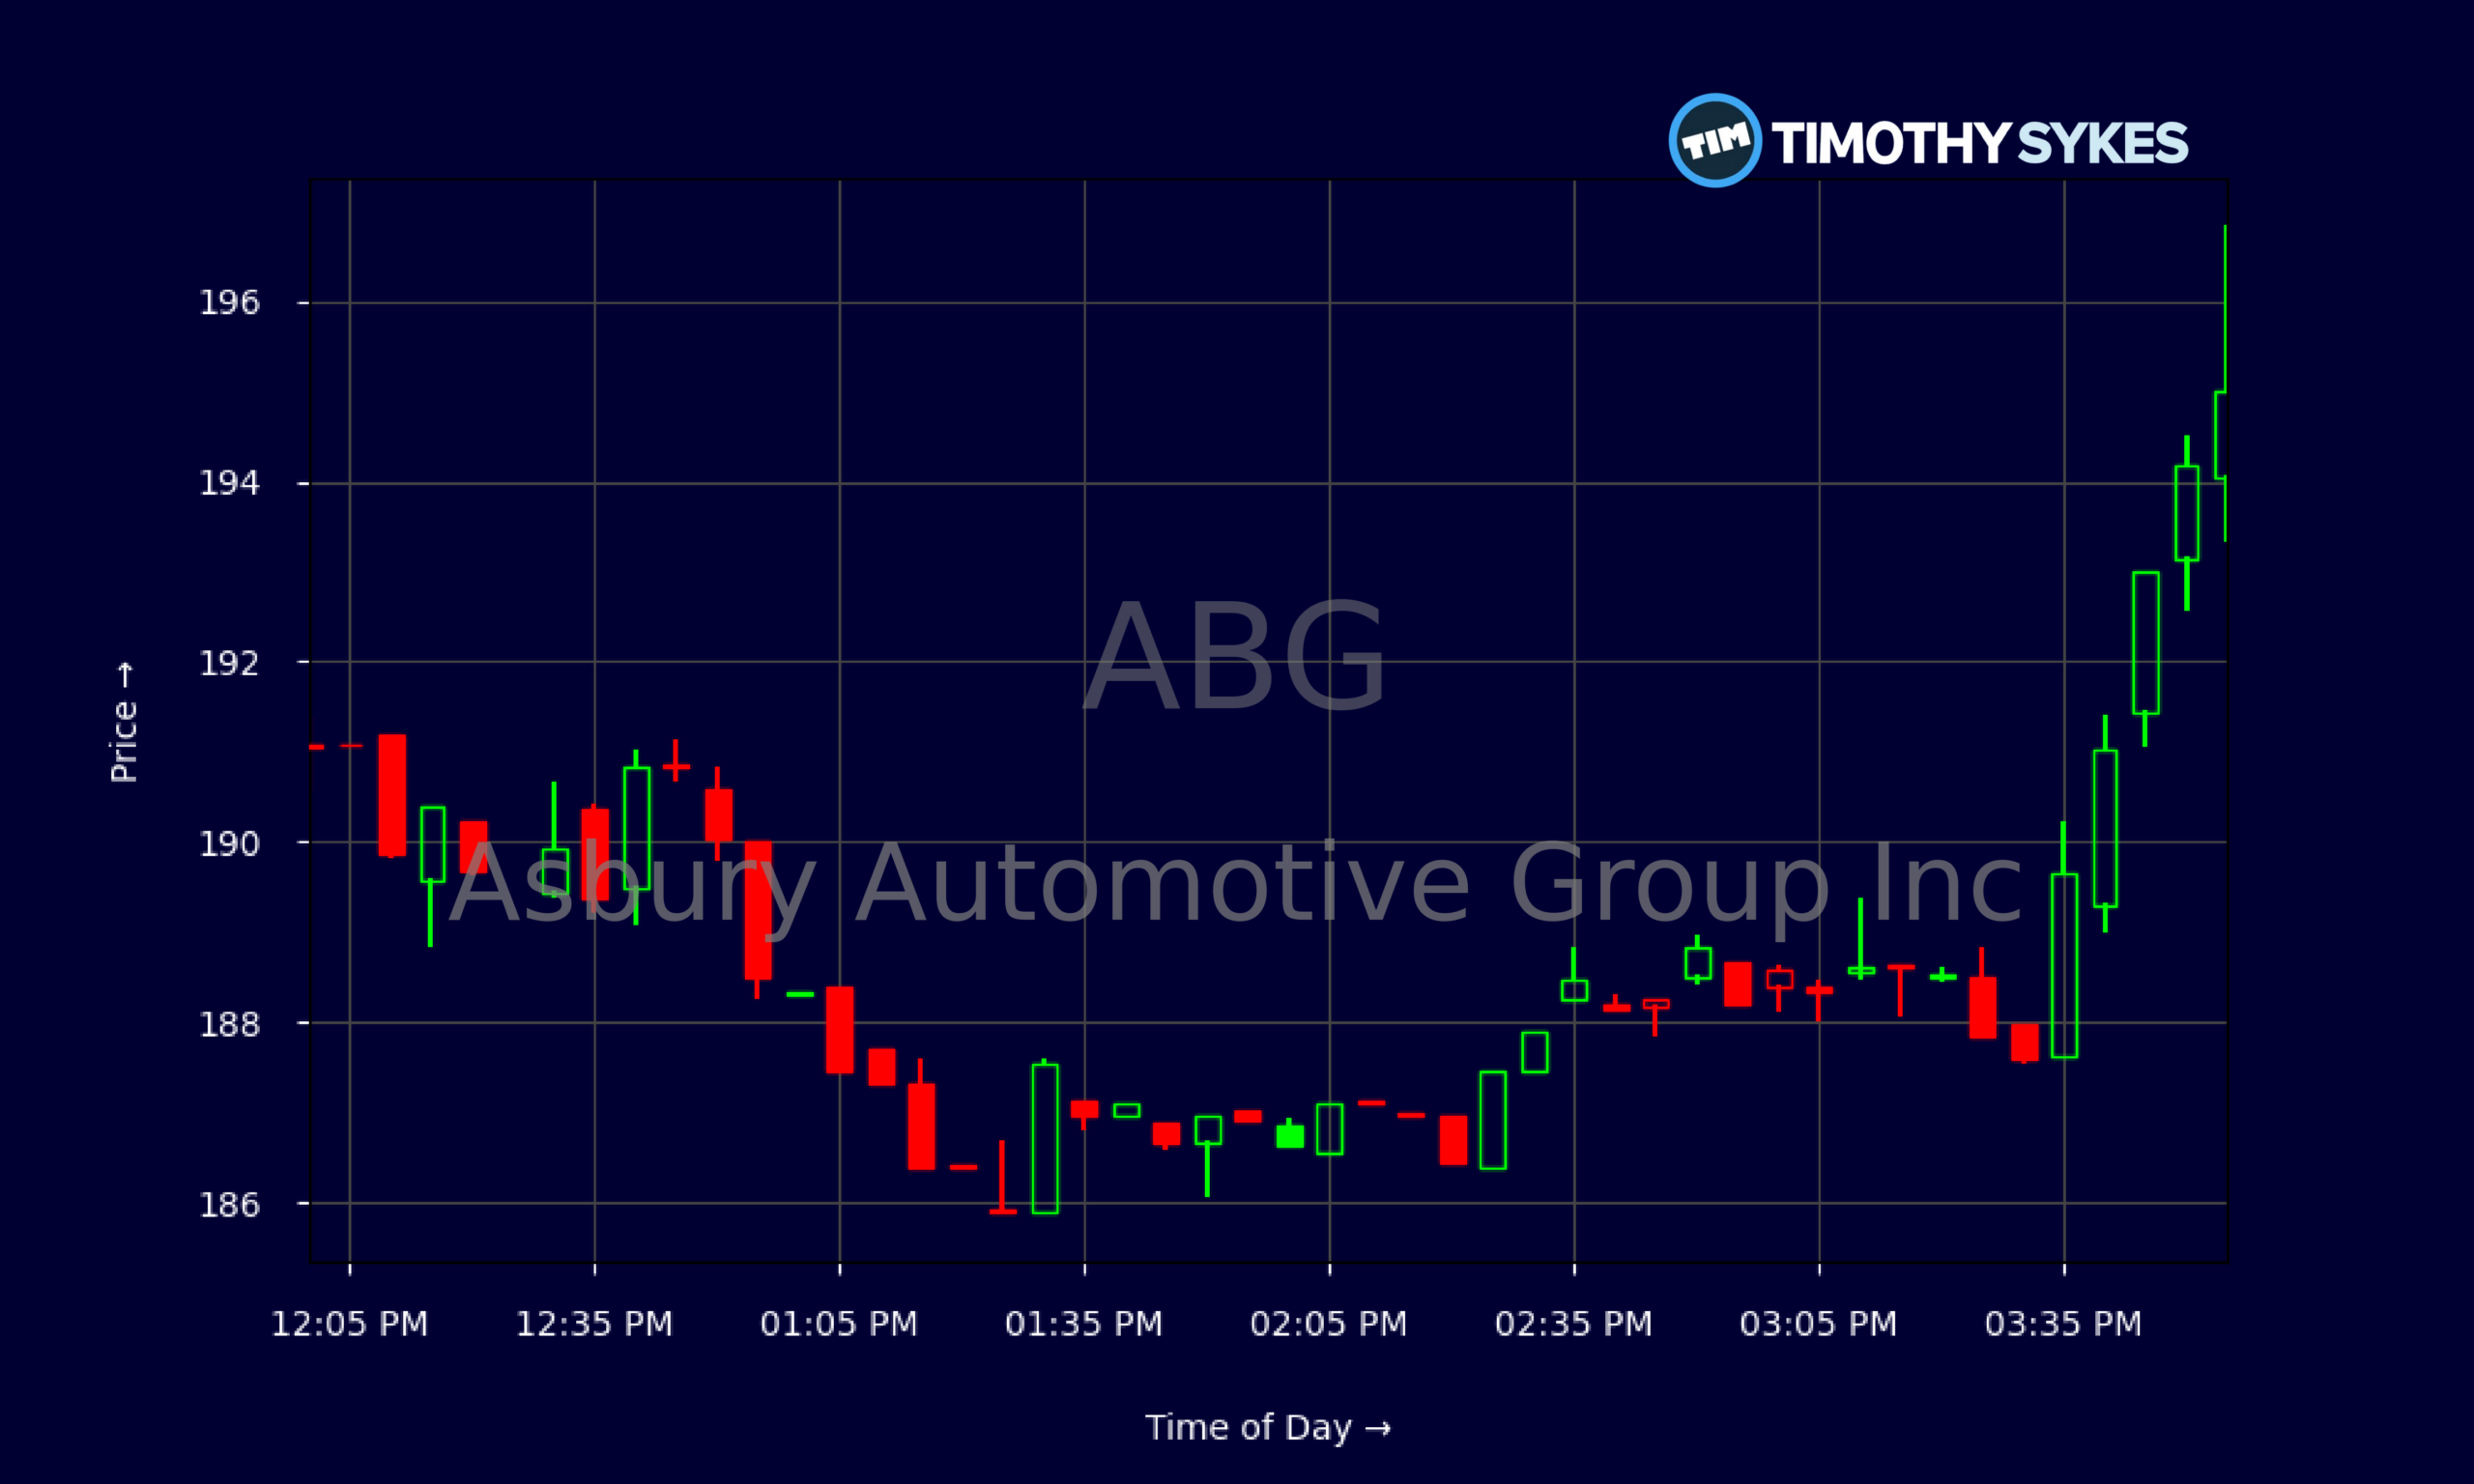
Live Update At 16:47:12 EDT: On Tuesday, October 27, 2026 Asbury Automotive Group Inc stock [NYSE: ABG] is trending up by 12.74%! Discover the key drivers behind this movement as well as our expert analysis in the detailed breakdown below.
Quick Financial Overview
ABG has been grinding higher on the chart. From 2026/10/02 to 2026/10/27, Asbury Automotive Group climbed from a close near $175 to about $195, with a wide intraday range on the latest session from roughly $173 to almost $197. That is a strong bounce after prior weakness and shows traders are willing to bid the name ahead of Q3 numbers.
Intraday action on the most recent day tells the same story. ABG opened with a sharp dip from the premarket print, then steadily marched from the high $170s into the mid‑$190s by the close. That kind of late‑day push often signals shorts covering or fresh momentum money stepping in.
Under the hood, ABG’s fundamentals look like a classic value-plus-cyclical mix. The price/earnings ratio around 6.26 and price-to-sales near 0.17 say the market is paying very little for $17.999B in annual revenue. Return on equity above 13% and solid asset turnover show Asbury Automotive Group still runs an efficient dealership platform.
More Breaking News
Debt is a real factor, with total debt-to-equity near 0.94 and a thin current ratio of 0.9. But ABG generates strong operating cash flow — about $129.4M last quarter and $80M in free cash flow — which gives it some breathing room. For traders, that backdrop creates a setup where sentiment and headlines, not survival risk, are driving the tape.
Why Traders Are Watching ABG Into Q3
ABG is sitting at the crossroads of macro fear and company‑specific execution. On one side, you have major banks cutting price targets on Asbury Automotive Group. On the other, you have a stock that already dropped roughly 27% after Q2 and has since started to claw back lost ground.
Bank of America took its ABG target down from $275 to $234, while keeping a Buy rating. The firm lowered Q3 EPS assumptions for auto dealers by about 5.9%, blaming softer new‑vehicle volumes and a simple truth every car buyer feels: affordability is stretched. That message hits the whole sector, not just Asbury Automotive Group, and tells traders to expect more conservative earnings numbers near term.
UBS went further on the micro story. It cut its ABG target from $250 to $193 and slapped on a Neutral rating, pointing to slower parts and service growth, higher SG&A as a share of gross profit, and rising floor plan interest costs. Those are margin headwinds inside the business, not just the macro fog. Yet UBS also acknowledged that the steep post‑Q2 drop in ABG likely prices in a lot of that pain.
This is why ABG is back on many watchlists. Street consensus still sits at an average Hold and a mean target near $229.90, comfortably above recent trading levels. At the same time, Asbury Automotive Group is leaning into its story: it has scheduled its Q3 2026 earnings release and conference call and is highlighting its large national footprint plus a multi‑year growth plan that has earned “growth and trustworthiness” accolades. Add a virtual Seaport meeting on 2026/10/30, and you have a management team actively trying to reset and clarify the narrative.
For active traders, that combination — beaten‑up chart, low valuation, target cuts, and looming catalysts — often produces sharp moves once new data hits the tape.
Conclusion
ABG is not trading on hype. It is trading on whether the numbers in the next few quarters can support a turnaround in sentiment. Asbury Automotive Group throws off real earnings — Q2 net income was about $114.6M on $4.3846B in revenue — but the Street is laser‑focused on what happens to margins as costs rise and demand cools.
Heading into the Q3 2026 release and conference call, the key questions for traders are straightforward. Does ABG show enough stability in parts, service, and used vehicles to offset pressure on new‑car affordability? Can Asbury Automotive Group demonstrate that SG&A and floor plan interest are under control? And does management’s multi‑year growth strategy still look realistic in a higher‑rate world?
The Seaport virtual meeting on 2026/10/30 gives ABG another chance to shape that message. If Asbury Automotive Group can convince the Street that the worst of the reset is behind it, you may see price targets stabilize and shorts rethink their stance.
For now, this is a textbook “plan the trade, trade the plan” situation. In the words of Tim Sykes, “The market doesn’t reward hope, it rewards preparation — study the catalysts, study the charts, and always be ready to cut losses fast.” As millionaire penny stock trader and teacher Tim Sykes says, “You must adapt to the market; the market will not adapt to you.”. ABG offers plenty of catalysts; it is up to each trader to manage risk accordingly. This article is for educational and research purposes only and is not investment advice.
This is stock news, not investment advice. Timothy Sykes News delivers real-time stock market news focused on key catalysts driving short-term price movements. Our content is tailored for active traders and investors seeking to capitalize on rapid price fluctuations, particularly in volatile sectors like penny stocks. Readers come to us for detailed coverage on earnings reports, mergers, FDA approvals, new contracts, and unusual trading volumes that can trigger significant short-term price action. Some users utilize our news to explain sudden stock movements, while others rely on it for diligent research into potential investment opportunities.
Dive deeper into the world of trading with Timothy Sykes, renowned for his expertise in penny stocks. Explore his top picks and discover the strategies that have propelled him to success with these articles:
- Penny Stocks Trading Guide
- Best Penny Stocks Under $1 to Buy Today
- Top 8 Penny Stocks to Watch on Robinhood
Once you’ve got some stocks on watch, elevate your trading game with StocksToTrade the ultimate platform for traders. With specialized tools for swing and day trading, StocksToTrade will guide you through the market’s twists and turns.
Dig into StocksToTrade’s watchlists here:





Leave a reply