

3 E Network Technology Group Ltd stocks have been trading up by 29.46 percent amid heightened investor optimism and positive sentiment.
Key Takeaways
- Recent trading shows MASK bouncing between $0.80 and $0.90, with clear support forming near the low $0.80s.
- Intraday action reveals MASK spiking above $1.10 before fading, signaling active day traders and fast momentum shifts.
- 3 E Network Technology Group Ltd trades at a low price-to-sales ratio around 0.63, suggesting the market is discounting the business heavily.
- MASK posts solid equity and working capital, with leverage manageable relative to total assets.
- Traders are tracking whether MASK can hold support and build toward a sustained move back over $0.90 and $1.00.
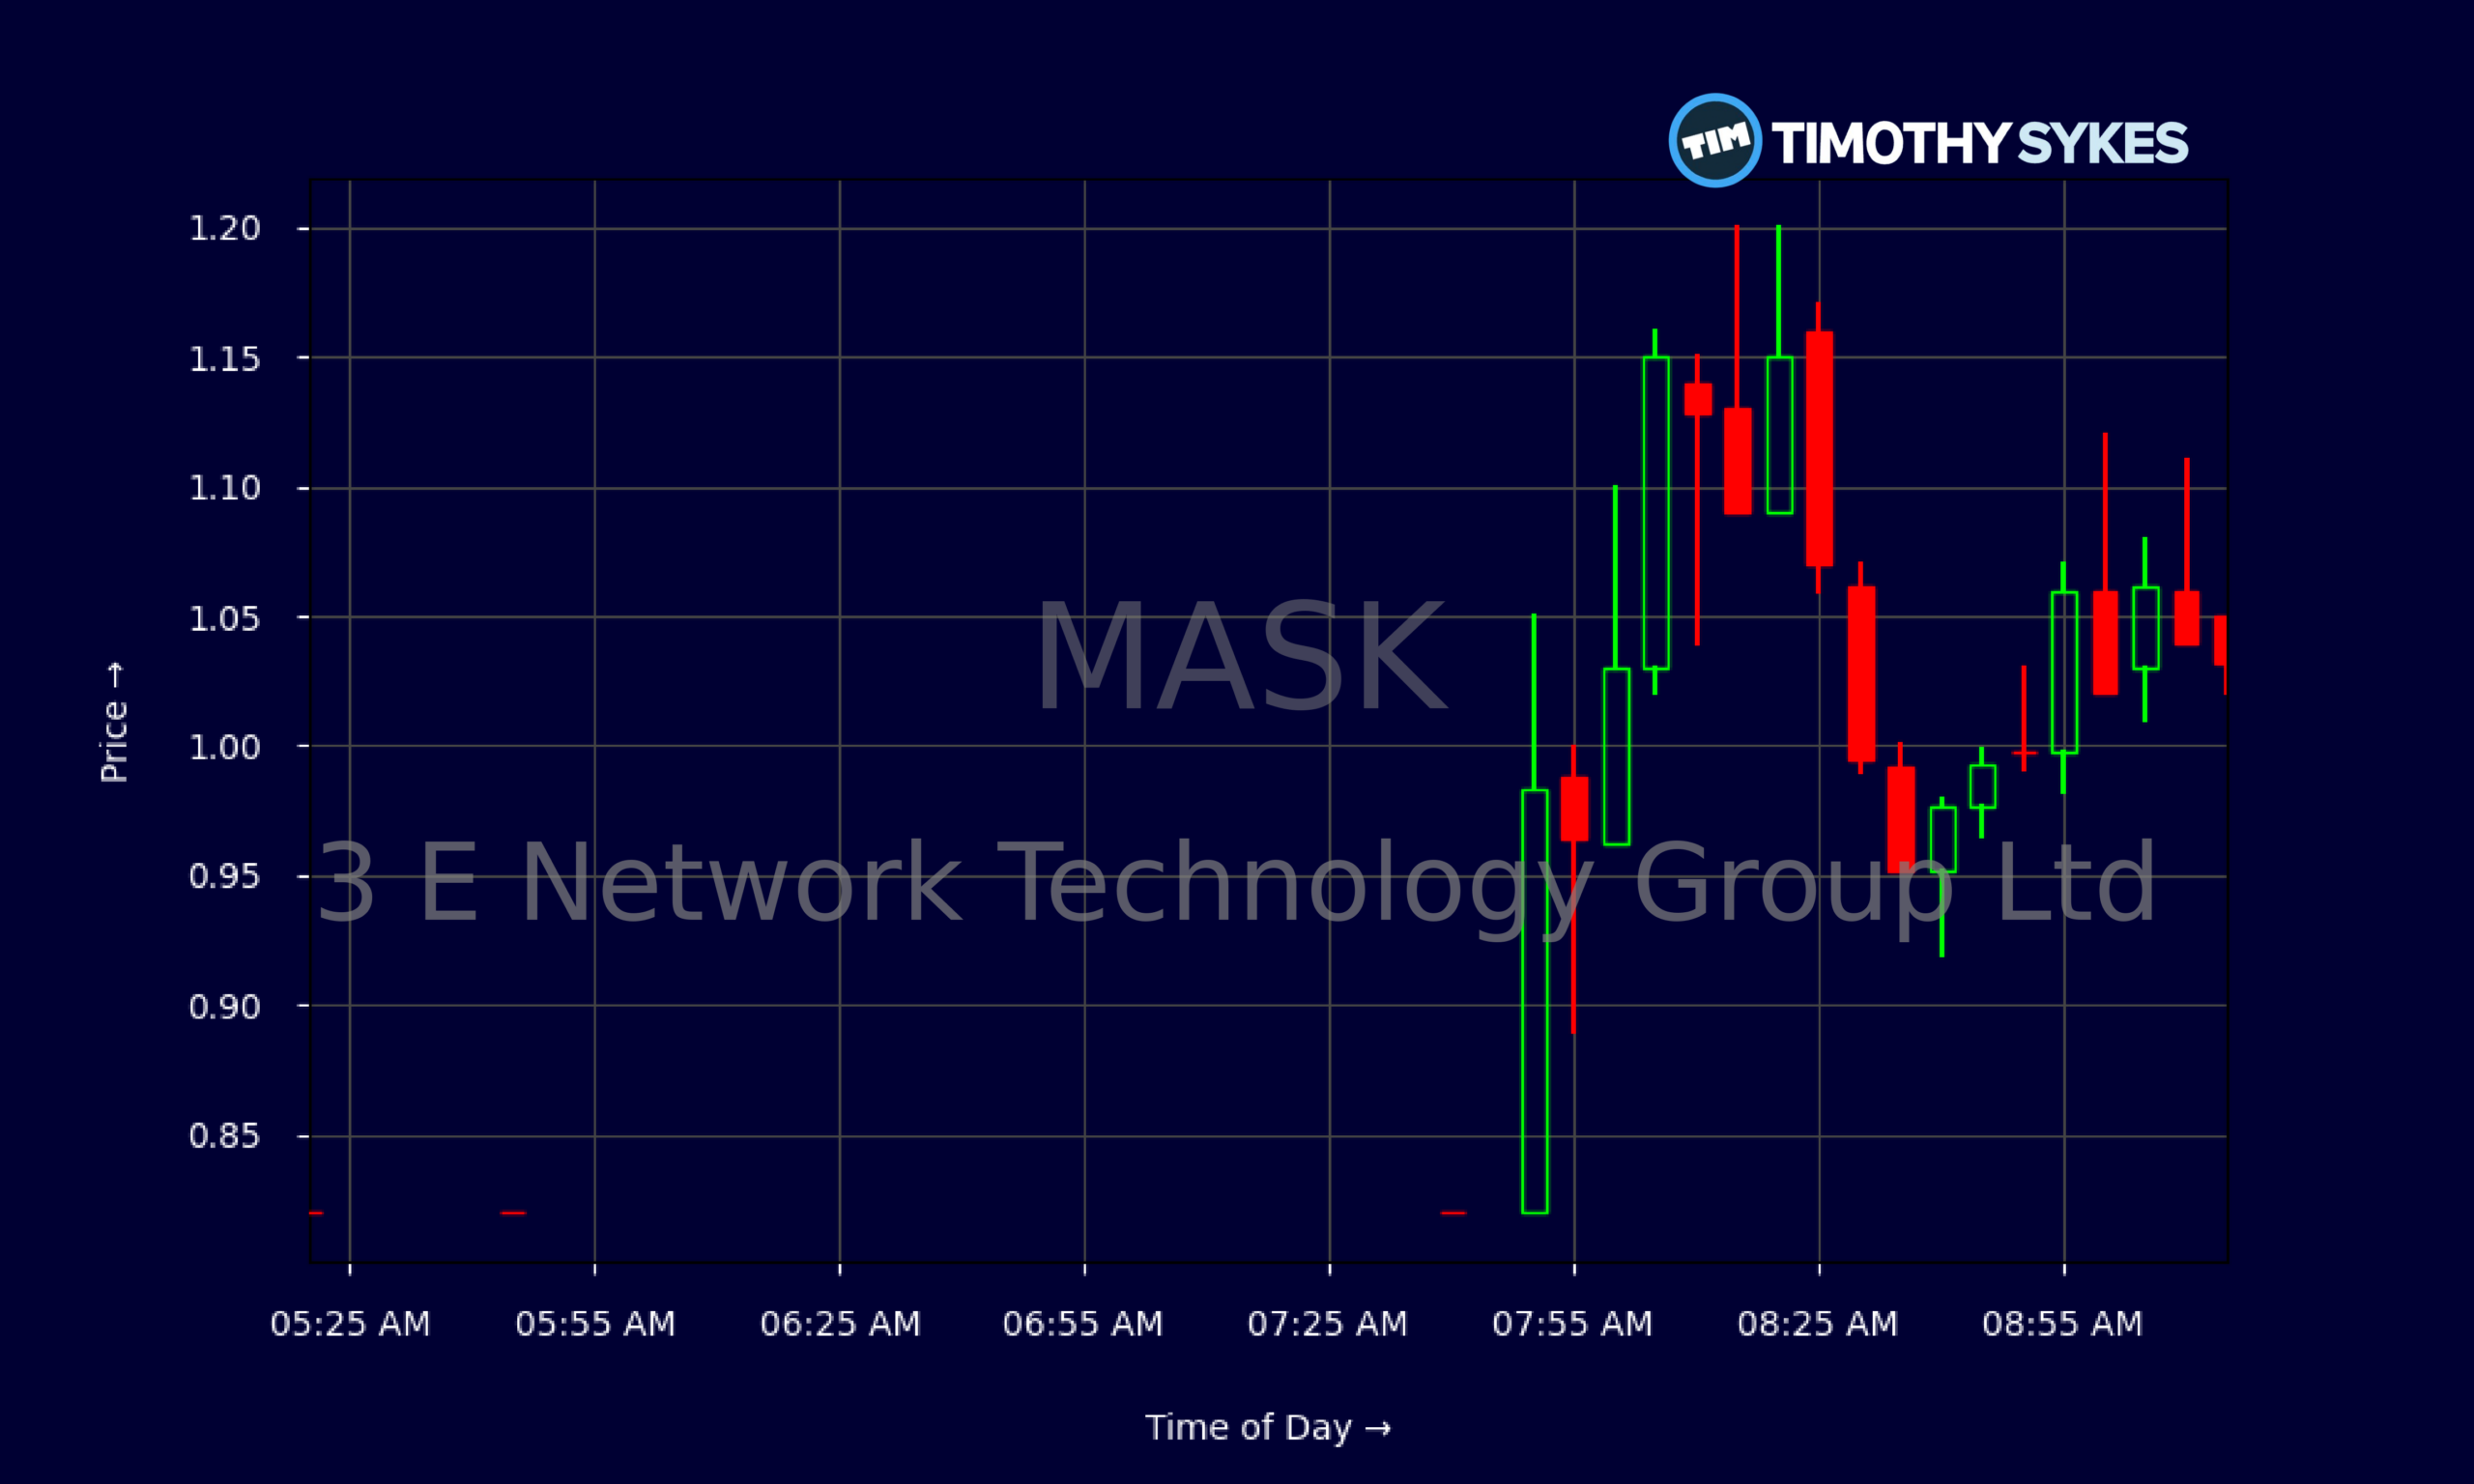
Live Update At 09:18:47 EDT: On Monday, October 19, 2026 3 E Network Technology Group Ltd stock [NASDAQ: MASK] is trending up by 29.46%! Discover the key drivers behind this movement as well as our expert analysis in the detailed breakdown below.
Quick Financial Overview
3 E Network Technology Group Ltd, trading under ticker MASK, is a tiny name by market standards but offers a surprisingly detailed balance sheet for traders to dissect. Revenue sits near $4.84M, which is modest, yet MASK carries an enterprise value of roughly $1.29M. That means the market prices the whole business at well under one year of sales, reflected in a price-to-sales ratio around 0.63.
Book value per share is about $1.48, while MASK trades below that level, implying the stock changes hands at roughly 0.57 times book. For traders, that screams “deep discount,” but discounts often show up when the market doubts future growth or earnings power.
More Breaking News
On the balance sheet, MASK shows total assets of about $9.36M and total liabilities of roughly $4.00M. Equity of around $5.35M gives the company a decent capital base, and long-term debt of $1.08M looks manageable. Working capital of about $4.27M and cash plus short-term investments close to $2.70M suggest 3 E Network Technology Group Ltd is not under immediate financial stress, which matters when you trade illiquid small caps.
Why Traders Are Watching MASK Price Action
MASK has been grinding in a defined range on the daily chart, and range-bound action can set up sharp moves when one side finally gives way. Over the past couple of weeks, 3 E Network Technology Group Ltd has printed closes mostly between $0.81 and $0.87. Sellers capped rallies near $0.90–$0.93, while buyers stepped in around the low $0.80s. That $0.80 zone is now a clear line in the sand for active traders.
Look at the intraday tape and the story gets more intense. MASK opened the session in the low $0.80s, then ripped quickly into the $1.10–$1.20 area in early trading. From there, 3 E Network Technology Group Ltd faded back toward $1.00–$1.05 as profit takers and short-term scalpers locked in gains. That type of spike-and-fade pattern is classic small-cap behavior when day traders pile in, liquidity thins out, and every tick becomes a battle.
For momentum traders, MASK now shows it can move 20–30% within minutes. That makes 3 E Network Technology Group Ltd attractive for those who thrive on volatility, but it also demands tight risk control. The daily chart suggests a clear strategy palette: dips toward $0.80–$0.82 attract dip-buyers, while pushes into $0.90–$0.95 or above $1.00 test overhead supply. The next big question is whether volume returns to push MASK through that $0.93–$1.00 band and convert resistance into support.
Conclusion
MASK sits at an interesting crossroads where the chart and the fundamentals tell slightly different stories. On one hand, 3 E Network Technology Group Ltd trades below book value, at a low price-to-sales multiple, and shows a balance sheet with more equity than debt and solid working capital. On the other hand, the market keeps MASK pinned under $1.00, signaling traders still want more proof that the company can turn assets and revenue into durable earnings.
For short-term players, the main focus is the price action, not the story. MASK has shown it can jump from the $0.80s into the $1.10–$1.20 range in a single session, which is exactly the type of volatility many small-cap traders hunt for. Levels are clear: support near $0.80, resistance in the $0.90–$0.93 zone and again near $1.10. Those who track 3 E Network Technology Group Ltd closely will monitor how price reacts each time those zones are tested.
As Tim Sykes often says, “The chart tells you the truth long before the company does.” That lines up with another core trading principle he teaches: patience and discipline. As millionaire penny stock trader and teacher Tim Sykes, says, “Small gains add up over time; focus on building wealth gradually, not chasing jackpots.”. With MASK, that means respecting the range, planning trades around defined risk, and reacting to what the stock actually does, not what anyone hopes it will do. This analysis is for educational and research purposes only, aimed at helping traders understand how to read a volatile small-cap like 3 E Network Technology Group Ltd.
This is stock news, not investment advice. Timothy Sykes News delivers real-time stock market news focused on key catalysts driving short-term price movements. Our content is tailored for active traders and investors seeking to capitalize on rapid price fluctuations, particularly in volatile sectors like penny stocks. Readers come to us for detailed coverage on earnings reports, mergers, FDA approvals, new contracts, and unusual trading volumes that can trigger significant short-term price action. Some users utilize our news to explain sudden stock movements, while others rely on it for diligent research into potential investment opportunities.
Dive deeper into the world of trading with Timothy Sykes, renowned for his expertise in penny stocks. Explore his top picks and discover the strategies that have propelled him to success with these articles:
- Penny Stocks Trading Guide
- Best Penny Stocks Under $1 to Buy Today
- Top 8 Penny Stocks to Watch on Robinhood
Once you’ve got some stocks on watch, elevate your trading game with StocksToTrade the ultimate platform for traders. With specialized tools for swing and day trading, StocksToTrade will guide you through the market’s twists and turns.
Dig into StocksToTrade’s watchlists here:





Leave a reply