
Stock analysis is often a definitive decision driver for any trader.
And top traders know to approach it from multiple angles. There are a few distinct, effective tips that can help you need to make informed, logical decisions in your stock analysis…
Examples: What are the best stock analysis websites? What are some stock market analysis techniques?
From there, you can get more specific. How do you analyze a stock? By its price or the company’s revenue? The latest press story?
There’s a lot to consider. Let’s take a look…
Table of Contents
- 1 What Is Stock Analysis?
- 2 How Do You Analyze a Stock?
- 3 How to Analyze Share Market Data
- 4 Top Stock Analysis Tools and Software
- 5 Types of Stock Analysis & Techniques
- 6 Technical Stock Analysis
- 7 Fundamental Stock Analysis
- 8 Forex Analysis
- 9 Sentiment Analysis
- 10 Common Stock Analysis Mistakes
- 11 Frequently Asked Questions About Stock Analysis
- 12 Conclusion
What Is Stock Analysis?
Stock analysis is exactly what it sounds like, and it’s important to note it’s a process. It’s the method traders use to assess historical and present data to attempt to forecast stock prices.
You can look at how a stock performs in relation to itself over time, industry changes, or entire market changes. You might even compare a stock, company, or currency (we’ll get to that later) with others in the same industry. That can help you better understand price action.
How Do You Analyze a Stock?

Here are some things I ask myself when deciding which stock to buy:
- Does the stock have a history of spiking? I want to trade former runners with a history of big spikes. That way I can get in and out of the trade quickly.
- What’s the news? I like to trade stocks with exciting news catalysts that bring in more buyers, pushing the volume and price up.
- What’s the pattern? The stock needs to have a pattern, like a first green day or a breakout. I like stocks with no resistance overhead.
- Is there volume? I need the stocks I trade to have higher-than-normal volume. If the company releases news, but there’s no reaction or volume in the stock, I’m not interested.
(Ready to get started with penny stocks? Check out my free Penny Stock 101 Guide. And there’s “The Complete Penny Stock Course.”My student Jamil put all my lessons in one easy-to-read book.)
A lot of day traders analyze market data using stock charts. Here’s why…
Stock charts give can you a visual representation of the past price action of the stock. When a big percent gainer pops up on my scanner, the first thing I do is look back at the chart.
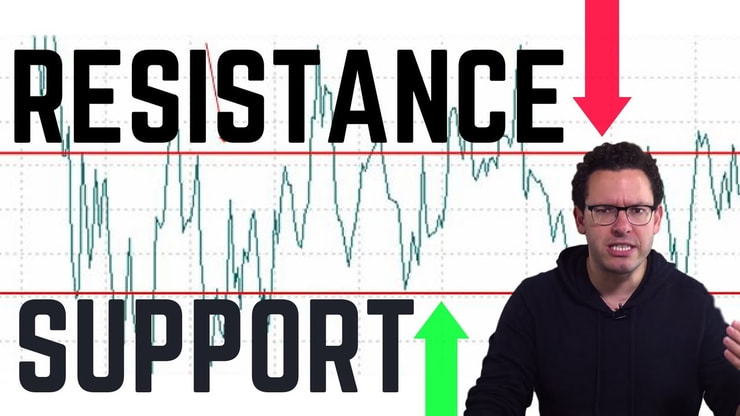
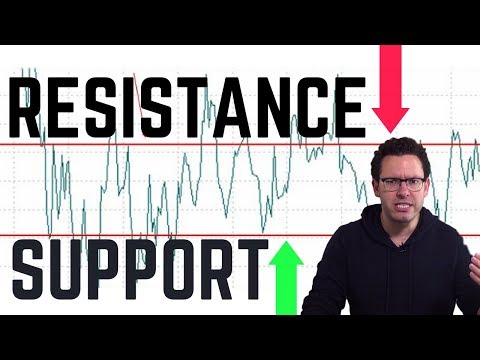
I’m looking at support and resistance levels, the previous volume traded, and whether there’s a pattern forming.
Then I can use this information to create a trading plan based on the past performance of the stock, the current news, and the volume.

Share price performance analysis is looking at the stock’s price action over a period of time.
If you’re thinking of holding a stock overnight, you’ll want to look back at the stock’s previous price performance. Does it have a history of gapping up the next day or does it usually fail?
If you understand how a stock has moved in the past, you can better prepare for how it might move in the current market.
Top Stock Analysis Tools and Software
The most important tool you’ll use for technical analysis is your charting software. Your broker will have a platform for you to start with, but try out others and see what you like.
I recommend StocksToTrade. I helped design it, so it’s made specifically for the low-priced volatile stocks I love to trade. It has amazing tools and built-in watchlists to help you find the best stocks to trade for your strategy.
(Full disclosure: I helped develop StocksToTrade and I’m a major investor. That said, it’s my dream stock-scanning tool. It’s designed to help save time in finding the best stocks that fit my patterns and strategy.)
Try it out with a 14-day trial for $7.

Types of Stock Analysis & Techniques
There are two basic and distinctly different types of stock analysis: technical and fundamental.
When using these two methods, you’ll wear different hats:
- Technical Analysis — This is where your ‘economist hat’ comes into play. It’s where the primary focus is on the stock action itself.
- Fundamental Analysis — You wear your ‘business hat’ when using this method. Here, the spotlight is on the inner workings of the business and how its performance affects the respective stock price.
Let’s stop for a minute on fundamental analysis. Before you can begin to understand the performance of a business, you need to know the basics of how business finance works.
Without fundamental knowledge, you won’t have a foothold on how to properly use the data.
For example, if you don’t understand concepts like operating income or financial statements, now is a good time to familiarize yourself.
Technical Stock Analysis
Technical analysis is where you can use historical data from stock prices to help you with future price forecasts.
Here are three important key metrics to consider when performing a technical stock analysis:
- Market Action. Also known as price action, this is all about the price movement specific to a particular stock.
- Price Trend. When the price moves as expected for some time, it tends to fall into an observable trend. It’s considered a trend until the price suddenly moves from the range of expectation, then it’s deemed a broken trend.
- Patterns. Stock patterns fall under the adage that ‘history repeats itself.’ Some analysts track the patterns of stocks as far back as 100 years. And yes, the data is still relevant today. You have to study the past to trade smarter.
Example of Technical Analysis of a Stock
How can you better gauge potential price action using technical analysis?
Check out this example…
We’ll call a hypothetical stock XYZ. Let’s say XYZ is sitting at $50 per share and increases by $3 per share every quarter … Except it takes a dip of $1.50 per share during the fourth quarter each year. It’s been this way for the past four years.
With this data, a trader might estimate that they can potentially make $9 per share for the first three quarters of the year and lose that $1.50 per share by the fourth quarter. They’ll be ahead $7.50 by the end of the year if they hold onto that stock. Hypothetically, of course.
Fundamental Stock Analysis

Here’s where you’ll don your ‘business hat.’
More Breaking News
- Morgan Stanley’s Bold Moves Boost Cipher Mining’s Prospects
- $30M Boost: Xinhui Solar Expands Jiuzi Holdings’ Reach in Southeast Asia
- Bitcoin Crash Sparks Sharp Decline in Cryptocurrency Stocks
- Huntington Bancshares Faces Earnings Miss, Market Considers Impacts
What Is Stock Fundamental Analysis?
This type of analysis involves looking at a business’s financial health and its effect on stock prices.
It uses key performance indicators such as cash flow trends, income statements, balance sheets, and the U.S. Securities and Exchange Commission (SEC) filings.
How Do You Do Fundamental Analysis of a Stock?
Fundamental analysis of a stock means you’ll dive deep into the company’s inner workings. It involves a lot of research into the companies past and current performance.
Financial statements provide insight and information into how the company is performing. Publicly traded companies typically provide information for shareholders on their websites and with the SEC.
Other sources you should seek out include media articles, blog posts, and company press releases. Is this business a few months away from releasing a new product into the market? Is there media buzz about it? Did they record profits last quarter, or did profits dive?
SEC Filings can be long and difficult to understand for a new trader or investor. Check out my DVD “ Read SEC Filings” to help you read and analyze SEC filings. (It can be a bit boring, but the information is crucial. Try to stay awake!)
Other points to analyze include…
P/E Ratio
P/E ratio means the price-to-earnings ratio. It compares the company’s stock price relative to its earnings per share.
One important measurement is the earnings per share (EPS). You can calculate the EPS by dividing a company’s profits by the number of common outstanding shares. Read more about EPS here.
Another parameter is earnings growth, which measures the growth of a company’s profits over time.

PEG Ratio
Finally, you have what’s called a price/earnings to growth ratio (PEG). This is the price-to-earnings divided by the growth rate of a company’s earnings over time.
PEG = PE Ratio ÷ Earnings Growth Rate
Book Value
A company’s book value is the amount the company is worth if it were to be liquidated. If the company sold all its assets and paid off its debts, what’s left is the book value.
Return on Equity
Return on equity (ROE) is the company’s return on net assets. Here’s the calculation:
Net Income ÷ Shareholder Equity
The resulting number is a percentage that shows how well the company is using its assets to generate profits. An ROE of around 15% is considered good.
Example of Fundamental Analysis of a Stock
Penny stocks don’t always have a lot of fundamentals. They’re small, developing companies and they usually need money.
They use press releases and promoters to get their stock price up so they can sell more shares into the hype and pocket the money. That’s why I always warn traders never to believe the hype or get married to a company.
The best way to “fundamentally” (I use that term loosely) analyze a penny stock before you trade it is to check the SEC filings for outstanding warrants or shelf offerings.


Forex Analysis
Forex (foreign exchange market, often abbreviated FX) is specific to the trading of each of the world’s currencies based on their buying and selling prices. So you can guess that forex analysis is used to determine trends based on just that.
Currencies on the forex market are traded in pairs, and certain currency pairs are more commonly traded than others. When performing a forex analysis, you can use both technical AND fundamental analyses.
For more information on forex trading, check out this post.

An Example of Forex Analysis
Let’s take the currency pair of both U.S. and Canadian dollars (US/CAD). Here, you’re looking at worldwide economic and political factors that might affect the supply and demand of an asset. Then, you’re analyzing how that might affect a currency pair.
For example, did “X” country just elect a new president? What’s the worldwide perception of this new president?
To gain another perspective on what’s really happening here, you can take a look at the economies of the two countries. You can also cross-reference this data with the economy of other countries not included in this pair.
Finally, don’t forget the sentiment analysis aspect…
Sentiment Analysis
Sentiment analysis examines the psychological state of others in the market. After all, let’s not forget that the market is made up of humans who have opinions, perceptions, fears, etc. I’ve stated before that market sentiment matters to short-term traders.
Common Stock Analysis Mistakes

There are a few common mistakes people make when it comes to stock analysis.
- Analysis paralysis. You do all the research and study the charts … but when it comes time to place the trade, you freeze and can’t execute. Only to see the stock do exactly what you thought.
- Narrow focus. This when a trader becomes obsessed with tiny price fluctuations. If your trading plan was based on technical analysis, try to remember the big picture of your idea. And remember, this isn’t an exact science. Just because you see support at a certain level, that doesn’t mean the stock won’t dip slightly below and come back.
- Cutting losses. Some traders have a hard time accepting that they’re wrong. If you’ve done your research and you’ve studied the charts, and you still end up being wrong — that’s OK. Cut your losses and move on.
If you find yourself making these mistakes, don’t be too hard on yourself. It takes time to learn this stuff. Learning to trust the process is a HUGE part of it.
Frequently Asked Questions About Stock Analysis
What Are Some Stock Research Tools?
Some popular stock research tools include trading and scanning platforms like StocksToTrade, financial news sites, financial statements, SEC filings, and earnings reports.
Should You Avoid Stock Advice From Promoters?
While it’s possible to use promoters’ actions to your trading advantage, you must be wary and prepared. Never buy into the hype. Definitely don’t hold and hope. Think of stock promoters as nothing more than stock marketers or salespeople.
What Is the Best Stock Analysis Website?
There are plenty of free stock analysis websites to help you find information. If you want to research a company’s fundamentals, search the company's website and the SEC website. Be sure to check several well-known, reputable sources for the validity of any news. It’s always best to do your own due diligence.
How Can I Learn Stock Analysis?
The best way to learn stock analysis is to STUDY. Find a mentor who can help you learn the markets and how to become a self-sufficient trader. Make sure they’re transparent and show every trade. I teach and trade the patterns I’ve learned from my 20+ years in the market.


Why You Should Consider Applying for My Trading Challenge
It takes a lot of discipline and hard work to educate yourself and be an informed trader. But you can potentially speed up that process by joining forces with my Trading Challenge students.
We’re always sharing tips, strategies, and advice that could better equip you for trading consistently. You can watch weekly live trading and Q&A webinars directly from me, and learn the strategies my top students used to carve their own paths in the markets.
Apply to my Trading Challenge today … Maybe you could become my next top student.
Conclusion

You might need to wear a few different ‘hats’ to perform stock analysis. But the important thing is to not lose sight of what you’re trying to do: figure out where the stock price might go next.
You can get wrapped up in the data from both the technical and fundamental sides. Don’t get too bogged down. Keep the big picture in mind. And remember that each piece of data should complement the other and hone into your overall goal and trading plan.
Whether it’s fundamental, technical, or sentiment analysis, you’re using those methods to help drive your decisions. Your ultimate goal is to help ensure that your decisions remain logical and calculated at all times.
Which type of stock analysis do you use? Let me know in the comments … I love to hear from you!

Leave a reply