
The 7-Step Pennystocking Framework: Key Takeaways
- What you can learn TODAY about bubble market psychology (observed for hundreds of years) and predictable price action…
- The original 7-step framework was based on a decade of observation. See how it still plays out a decade later…
- Learn the 7 steps by studying the charts in this post.
- PLUS: 5 tips for trading the pennystocking framework. (And a bonus “Top Tip” EVERY trader should know…)
Go Deep With “Pennystocking Framework Part Deux”
When I introduced the 7-step penny stocking framework in 2011, some people called it a marketing gimmick. It’s NOT. It was my attempt to simplify things based on a decade of observation. And it still plays out today.
Frankly, I didn’t expect it to last this long. I thought if enough traders knew about it, the pattern would stop working.
But it still works because the rationale behind the price action is still there. Thanks to greed, hype, and manipulation — the 7-step pennystocking framework just keeps giving.
Table of Contents
What Is the 7-Step Pennystocking Framework?
The pennystocking framework is an overarching pattern. You could think of it as a pattern of patterns.
It’s not an exact science, but once you understand what’s happening, you’ll see it again and again.
Learn the framework, but don’t just memorize the patterns. Try to understand the rationale behind them. That way you can adapt to shifting markets. And the key to long-term success is adapting.
Remember this chart well, its the basis for my 7-step framework, @30DayBoot & @completepenny & you must study not to fall prey to greed/ignorance or you'll get wrecked like 90% of traders. It's VITAL to sell into excessive strength/hype, do not just hold & hope like most newbies pic.twitter.com/QsAGHsI6lp
— Timothy Sykes (@timothysykes) February 28, 2021
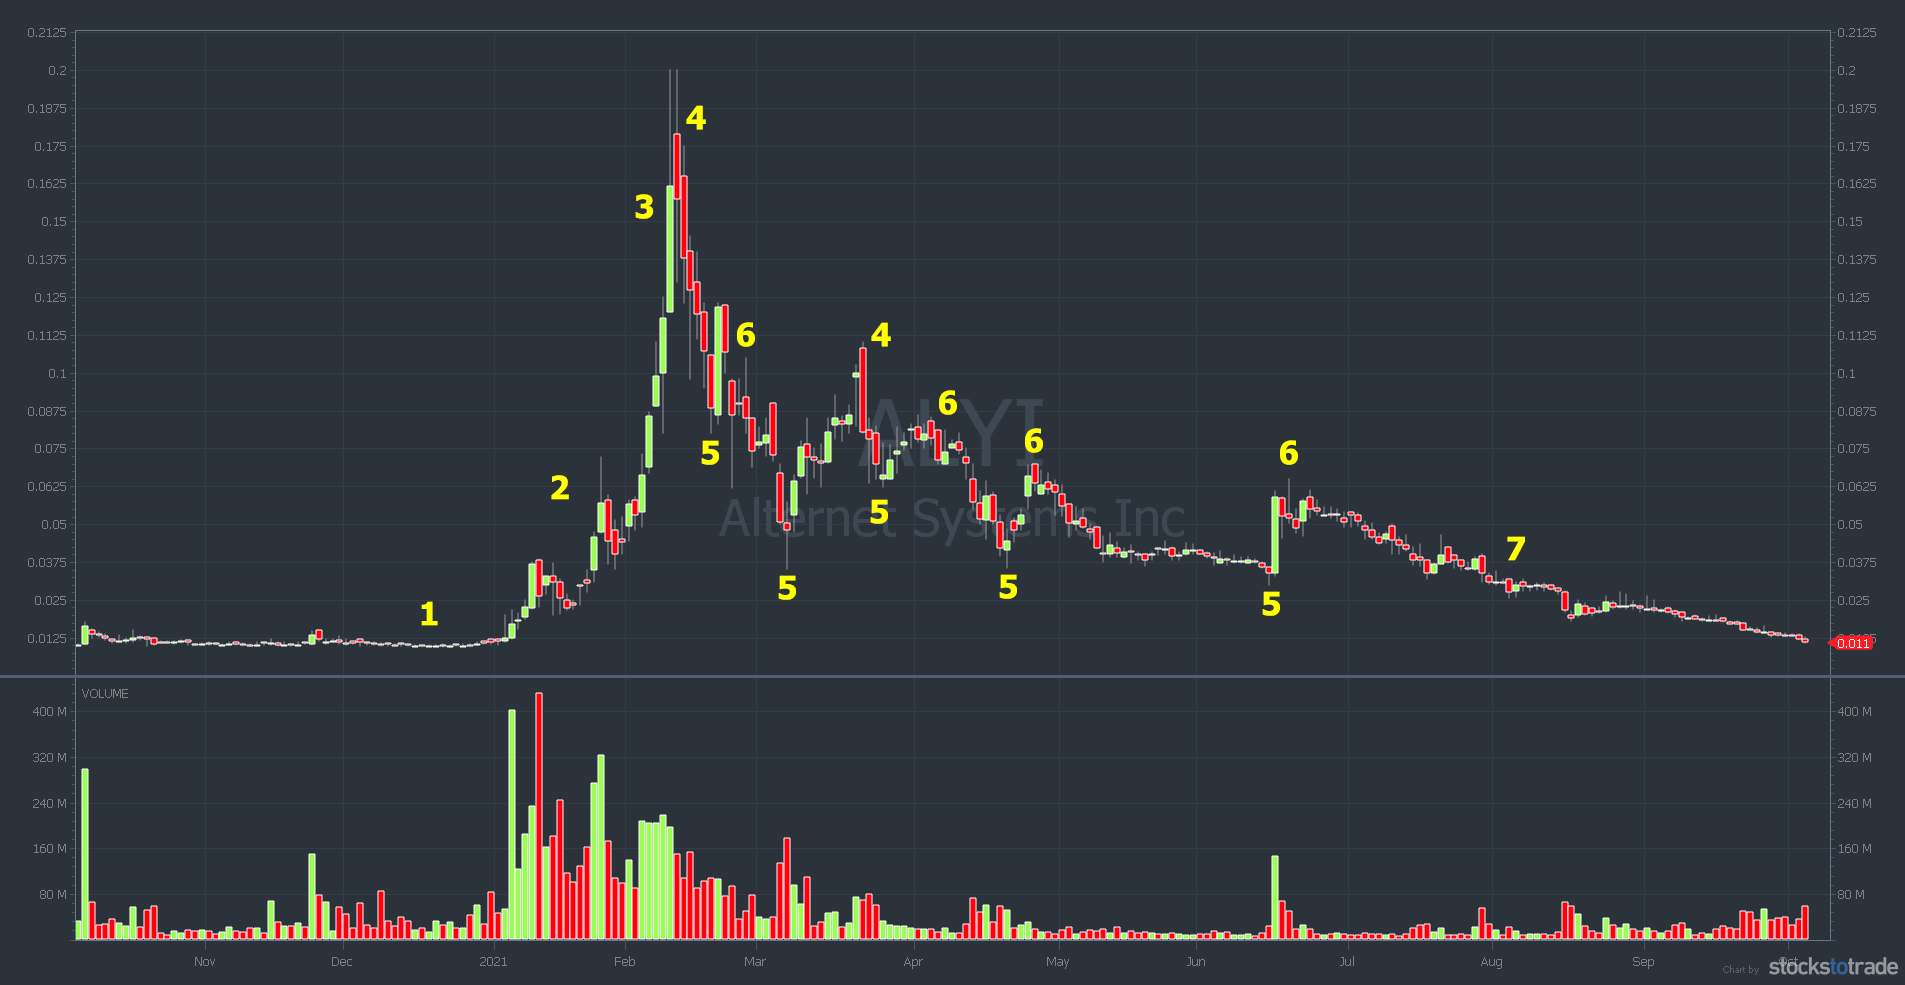
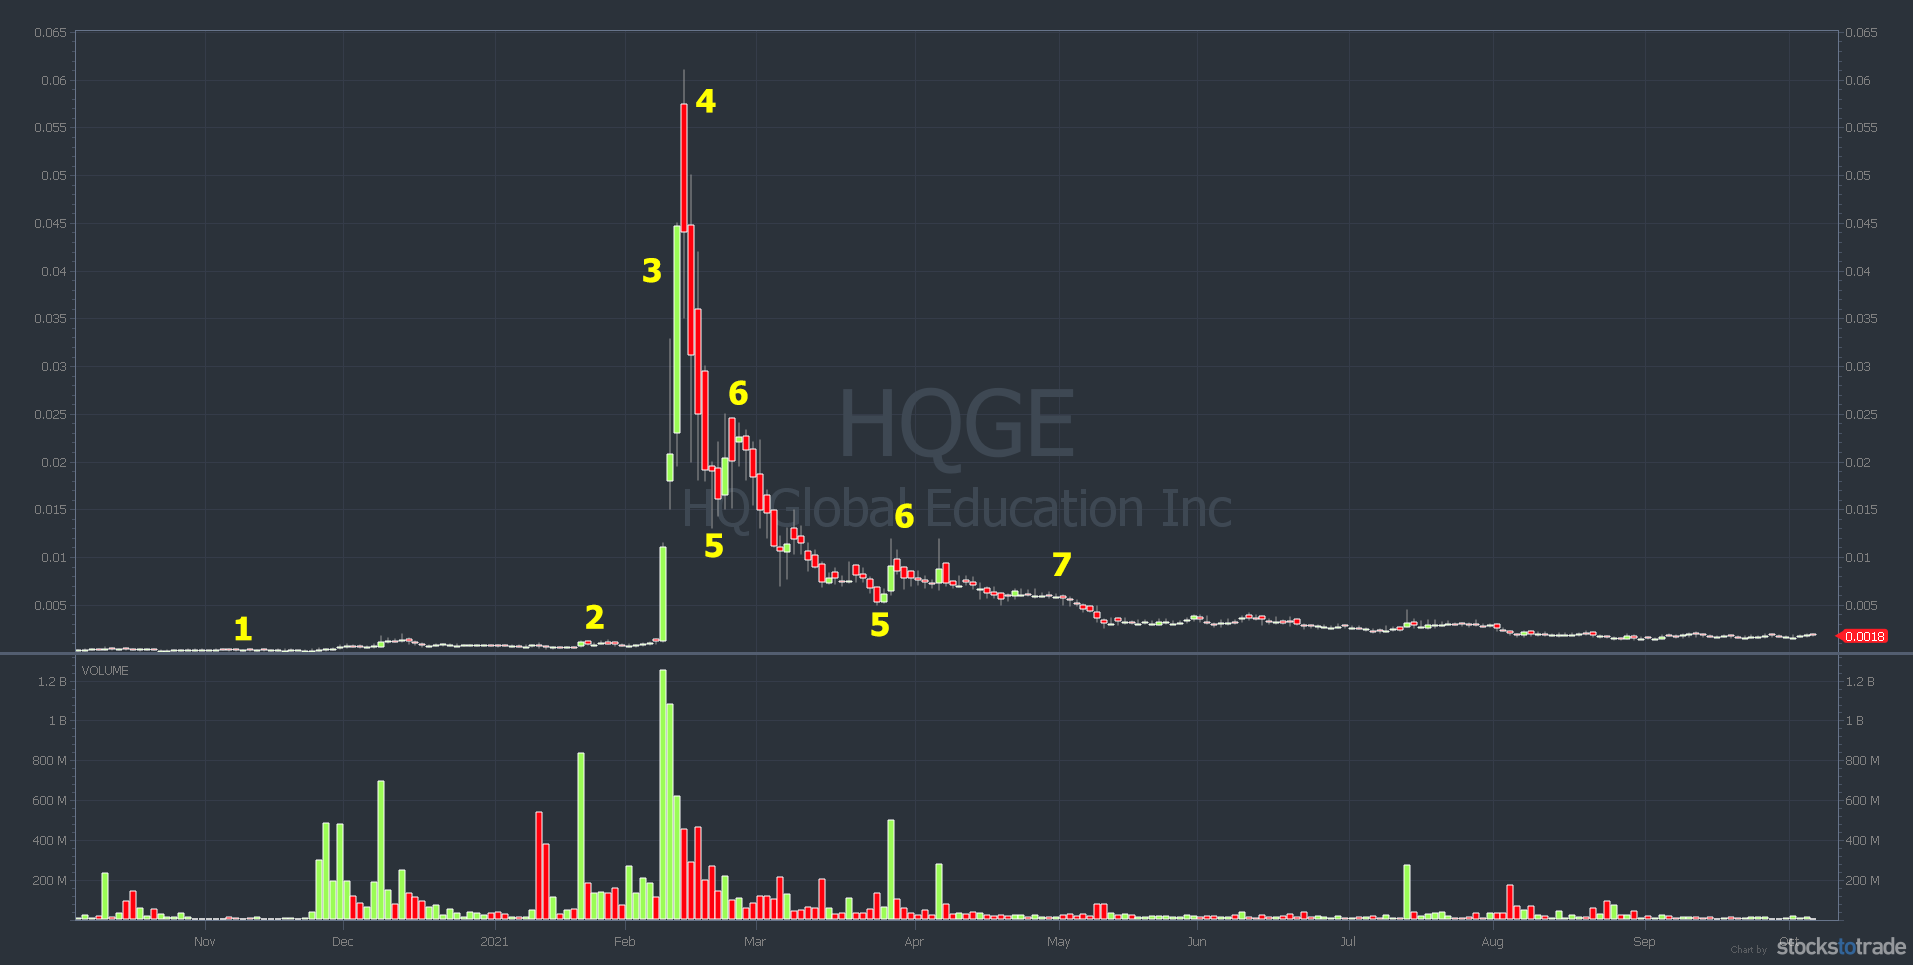
This post covers the basics of the 7-step pennystocking framework. I’ve included charts with several variations. Notice that in some of the charts, numbers repeat. Or, if the overall pattern hasn’t played out, numbers might be missing.
It’s not an exact science, so focus on the similarities. Let’s do this…
Step #1: The Pre-Pump or Promotion

At step #1, you can make big gains, but it takes time. The goal is to predict the huge spike ahead of time, regardless of the reason. This step is best for patient people with small accounts.
That said, it’s difficult to guess on plays like this. It’s tough without experience. Especially since the old-school email and mailer promotions pretty much died.
Jack Kellogg played the #1 with marijuana stocks in early 2021. He witnessed the sector run in 2017 and 2018. His thesis was that if Biden won the election, weed stocks would spike. In early January, he bought a group of weed stocks. Then, he waited.
Jack has spent years studying the 7-step pennystocking framework. He’s arguably the best student of the framework I’ve ever had. He crushed it in February after holding some of the stocks for nearly a month. Keep reading for a review of one of Jack’s trades.
Step #2: Ramp

In step #2, the run-up speeds up. There’s consolidation in anticipation of a breakout. Ideally, there’s sideways action and then a technical breakout. There’s often increased volume and more hype.
Back in the day, the hype came on message boards and emails. These days, it’s done by Twitter pumps and in chat rooms.
Students ask me how I know where the hype comes from. My go-to source is StocksToTrade Breaking News Chat. It saves me a ton of time. Use it.
Tip: Promoters use dozens, if not hundreds, of bot accounts on social media. Ride the hype, but don’t believe the BS. You’ve been warned.
When a stock is ramping, it’s possible to buy and hold for a few days or weeks. But again, you’re basically guessing that the promotion will work.
Step #3: Supernova
This is how I made my first $1 million back in 1999 and 2000. And to be honest, I didn’t understand what was happening. I just recognized the pattern and rode the wave. I bought the breakouts.
This is the most rewarding time to be long. But it’s also the riskiest. You MUST be aware that the higher a supernova goes, the more overextended it gets. Be very cautious with buying overextended stocks.
It all comes down to experience and practice. When you’re wrong (and you will be sometimes) always follow rule #1: cut losses quickly.
How long do you hold a supernova? That depends on a lot of things. Is the big move happening in one day? Or is it over multiple days? How many days has the stock been green? You have to consider many factors.
I recommend learning the first green day pattern. But also learn to use the seven indicators of the Sykes Sliding Scale. And be willing to adapt.
Remember, supernovas can flip on a dime.
Step #4: Cliff Dive
You know the old adage … What goes up must come down.
The 7-step pennystocking framework came from observing price action on penny stock pumps. Back in the day, once a promotion stopped, the bottom fell out. Stocks sometimes dropped 50% or more in a day.
Fast-forward to today. Stock promoters might not use the same tools, but they still pump stocks. And when the promotion stops, the bottom still falls out. A small decline near the top turns into a full-on collapse.
This is the best time to short sell promotions. But it’s also usually the most difficult time to find shares to short. Why? When a stock goes from 50 cents to $5 over a few days, short sellers start circling like vultures. Especially if it’s based on promotion and hype.
We’ve seen many sub-penny plays go full supernova recently. So they might get up to 10, 20, or even 50 cents a share.
So before we get to step #5, there are two MAJOR caveats…
First, I think shorting is a flawed strategy right now. There are too many overaggressive newbie shorts in the market. It’s a risky strategy in a crowded space.
Second, I’d NEVER short an ultra-low-priced play. Even when I was short biased, I rarely shorted anything below $1. There had to be a good reason and/or proof of a pump.
But that’s OK because I’ve learned to adapt by playing…
Step #5: Dip Buy
The panic dip buy is my favorite pattern for small accounts. For me, this is the best time to buy a promoted stock. There’s still momentum and interest. The promoters tell their followers to hold, but a lot of newbies set hard stop-loss orders. When the stop losses get taken out, it becomes a self-fulfilling prophecy.
Often there’s a solid bounce for one or more of these reasons, depending on the stock’s price…
- Dip buyers are waiting for the turn.
- Short sellers buy to cover. Again, no big-time short seller is gonna short sub-penny stocks. Most won’t touch anything below 50 cents a share. The risk is too high.
- Promoters try to create a soft landing so they don’t get investigated.
A stock can run 50% or more in a few hours or days. Sometimes the bounce happens in under an hour.
That means preparation is key.
How should you prepare? Learn to read Level 2 and use technical analysis. My DVD, “Learn Level 2” is a great place to start.
Tip: Reading Level 2 on listed stocks isn’t as straightforward as OTCs. With listed stocks, it’s more about technical analysis and reading the chart.

Again, sometimes the panic bounces, and sometimes it doesn’t. Don’t get stubborn. When in doubt, follow rule #1 and get out.
Be aware that the market ebbs and flows. Sometimes bounces work well. Other times, there are fakeouts and outright failures. Learn to avoid these three common mistakes when dip buying too early.
Remember, you MUST adapt.
Step #6: The Dead Pump Bounce
When I was short biased, this was my favorite time to short. Again, when a stock goes supernova, short sellers want to short it. But that’s risky because you have no idea how high it can go.
Once the stock has had a cliff dive and a bounce, short selling can be a little more predictable. That said, there’s not as much range. So while it’s easier to find shares to short, you’re not as likely to get a big percent win.
Also … we’ve seen plays with two or more big spikes recently. Sometimes the bounces go right back to highs. Sometimes there’s no bounce at all.
Bounce or not, the next step is…
Step #7: The Long Kiss Goodnight

Penny stock pumps don’t end with the company changing the world with its amazing product. They’re all junk. And that’s why step #7 happens. It’s a gradual decline over days, weeks, or months.
Look at the chart above. OPTI bounced several times. Like a bouncing ball, it eventually lost momentum.
Top Tips for the 7-Step Pennystocking Framework
Hopefully, you see the similarities and understand the numbers on the charts above. Study these charts. Again, it’s not an exact science.
The overall pattern has variations, but the outcome is the same. So what can you do to better prepare for the opportunities as they play out?
Tip #1: Watch and React
You don’t know if there are greater odds of bouncing or failing. All you can do is watch and react. Never guess. When in doubt, get out.
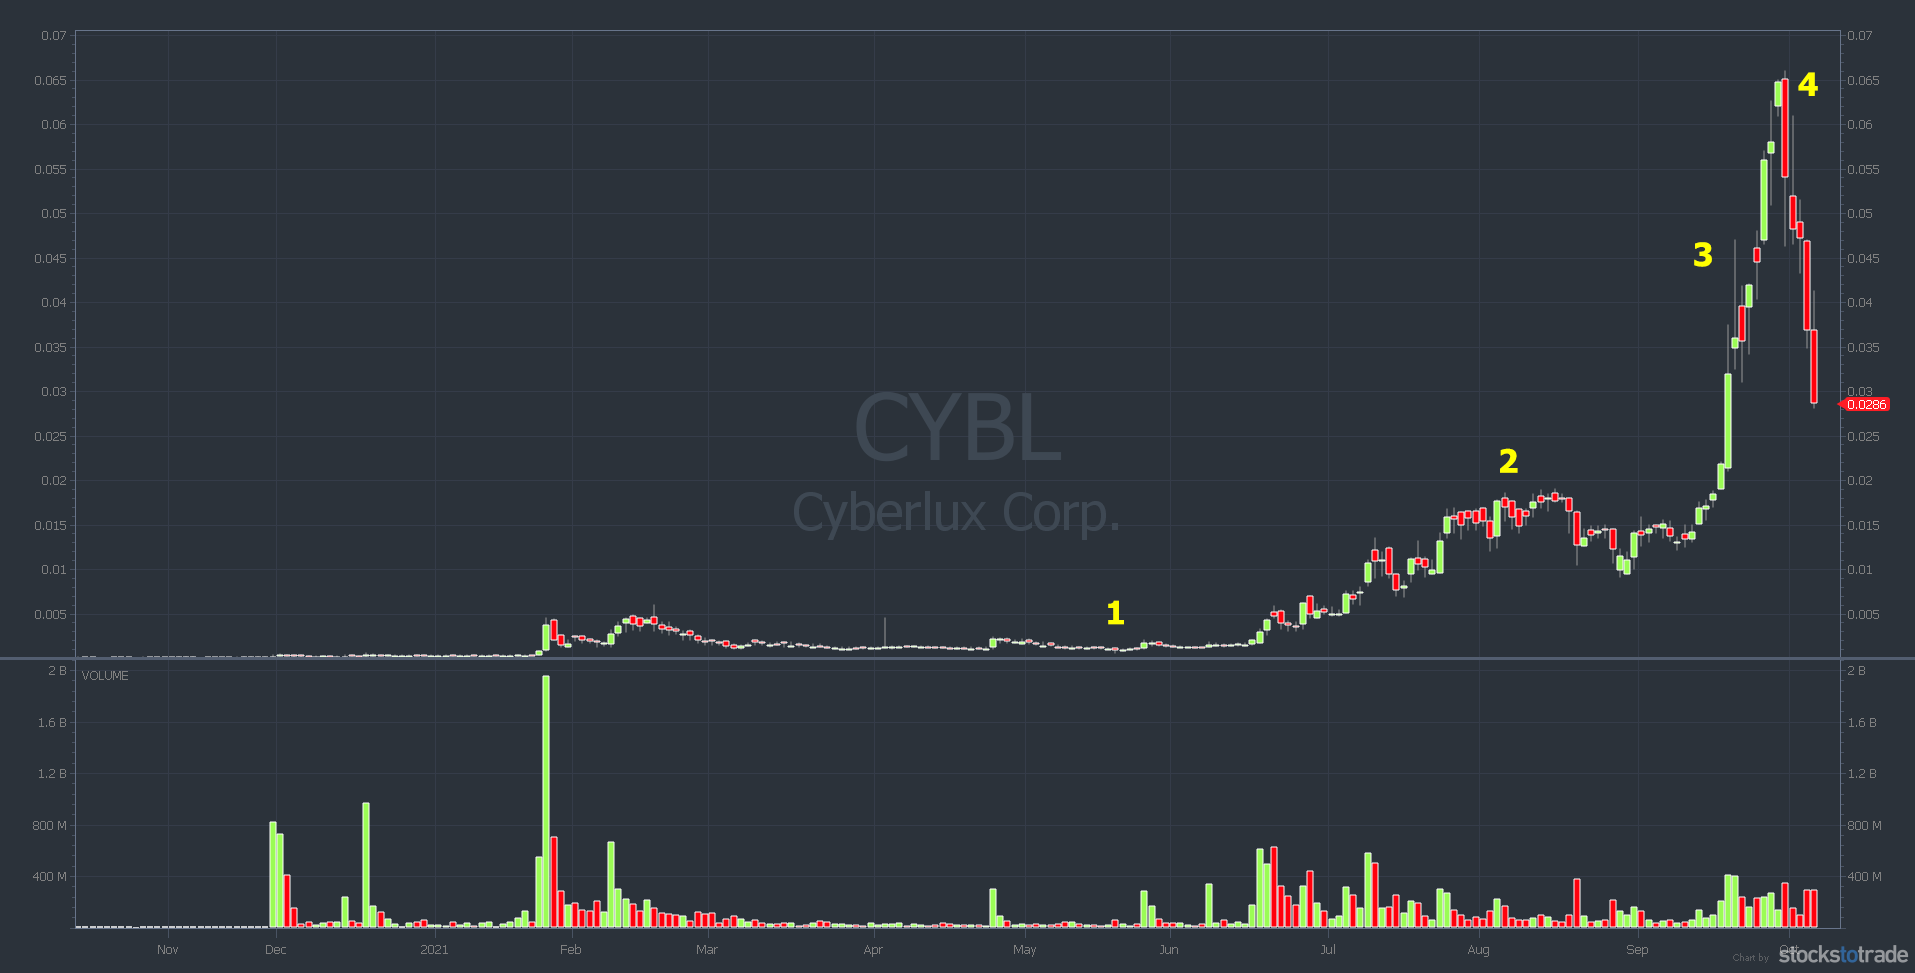
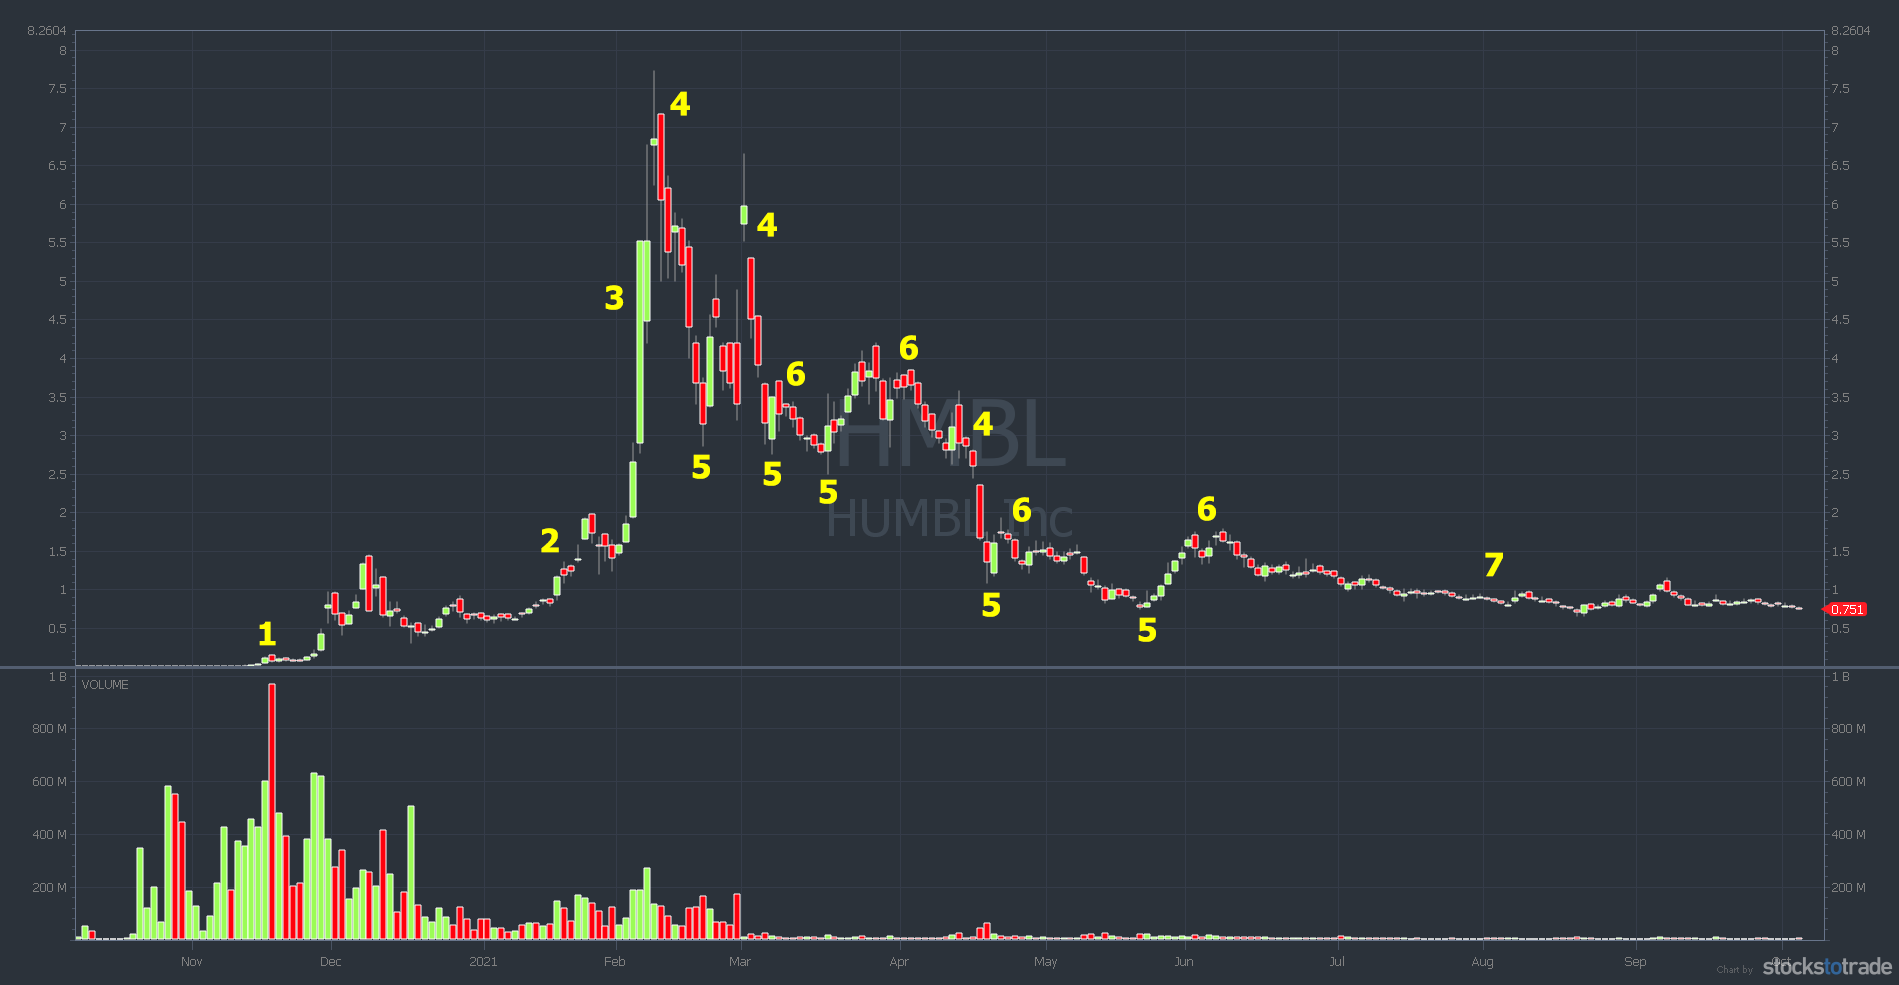
Tip #2: Former Runners Can Run Again
Be aware of former runners.
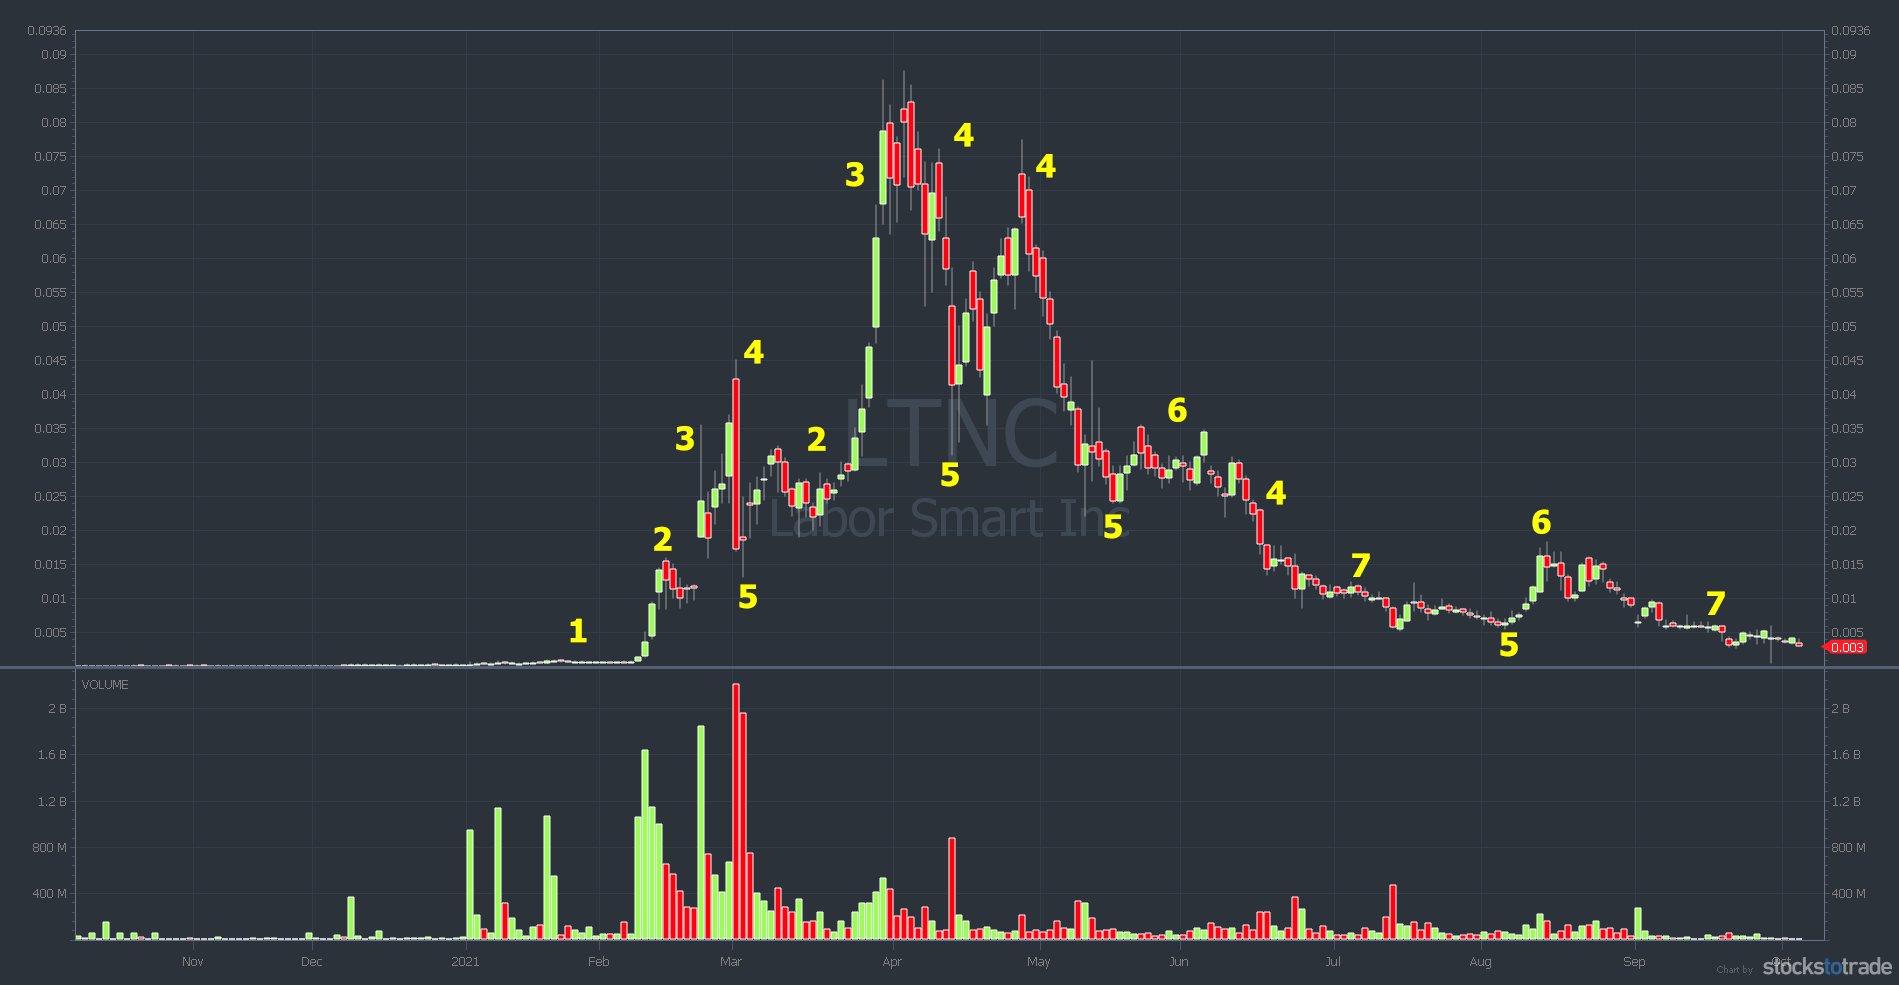
Once a stock runs once, it can run again with the right news and volume. The ENZC and HMBL charts above are good examples. Some stocks have a #3 and #4, only to spike even higher for another #3. The LTNC chart above is a good example.
Tip #3: Beware of Bag Holders
A company that has been around a while and has gone supernova has bag holders. These traders believed the hype, bought at a stupidly high price, and refused to cut losses. They’ll try to sell into any big spike just to recover losses.
So be aware that former supernovas rarely go as high the next time around.
Tip #4: Understand Basic Technical Analysis
Every time a stock breaks a new low or high, it shows up on some trader’s screen. It doesn’t matter if it’s daily, monthly, or yearly. Traders scan for highs and lows. Be aware of the highs and lows in multiple time frames. Learn more about technical analysis here.
Tip #5: The 7-Step Pennystocking Framework Happens in Multiple Time Frames
As strange as it sounds, the pennystocking framework can play out in a day. Check it out…
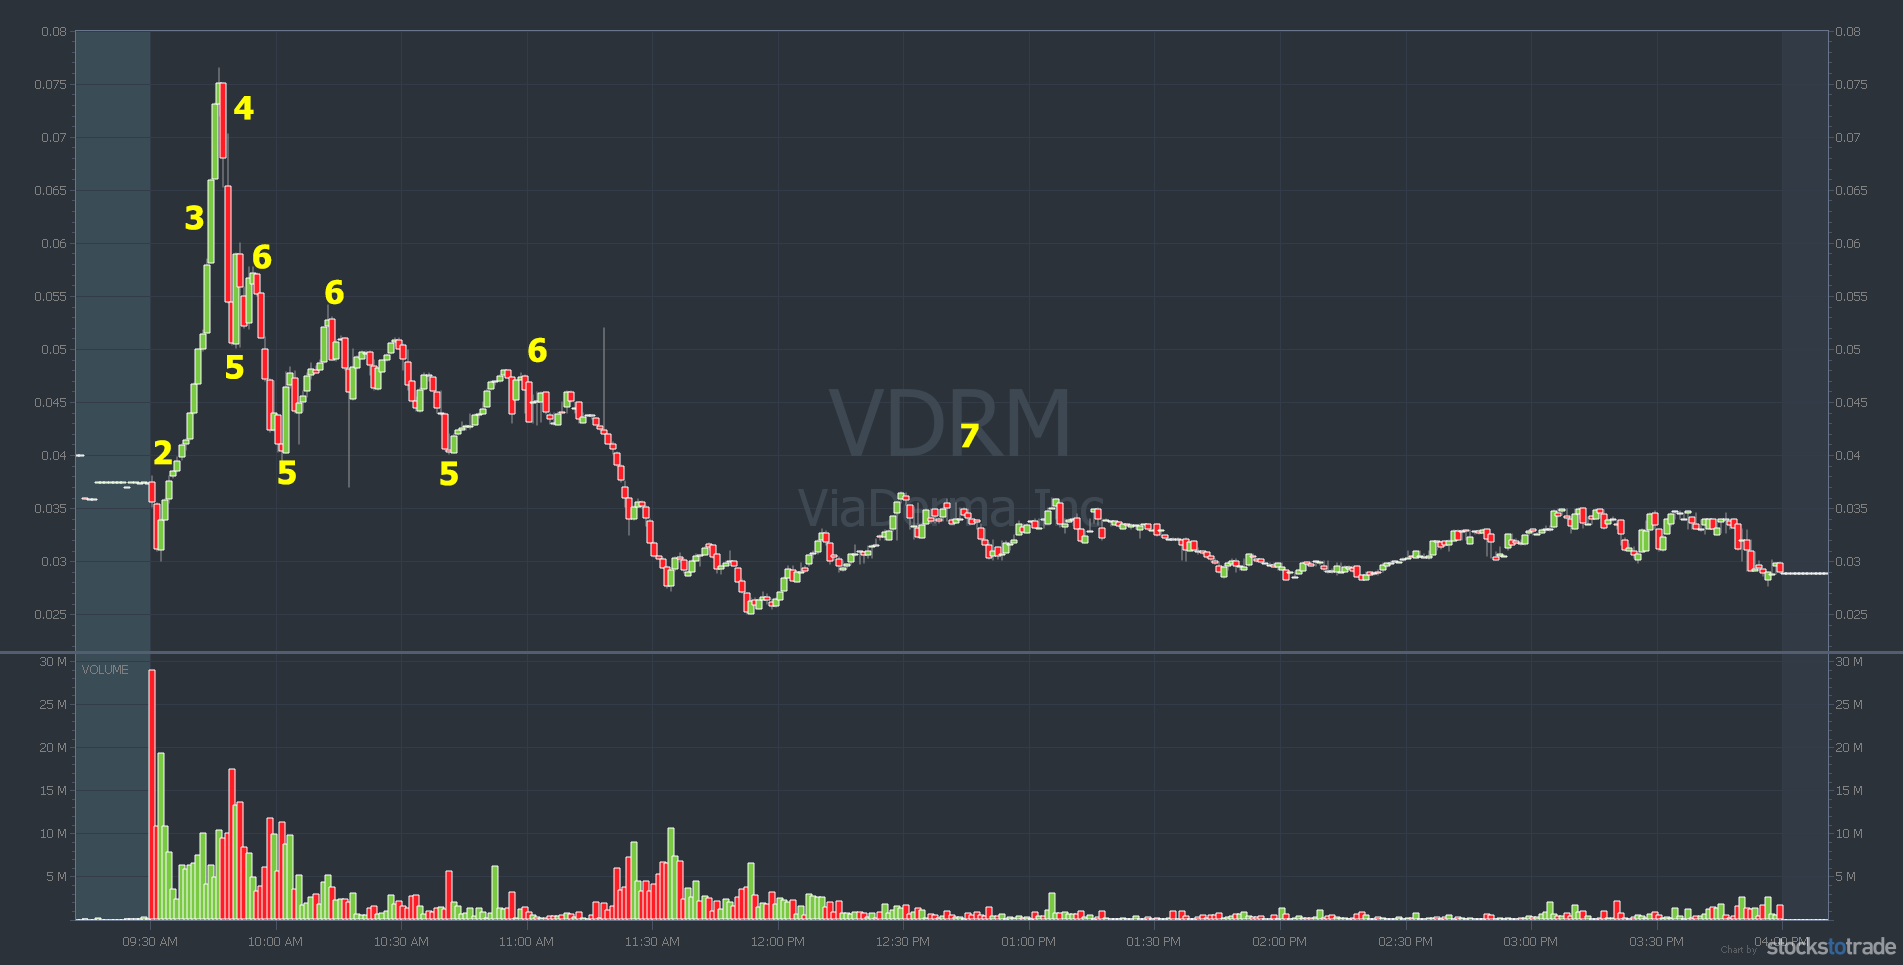
The VDRM chart above skips the #1 and doesn’t spend much time at #2. It was pretty much a #3 right out of the gate. After that, the framework plays out pretty accurately. Do you see the cliff dive, the dip buys, the dead pump bounces, and the long slow kiss goodnight?
Watch for these patterns as part of the overall pattern. Look for them every day. Especially on big percent gainers.
Top Tip: Understand Bubble Psychology
I saved this for last because it might just be the most important concept for any penny stock trader. The 7-step pennystocking framework is an example of a bubble. Even if it’s for a single stock, the psychology matches that of a bubble.
So it’s key to understand how bubbles work. I encourage every student to read “Extraordinary Popular Delusions and the Madness of Crowds.” Even though it’s 180 years old, it’s still relevant.
(As an Amazon Associate, we earn from qualifying purchases.)
Check out this chart showing the stages of a bubble as applied to a penny stock supernova.
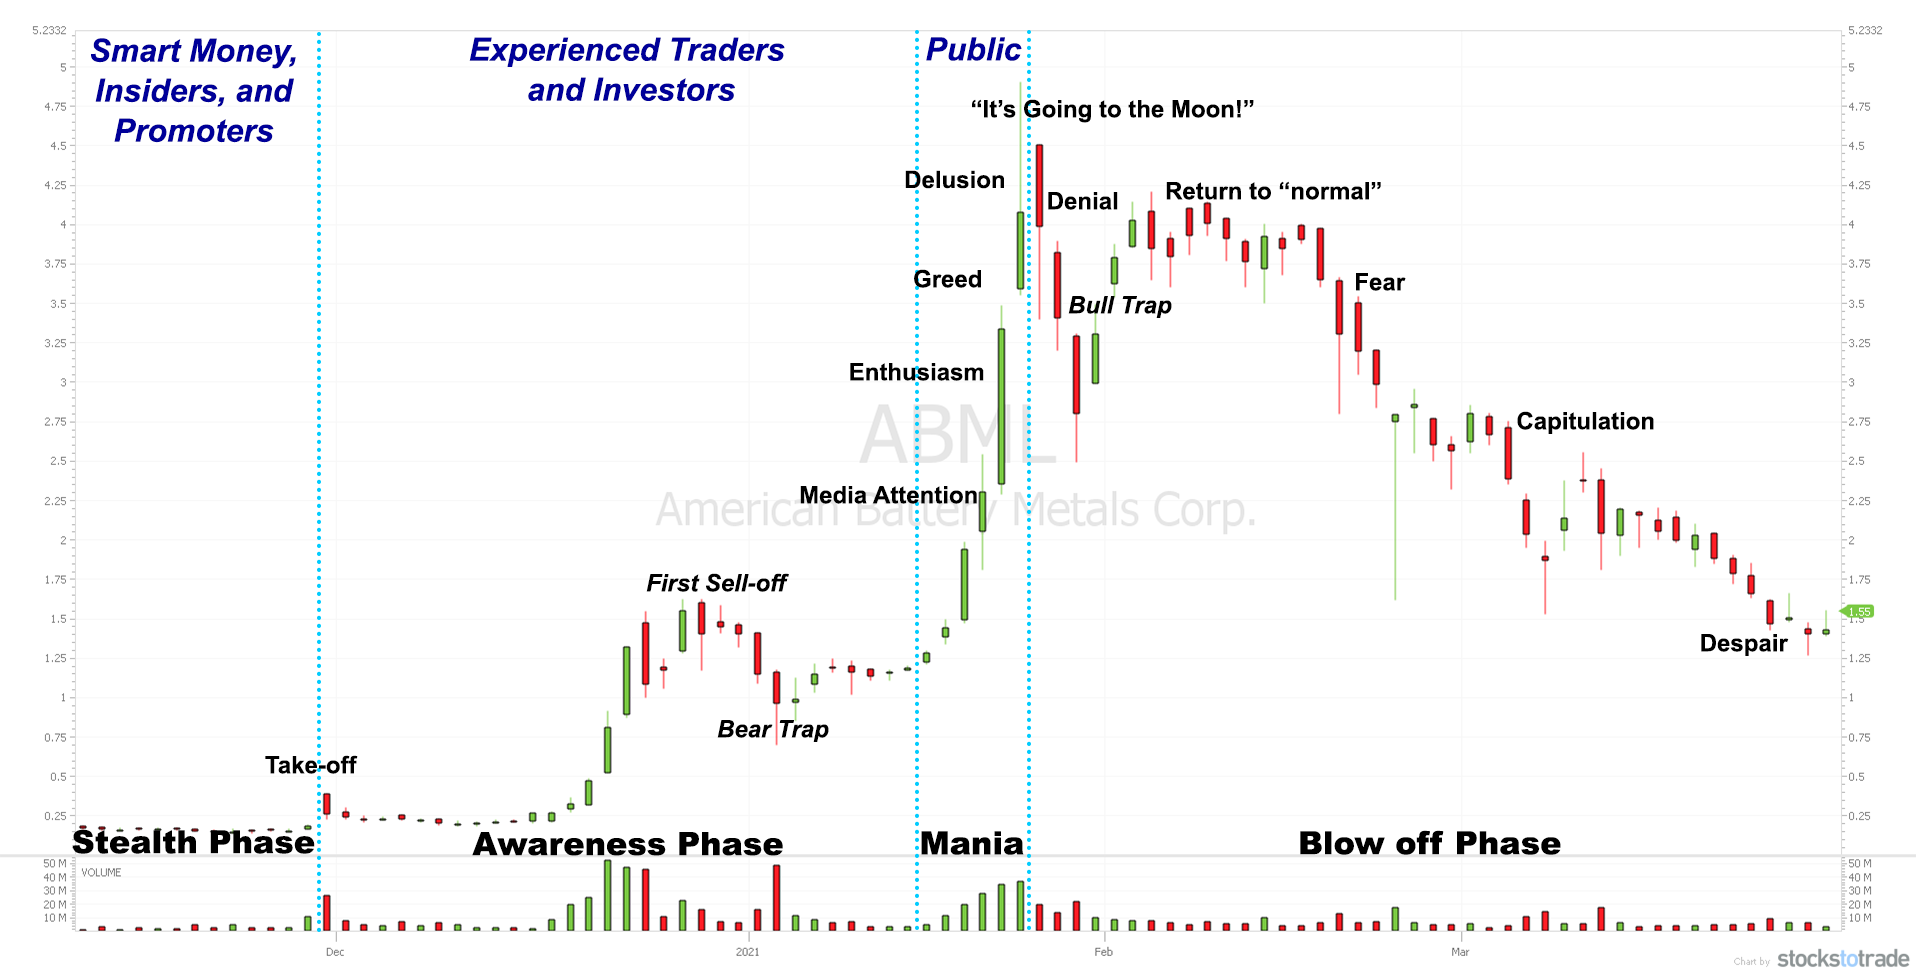
The stock in the chart above doesn’t matter. I could’ve chosen any one of dozens of stocks that followed the 7-step framework (or variations) in the past two years. The point is to understand the psychology behind the different stages in a bubble.
Then learn to apply that to trading the 7-step framework. It’s all about hype, manipulation, greed, and fear.
Notice the different parts of the mania or #3 supernova stage. Learn them inside and out. And note that media attention means social media, too. That’s when social pumps are often at their highest. Some promoters tweet 75–100 times per day about a stock.
Trade Review: Monster OTC Swing by Jack Kellogg
As you study the framework, review trades by Trading Challenge mentors and top traders. Check out this monster swing trade by Jack Kellogg. It’s a perfect example of playing the #1 of the 7-step pennystocking framework.
Jack nailed it…
American Premium Water Corporation (OTCPK: HIPH)
Again, Jack had a thesis about the marijuana sector (check out some of the details in this TWIST podcast episode). American Premium Water has a range of CBD-infused drinks. It was a bit speculative, but he was meticulous. He made a plan and followed it.
Jack entered the trade on January 11, taking a roughly $14,835 position. Check out the chart below. I’ve circled Jack’s entry and average sell price. (I’m not sure if he scaled out.) I also added the pennystocking framework steps.
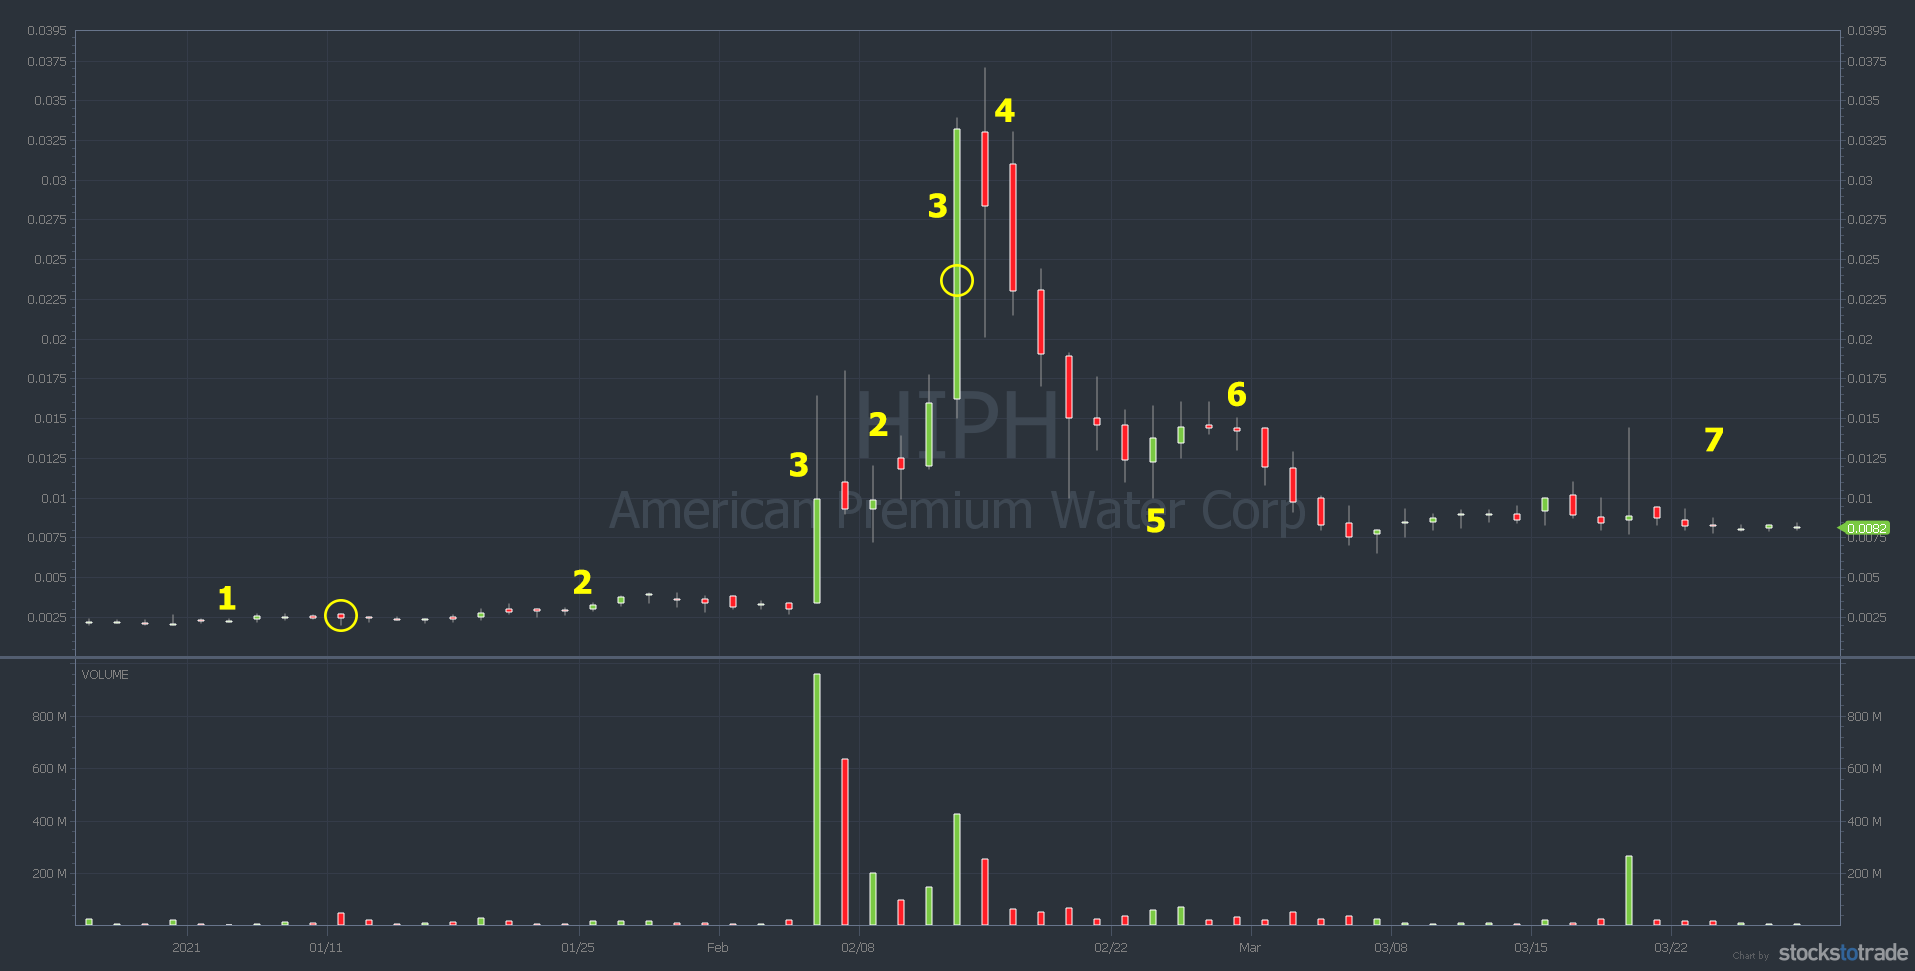
As you can see, Jack was in this stock in the ‘smart money’ phase. He sold into strength — in the greed phase. Jack took an 893% win on this trade. That’s crazy!
Notice the first #3 on the chart. The reason that’s a #3 is because the stock spiked 382% that day. Then it spiked another 70% the next morning before slowly fading. For a few days, it traded a relatively wide range for a low-priced stock. But the effect was consolidation. Then it went full supernova again.
Learn From Jack’s Dedication
This was a masterful swing trade and a great example of Jack’s dedication to the 7-step framework. He’s studied the framework incessantly. While I prefer to play #3 to #5, Jack has learned to look for plays on all the steps. That’s impressive and I think at least partially explains Jack’s amazing success in the last year.
I recently interviewed Jack about his success. He talked about the 7-step pennystocking framework and its importance to his trading. It’s a must-watch series — be sure to watch all four parts. Start with…
Confessions of a Valet Turned Millionaire Day Trader Part 1 of 4.
Learn the Nuances of the Pennystocking Framework
This post only scratches the surface of my pennystocking framework. It’s enough to begin to recognize the overall pattern. To really learn the framework, you need to study. Here are a few options…
30-Day Bootcamp
Day 13 of the 30 Day Bootcamp is an overview of the 7-step pennystocking framework. Days 14–19 break it down to the patterns within the pattern. If you’re just getting started, the 30-Day Bootcamp is a must-have resource.
“Pennystocking Framework”
This guide explains the 7-step framework in detail. Note: “Pennystocking Framework” is a bonus when you get the 30-Day Bootcamp.
“Pennystocking Framework Part Deux”
This guide provides a history of the 7-step pennystocking framework and updates it. “Pennystocking Framework Part Deux” also has examples of live trades using the 7-step framework.
What do you think of the 7-step penny stock trading framework? Comment below — I love to hear from YOU!

Leave a reply