Why yes, Dead Cat Bounce is the name of a rock band … but that’s not the topic of conversation today.
In the stock market, a dead cat bounce is a specific stock chart pattern that occurs during a price collapse. That’s what we’re talking about today.
Much cooler than a rock band, right?
Today, you’ll get schooled on the dead cat bounce pattern…
Read on to learn what a dead cat bounce is, how to spot it, and tips for how you can use it when seeking out potential trades.
Table of Contents
- 1 What Is the Dead Cat Bounce?
- 2 What Causes a Dead Cat Bounce?
- 3 What Is the Opposite of a Dead Cat Bounce?
- 4 Bull Trap vs. Dead Cat Bounce
- 5 Benefits of Trading the Dead Cat Bounce Pattern
- 6 How to Spot a Dead Cat Bounce Pattern
- 7 Examples of a Dead Cat Bounce
- 8 How Do You Trade a Dead Cat Bounce?
- 9 History of Dead Cat Bounces
- 10 Trading Challenge
- 11 The Bottom Line
What Is the Dead Cat Bounce?
Memorable name, right?
A dead cat bounce refers to a specific chart pattern. A stock’s price has a big drop, followed by a brief recovery — or “bounce” — before the descent continues.
The funny name came about in the 1980s. Asian markets were falling hard, then had a brief recovery before continuing an ailing trajectory.
This phenomenon was called a dead cat bounce. It came from the adage that “even a dead cat will bounce.”
It’s a pretty catchy name, so it didn’t take long to catch on. Now, the dead cat bounce can refer to this kind of action in stocks, forex, commodities, and even beyond the financial sphere.
New to penny stocks? Access my FREE penny stock guide here.
What Causes a Dead Cat Bounce?
A dead cat bounce is characterized by a stock taking a dive, bouncing back, and then continuing the nose dive.
But what causes it, and how does it play out?
As the stock price falls, shorts start looking for a point to take profits. At the same time, dip buyers look for a place to buy at a discount…
The buying pressure from these two sets of players can start to push the price back up.
But the buying is unsustainable. After the flurry of activity, new shorts start to pile on. And with no one left to buy, the downward crash continues.
This is a pattern we’ve seen play out over and over throughout the years. During the dot-com crash in the early 2000s, there was a brief rally in stock prices before the downward spiral continued. Bitcoin did the same thing during the 2017–2018 bubble.
Ultimately, the forces of supply and demand cause a dead cat bounce.
What Is the Opposite of a Dead Cat Bounce?
This is an easy one, it’s my favorite pattern … It helped make me my first million!*
The opposite of a dead cat bounce is a supernova. Supernovas are stocks that go almost straight up.
Typically these plays start with an initial spike followed by a period of consolidation. This brief pullback is then followed by a massive spike that goes fully parabolic. This often happens because of a short squeeze.
The markets are primed for plays like this right now. So many newbie short-seller wannabes come into the market and want to short every spike.
But they don’t realize they’re the ones causing the spike. They get squeezed and blow up their accounts. The result can be awesome for longs who study the past, know the pattern, and are prepared to pounce.
*My results are not typical. I’ve spent years developing exceptional skills and knowledge. Always remember trading is risky. Never risk more than you can afford.
Bull Trap vs. Dead Cat Bounce

Guess what another name for a dead cat bounce is … A bull trap.
Bulls are buyers. They believe stocks are going up. They’re always looking for an opportunity to buy at a discount.
Bears are the opposite — they believe stocks are going down and sell short into every spike.
A dead cat bounce can be a signal to bulls that the tides are turning. They think the price is going back up. So they buy what they think is a steep discount.
But they’re the only ones who buy after the shorts cover. Then there are no buyers left in the market. So the price continues to collapse.
If you don’t trade with a strict plan, you can get caught in the second collapse. It happens to a lot of permabulls. They keep buying after the second collapse starts. They end up trapped in their positions down 50%, 60%, or even 90%.
Yeah, ouch.
When the volume dries up, they can’t get out of their positions. There’s no one left to buy. In a nutshell, this is a bull trap.
It’s also a great example of why I always stick to rule #1: cut losses quickly.
You will lose in trading, but you have to keep your losses small. Recognize when you’re wrong. Never hold and hope, and don’t get caught in a bull trap. When a trade goes against you, get out.
Benefits of Trading the Dead Cat Bounce Pattern
The dead cat bounce might sound like a real downer … But there can be some benefits to it, including:
High Volatility
Day traders love volatility. Well, maybe not all day traders love it. But they recognize that volatility can cause those big meaty spikes that can lead to potential profits.
A dead cat bounce can have a big short-term spike. Prepared traders could benefit from this.
Scalping
Here’s another way to play a dead cat bounce … In theory, you buy shares when the stock hits a low point, then unload them during the bounce. Keep in mind that it’s hard to know when the bounce is over. When in doubt, get out. These bounces don’t last long.
More Breaking News
- Huntington Bancshares Misses Q4 Earnings Estimate Amid Turbulent Market Conditions
- BigBear.ai Under Investigation: Stock Faces Turbulent Times
- Novo Nordisk’s Shares Surge as FDA Targets Illegal Drug Marketing
- DealFlow Discovery Conference Unveils Corporate Opportunities
Opportunities for Short Sellers
Let’s say your technical analysis is 100% on point. You know a stock is experiencing the dead cat bounce pattern and not a trend reversal … It could be a good time to enter into a short position. If the price continues to go down, there’s a potential to profit.
Sound easy? It’s not. Remember the newbie short-seller wannabes and short squeezes I just mentioned? Yeah. Keep that in mind.
It Can Repeat
Sometimes a dead cat can bounce more than once. If you look at a stock’s chart, you may notice it bounces at regular intervals. This could be a stock worth watching — it could repeat again.
How to Spot a Dead Cat Bounce Pattern

The best way to spot a pattern is to study past patterns. That’s not unique to the dead cat bounce pattern either.
The stocks and companies change — but the patterns mostly stay the same. Every moment in the market is unique. You’ll always find some variation from one dead cat bounce to the next.
That’s why it’s important to study. You’ll only start to recognize these patterns after you’ve seen them a lot. Once you understand how the pattern works, you’ll be better prepared to trade it.
Learn from the past to prepare for the future.
Examples of a Dead Cat Bounce
To really bring these concepts home, let’s look at some specific examples of dead cat bounce patterns and how they look on a chart. These charts are from StocksToTrade.
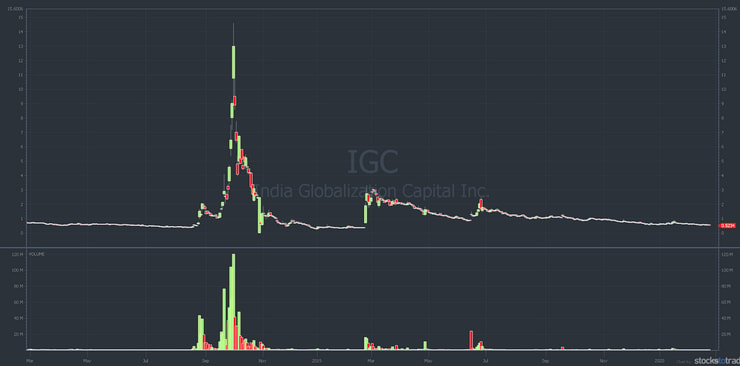
#1: India Globalization Capital, Inc. (AMEX: IGC)

India Globalization Capital is a company involved in creating and commercializing cannabis products to help treat medical conditions. In 2018, it had a huge spike from $2 to $15 — classic supernova.
After the run-up, the price started to collapse, falling to $4. That’s when the dead cat bounce happened. The price went back up to nearly $7, a huge move by all accounts.
But it didn’t last long … The price then continued downward, and the stock was trading below $1 within a few weeks.
What Can You Learn From This Stock Chart
Looking at this chart, a key lesson is what goes up, must come down. Quick, violent spikes in price are rarely sustainable. This chart is a good example of what can happen in the aftermath.
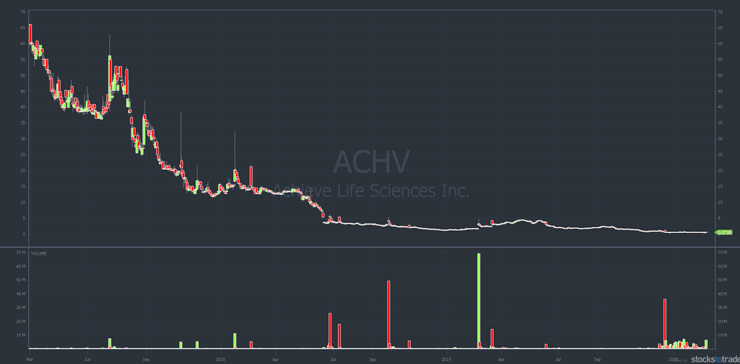
#2 Achieve Life Sciences Inc (NASDAQ: ACHV)

This specialty pharmaceutical operation works with medications meant to help people quit smoking.
The share price skyrocketed following positive results of a clinical study. Then it quickly declined, with several bounces along the way.
What Can You Learn From This Stock Chart
With biotech companies, news catalysts can be fickle and short-lived. It’s key to stay on top of clinical trials and the results. You also want to keep an eye on the company’s balance sheet.
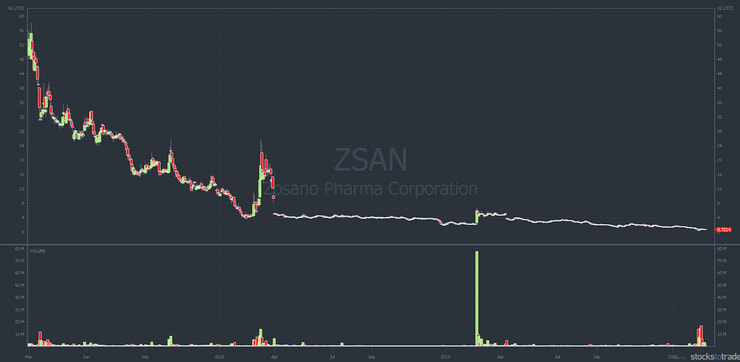
#3 Zosano Pharma Corp (NASDAQ: ZSAN)

Zosano is a pharma company involved in the development of a proprietary dermally applied microneedle drug delivery system to treat migraines.
In 2018, it had a reverse split, which caused a decline in price. Since then it’s had a few bounces.
What Can You Learn From This Stock Chart
Reverse splits can often cause a decline in stock price.
A reverse split is the opposite of a traditional stock split. It’s something companies with low share prices might do. It increases the share price but reduces the overall number of shares available.
Say a company does a 4-for-1 reverse split. If it has four million shares outstanding with a price of $1 per share, it has one million shares outstanding with a price of $4 per share after the split.
The split itself doesn’t change the value of the company, and the market cap remains the same.
Companies might have a reverse split to avoid being delisted from an exchange due to a low share price. This isn’t always the case, though. Sometimes a company wants to increase its share price.
Why would a reverse split affect a company negatively? It can look like a big red flag to traders, particularly if the shares have been waning recently.
However, the decline isn’t always without a few bounces, as you can see by this chart. Sometimes a spike can occur — and that can create opportunities for traders.
How Do You Trade a Dead Cat Bounce?

Wanna try trading a dead cat bounce? Here are some tips to help you approach trades responsibly.
For access to my 6,000+ video lessons, subscribe to Pennystocking Silver. That’s just one way you can learn from my 20+ years of experience trading penny stocks.
Taking Profits
These bounces don’t last forever, and neither do the declines.
Understand that all prices are temporary. Don’t hold too long. Lock in your profits quickly and manage your risk well. Cut those losses quickly!
Unsure if you should take profits or let it ride? You can take partial profits and keep a portion of your position active until you’re ready to get out for good.
Always Use a Stop Loss
Things can happen fast with a dead cat bounce.
Once you find a dead cat bounce and decide to sell short or buy the dip, know that anything can happen. The trade can go against you at any point.
To stay safe, always place a stop. You can use hard stop-losses or mental stops. Always cut your losses quickly.
With a hard stop-loss, you determine the maximum loss you’re willing to sustain. You then set a stop-loss order with your brokerage. If the price goes below your stop level, your position will be closed. And you can avoid further losses.
How do you set a stop-loss order? The exact process can vary. Check with your broker for those details.
Where to set a stop is a different story. You want to leave enough room for the price to move around … But if you set it too far, you can take on unnecessary risk.
As a point of reference, you can use a recent low point as the stop when going long. When shorting, use a recent high price as your stop. It’s not an exact science. You’ll develop a better feel for it over time and with lots of practice.
Never Trade Too Big
In case I haven’t stressed it enough, dead cat bounces can be risky. Any type of trading can be risky, of course. But because of the fast pace and uncertainty involved in dead cat bounces, they present a particularly high level of risk.
Yes, it’s a pattern, but that doesn’t mean it’ll play out exactly as you expect every single time. There can always be deviations.
So never trade too big.
Anything that you put into a trade could potentially be lost. Don’t want to put more on the line than you can stand to lose.
So what’s “too big?” That depends on you, your account size, and your risk tolerance. But ultimately, don’t bet more than you can’t comfortably lose.
Some traders can be tempted to go all in with trades. They figure go big or go home…
Wrong, wrong, wrong. This type of thinking is better for movies than actual life. In real life, you could drain your account in the blink of an eye.
Instead of going for a home run, focus on slow steady growth. Singles add up. Taking smaller positions is fine, and if your profits are relatively small, that’s OK. Small wins add up over time.
Know When to Go Short
Once the bounce starts, you might be excited to start shorting. But don’t short too soon. You never know when you might be wrong. Some of the examples we looked at earlier nearly doubled on their dead cat bounce.
Wait for the price to break down below the bottom of the initial dip. Keep your stop close too. The bulls could put up one last fight that could squeeze all the shorts — including you.
When in doubt, no trade is your best option.
Improve Your Stock Market Knowledge
Work hard every single day to improve your stock market knowledge.
This might seem like an indirect way to improve your dead cat bounce prowess. But it has everything to do with preparing well for this pattern.
For instance, right now, you’ve taken the time to read this post about dead cat bounces. Just by doing that, you’re already beginning to understand what a dead cat bounce is. You might even be thinking about different strategies to approach it.
Or maybe you’re thinking “Nope, that’s not for me.” But even if you have no interest in dead cat bounces, it’s not a waste of time to learn about them.
Why? You learn a lot about your personal trading style and have more time to refine the techniques you prefer.
Overall, the more you learn about the stock market, including common patterns, market mechanics, and how to read stock charts, the more nimble and knowledgeable you’ll be.
So when you’re crafting a trading plan, plotting entry and exit points, or identifying trends, you’ll have a bigger wealth of knowledge to draw from.
You’ll never know everything there is to know about trading. But that shouldn’t stop you from learning all you can. More than anything else, this can help you adapt and evolve along with the market.
I’ve been trading for decades — I’ve seen cycles come and go. Continuing to learn is one of the biggest ways I’ve been able to stay relevant.
Get my FREE weekly stock watchlist here.
History of Dead Cat Bounces
This pattern’s been happening for hundreds of years.
From the tulip bubble of the 1600s to the dot-com crash in the early 2000s, dead cat bounces have long been a part of freely traded markets.
In more recent history, the Bitcoin bubble of 2017 led to several dead cat bounces into early 2018.
As long as humans are around, there will be bubbles and overextended markets that will eventually collapse. The dead cat bounces will likely continue right along with the bubbles.
Learn from history. These same patterns play out over and over again. Each time will be a little different too. The more you see a pattern play out the better you can react the next time you see it.
Trading Challenge

Plenty of market newcomers think that they can learn how to trade on their own. Plenty of new traders also fail miserably…
Why approach the market the hard way? You can take advantage of someone else’s experience to fast forward through a ton of the hard stuff.
Looking for market guidance? Consider applying for my Trading Challenge.
My Trading Challenge isn’t for just anyone. You have to apply. I only want to spend my time with motivated students who want to become self-sufficient traders. Get-rich-quick hopefuls and lazy losers need not apply.
We’ll cover the basics, of course, but my emphasis is to help you put your trading knowledge to active use.
I won’t give you vocabulary tests and charts to memorize. I want you to learn how to build a strong watchlist, read stock charts, and ultimately, find your own success as a trader. You gotta forge your own path.
You get access to a ton of resources … A huge library of video lessons, webinars and live trading sessions, and of course, my watchlist every Sunday night.
See if you’re up for it. Apply today.
The Bottom Line
When you really understand chart patterns and can anticipate things like a dead cat bounce, you’re well on your way to being a self-sufficient trader. But this is a tricky one…
Remember that dead count bounces are far from infallible. It can be hard to know whether it’s a dead cat bounce or a trend reversal.
That’s why you gotta study. When you have a better understanding of the market … when you learn to spot patterns like this … you can determine if this is a trading style you want to pursue.
Ready to get serious about your education? Apply for the Trading Challenge today.
What do you think about this post? Leave a comment!


Leave a reply