

Neighborhood Intelligence Inc. stocks have been trading up by 17.82 percent following upbeat coverage of its new AI-driven neighborhood analytics platform.
What Traders Need To Know
- Neighborhood Intelligence and Fathom terminated their June merger deal, removing the prior full-combination roadmap.
- NXH chose to keep its blockchain and digital-asset holdings, including tZERO, rather than sell them under the old structure.
- Management believes these digital assets are undervalued and is positioning NXH for independent growth with selective partnerships.
- The revised framework with Fathom now targets a combined real estate and digital-asset platform instead of a full merger.
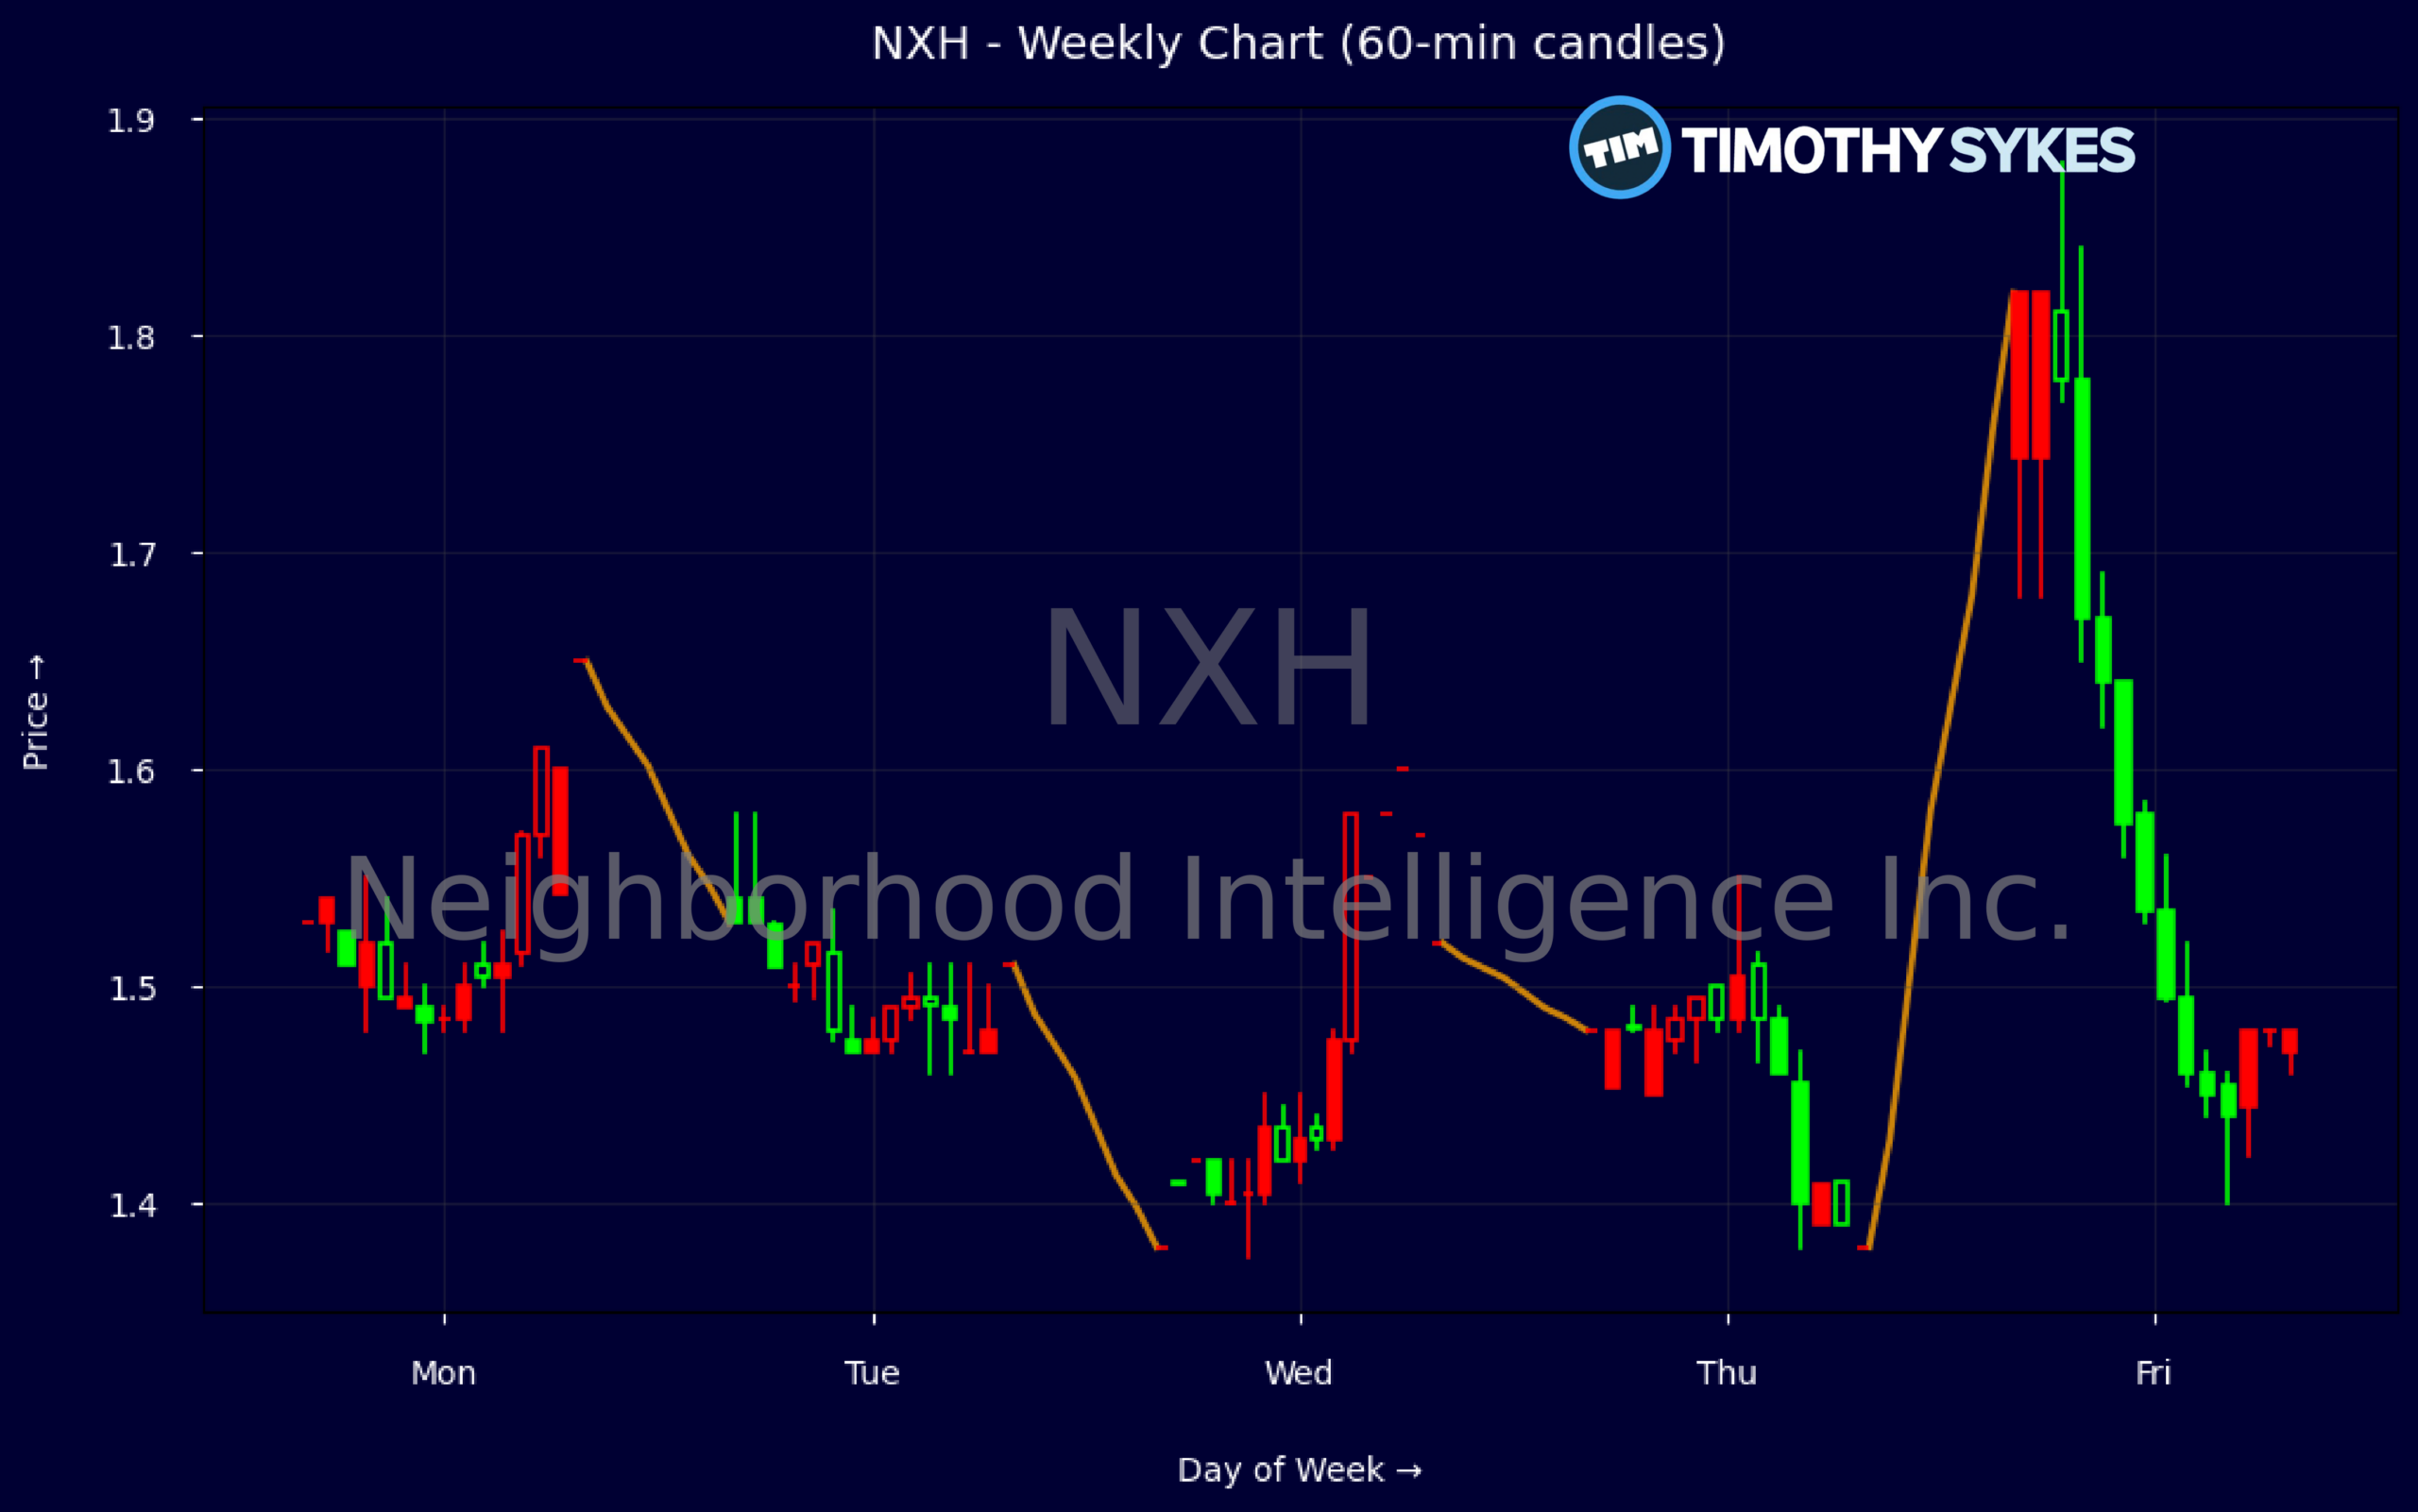
Weekly Update Oct 19 – Oct 23, 2026: On Sunday, October 25, 2026 Neighborhood Intelligence Inc. stock [NASDAQ: NXH] is trending up by 17.82%! Discover the key drivers behind this movement as well as our expert analysis in the detailed breakdown below.
Consumer Discretionary industry expert:
Analyst sentiment – neutral
Neighborhood Intelligence (NXH) remains a distressed turnaround in Consumer Discretionary, with Q2 revenue of $361 million annualizing to roughly one‑third of the $1.0 billion TTM base and negative EBITDA of $34.8 million. Gross profit of $96.7 million implies gross margin in the mid‑20s, inadequate against fixed SG&A. NXH trades at only 0.16x sales and 0.87x book, reflecting skepticism about its strategy and persistent losses. Free cash flow was deeply negative at $43.4 million, and working capital stands at a problematic negative $74.8 million, though cash of $99.5 million and modest net financial debt provide some runway.
Technically, NXH shows early signs of accumulation after a prolonged downtrend. Weekly prices lifted from a flat $1.53 print to close at $1.74, with a strong $1.62–1.88 range suggesting buyers are re‑engaging on improved liquidity. Intraday five‑minute candles (not shown here) have recently skewed to higher lows and strong closes near session highs, confirming near‑term bullish momentum. The actionable level is $1.50: above it, dips are buyable; a sustained break below reopens downside toward the mid‑$1.30s and invalidates the nascent rebound.
Strategically, the scrapped Fathom merger and renewed commitment to blockchain and digital‑asset holdings, including tZERO, pushes NXH further from core Retail‑Discretionary fundamentals and toward a hybrid real‑estate/fintech profile. Versus Consumer Discretionary peers, NXH screens cheaper on sales but materially worse on profitability and cash generation. I expect higher volatility but improving sentiment as the restructured Fathom collaboration clarifies. My 6–12 month base‑case range is $1.25 support and $2.25 resistance; risk‑tolerant investors can accumulate below $1.60.
More Breaking News
Quick Financial Overview
Neighborhood Intelligence Inc. (NXH) is trading in a tight but active range after the merger reset with Fathom. Weekly data show the stock holding around the mid-$1s, with closes from $1.38 up to roughly $1.74 over recent weeks. The most recent bar pushed from the low $1.60s to around $1.74, signaling fresh buying interest after the strategic update on digital assets and the reworked Fathom relationship. Intraday, a 5-minute candle spiked from $1.45 to $1.64, a strong single-bar move that tells you how quickly sentiment can flip when headlines hit a thinly traded name.
On the fundamentals, NXH generated about $1.04B in trailing revenue, yet the price-to-sales multiple sits near 0.16. That is deep value territory on sales alone, but the income statement shows why the market is cautious. For the quarter ending 2026/06/30, the company posted a net loss of roughly $39.5M and negative EBITDA near $34.8M, with operating income also firmly in the red. Cash flow from operations was about -$38.2M and free cash flow around -$43.4M, so the current model is still burning cash.
The balance sheet is a mixed picture. NXH holds about $99.5M in cash and short-term investments, with total assets of roughly $634.2M and equity near $214.8M. Book value per share is around $1.95, so the stock trading in the $1.40–$1.70 band implies a modest discount to book and a much steeper discount to sales. But working capital is negative by roughly $74.8M, and there is about $96.5M in long-term debt and capital lease obligations. For traders, that blend of low multiples, real revenue scale, and ongoing losses creates a classic high-risk, high-volatility setup.
Conclusion
Neighborhood Intelligence Inc.’s shift away from a full merger with Fathom toward a restructured real estate–plus–digital-asset platform is the key driver for NXH right now. The company chose optionality over certainty by keeping its blockchain and digital-asset holdings, including its stake in tZERO, and signaling that it sees more upside than the prior deal recognized. Price action around the mid-$1s, a recent push toward $1.74, and that sharp intraday $1.45 to $1.64 spike all confirm that headlines can quickly ignite the tape.
For traders, the fundamental backdrop explains why moves can be violent in both directions. NXH has meaningful revenue, but it is losing money, burning cash, and running with negative working capital. At the same time, a sub-1 price-to-book and very low price-to-sales ratio hint that any clear proof of digital-asset value or real progress on the restructured Fathom platform could re-rate the stock fast. The flip side is simple: if execution stalls or cash burn accelerates, the market can punish the name just as quickly.
In my view, this is a textbook event-driven trading story rather than a comfortable long-term hold. Traders should treat NXH as a catalyst stock, tracking new details on the Fathom collaboration, any monetization of tZERO or other blockchain assets, and how the earnings path evolves against that $1.40–$1.80 trading band. That means waiting for clean catalysts and price confirmation instead of blindly chasing every spike. As millionaire penny stock trader and teacher Tim Sykes, says, “Be patient, don’t force trades, and let the perfect setups come to you.”. As I tell my students, “When a company walks away from deal certainty to bet on misunderstood assets, you either get explosive upside or a slow grind lower — your edge comes from reading the price action, not believing the story.””,”scores”:{“risk-level”:”high”},”trade”:”true
This is stock news, not investment advice. Timothy Sykes News delivers real-time stock market news focused on key catalysts driving short-term price movements. Our content is tailored for active traders and investors seeking to capitalize on rapid price fluctuations, particularly in volatile sectors like penny stocks. Readers come to us for detailed coverage on earnings reports, mergers, FDA approvals, new contracts, and unusual trading volumes that can trigger significant short-term price action. Some users utilize our news to explain sudden stock movements, while others rely on it for diligent research into potential investment opportunities.
Dive deeper into the world of trading with Timothy Sykes, renowned for his expertise in penny stocks. Explore his top picks and discover the strategies that have propelled him to success with these articles:
- Penny Stocks Trading Guide
- Best Penny Stocks Under $1 to Buy Today
- Top 8 Penny Stocks to Watch on Robinhood
Once you’ve got some stocks on watch, elevate your trading game with StocksToTrade the ultimate platform for traders. With specialized tools for swing and day trading, StocksToTrade will guide you through the market’s twists and turns.
Dig into StocksToTrade’s watchlists here:





Leave a reply