

Nebius Group N.V. stocks have been trading up by 11.05 percent following upbeat coverage of its AI-driven cloud expansion.
Key Takeaways
- Long-term 50‑MW AIB data center deal anchors Nebius Group’s U.S. AI capacity in a power‑tight market and pushed shares higher premarket.
- A new $3.5B 364‑day secured facility arms Nebius Group for aggressive data center and GPU expansion but raises leverage and refinancing questions.
- Shares of Nebius Group ticked up after the Inferize acquisition, adding tools that speed launch and scaling of large AI models.
- New live GPU spot pricing, Nvidia‑backed EU builder grants, and flexible auctions show Nebius Group leaning hard into developer‑friendly economics.
- Nvidia’s Jensen Huang flagged Nebius as a high‑demand “neocloud,” while warning about working‑capital and European power constraints.
Live Update At 12:32:27 EDT: On Tuesday, October 27, 2026 Nebius Group N.V. stock [NASDAQ: NBIS] is trending up by 11.05%! Discover the key drivers behind this movement as well as our expert analysis in the detailed breakdown below.
Quick Financial Overview
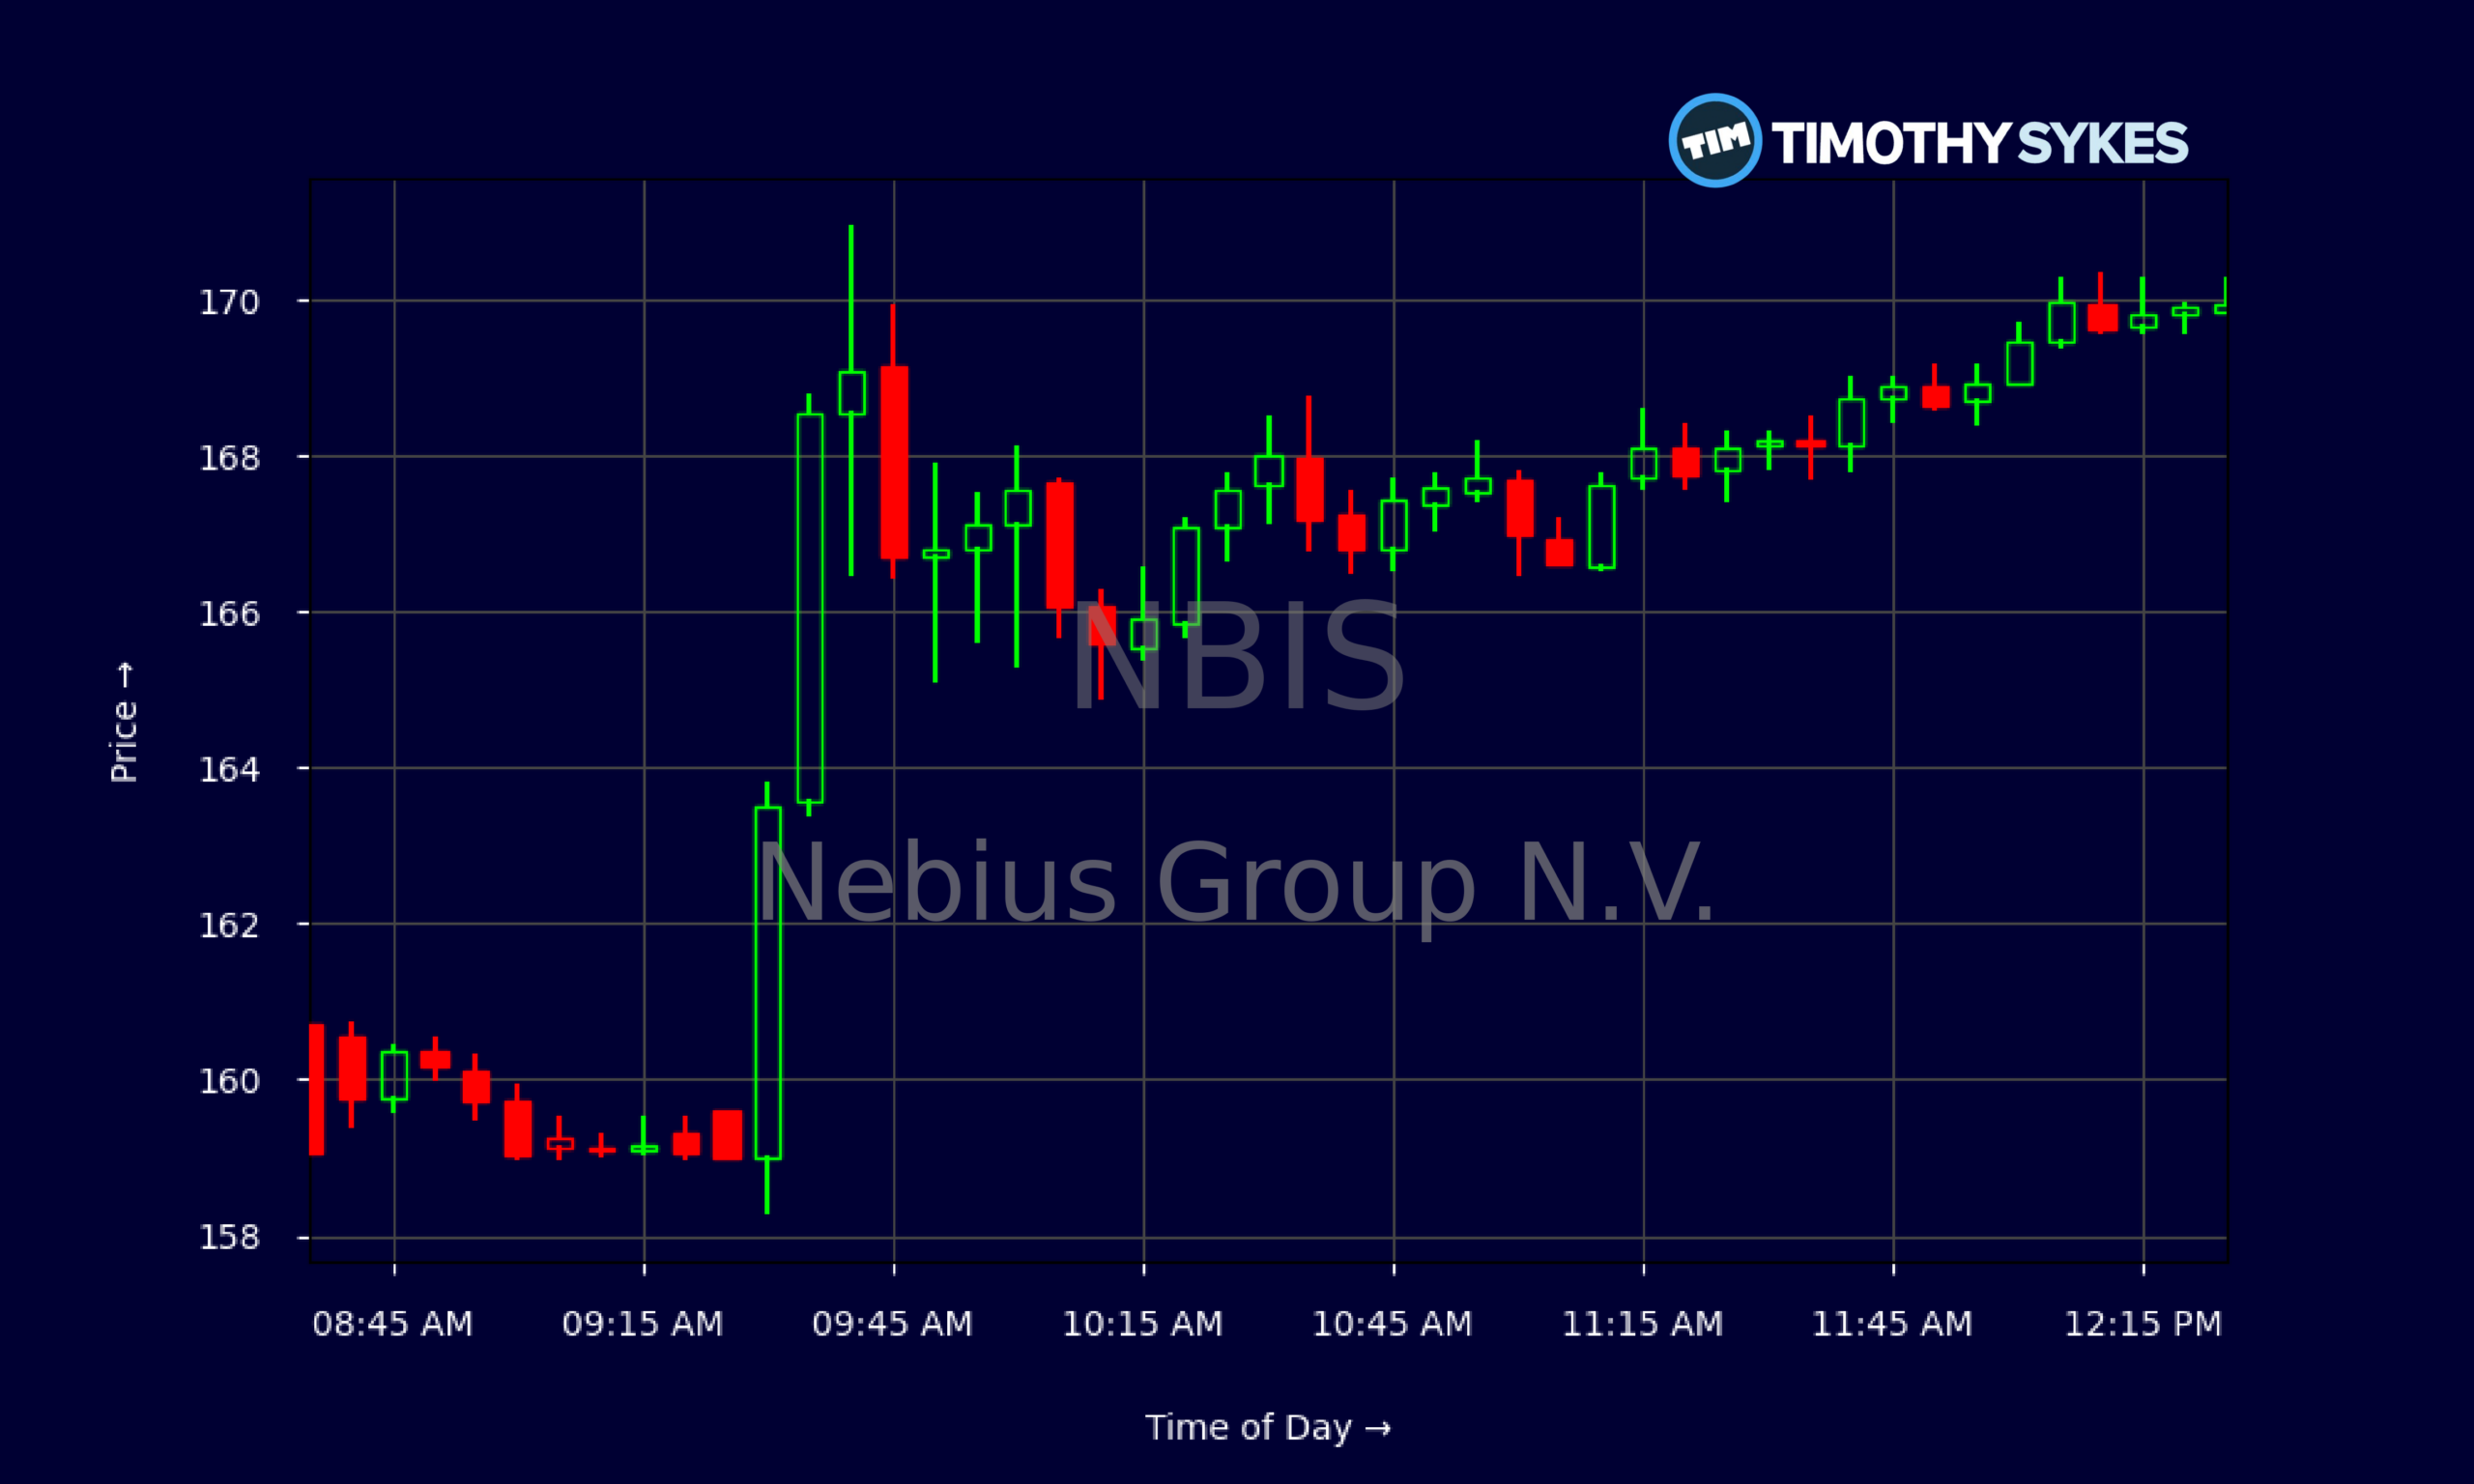
NBIS has been trading like a high‑beta AI infrastructure name. From early 2026/10/02 to 2026/10/27, Nebius Group N.V. ran from the low $230s down into the $150s before bouncing back above $170. That’s a steep drawdown followed by a sharp rebound — classic momentum stock behavior.
Over the latest session, NBIS opened near $159 and closed around $170.13, with an intraday high of $170.93. The 5‑minute chart shows steady buying from the open, a push through the $168–$169 area, and then a tight grind between $169 and $170. That intraday action tells traders dip‑buyers are back in control, at least for now.
Fundamentals show why NBIS trades like a story stock. Revenue is about $529.8M, but the market is assigning an enterprise value near $41.68B. That translates into a sky‑high price‑to‑sales ratio around 9,546 and price‑to‑book over 1,100. Profitability is still thin, with negative return on assets and negative return on equity. Nebius Group is clearly being priced as a high‑growth AI infrastructure platform where traders are paying for future scale, not current earnings.
More Breaking News
For active traders, that mix — extreme valuation, heavy leverage, and fast price swings — means NBIS can trend hard but reverse just as fast. Risk management is not optional here.
Why Traders Are Watching NBIS Right Now
NBIS is on a lot of watchlists because the story lines up with the hottest theme in the market: AI infrastructure. Nebius Group just locked in a 50‑MW commitment at AIB’s southeastern U.S. data center under a 12‑year agreement. In a world where power is often the real bottleneck for AI clusters, that’s not just a capacity bump; it’s a structural edge. The premarket lift on that headline showed traders understood how important time‑to‑power is in this game.
At the same time, Nebius Group secured a $3.5B 364‑day senior secured facility, tied to Term SOFR plus 2.75–3.50%. That is big, fast money aimed at building more data centers, buying GPUs, and funding general needs. For traders, this screams “all‑in build‑out.” The upside is obvious: more racks, more GPUs, more revenue potential. The risk is also obvious: a short‑dated, sizable facility means NBIS has to execute and then either roll or refinance in under a year.
Strategically, Nebius Group has been stacking catalysts. The Inferize acquisition adds infrastructure software that shortens time‑to‑launch and scaling for large AI models, pushing NBIS further up the value chain. Publishing live GPU spot prices, launching reserve auctions, pay‑as‑you‑go pricing, and a program to return idle GPUs for credits all point to Nebius Group trying to become the most flexible AI cloud option for builders.
On top of that, Nebius is now running NVIDIA’s simulation and training stack for Sereact’s Cortex on its Physical AI Workbench in EU data centers. That closed‑loop robotic training pipeline, billed on consumption, is a real‑world proof point for NBIS’s NVIDIA alignment and ability to host specialized, high‑value workloads.
Then you have Nvidia CEO Jensen Huang publicly calling out Nebius as a “neocloud” with extremely strong AI demand — and in the same breath warning about limited working capital and underbuilt European energy and infrastructure. That’s the NBIS trade in a nutshell: big demand, real constraints, and a wide outcome range.
Layer on top the meme element. Nebius Group has posted multiple 1.8–2.8% premarket rebounds right after 7%‑plus drops, often tied mainly to WallStreetBets and other retail‑chatroom chatter, not new NBIS fundamentals. That tells short‑term traders to expect sharp gaps, fast squeezes, and air pockets when the crowd moves on.
Conclusion
NBIS sits right at the crossroads of two forces: genuine AI infrastructure demand and aggressive financial engineering to chase that demand. Nebius Group N.V. is locking in power with the AIB 50‑MW, 12‑year deal, arming itself with $3.5B of short‑term capital, and leaning into NVIDIA’s ecosystem with offerings like the Sereact Cortex pipeline and the expanded EU AI builder program backed by $10M in compute grants.
At the same time, the balance sheet and valuation numbers remind traders this is not a sleepy utility. Nebius Group is carrying leverage, posting thin or negative profitability metrics, and trading at extreme multiples versus current revenue and book value. The stock’s recent slide from the $240s into the $150s, followed by a hard bounce toward $170, shows how violently sentiment can swing in NBIS.
For active traders, the setup is clear: NBIS is a momentum vehicle tied to real AI infrastructure growth but amplified by meme‑style attention and short‑dated financing risk. You map the catalysts — like capacity deals, financing updates, and NVIDIA‑related announcements — and you respect the volatility around them. As millionaire penny stock trader and teacher Tim Sykes, says, “Embrace the journey, the ups and downs; each mistake is a lesson to improve your strategy.” In a name like NBIS, that means using every spike, crack, and fake‑out as trading data to refine your process rather than as a reason to marry a bias.
Tim Sykes often reminds traders, “The market doesn’t care about your opinion; it cares about price action. Study the catalysts, trade the pattern, and always, always cut losses quickly.” NBIS is a textbook case for that mindset. This coverage is for educational and research purposes only, and any trading decisions around Nebius Group should be made with that risk‑first approach front and center.
This is stock news, not investment advice. Timothy Sykes News delivers real-time stock market news focused on key catalysts driving short-term price movements. Our content is tailored for active traders and investors seeking to capitalize on rapid price fluctuations, particularly in volatile sectors like penny stocks. Readers come to us for detailed coverage on earnings reports, mergers, FDA approvals, new contracts, and unusual trading volumes that can trigger significant short-term price action. Some users utilize our news to explain sudden stock movements, while others rely on it for diligent research into potential investment opportunities.
Dive deeper into the world of trading with Timothy Sykes, renowned for his expertise in penny stocks. Explore his top picks and discover the strategies that have propelled him to success with these articles:
- Penny Stocks Trading Guide
- Best Penny Stocks Under $1 to Buy Today
- Top 8 Penny Stocks to Watch on Robinhood
Once you’ve got some stocks on watch, elevate your trading game with StocksToTrade the ultimate platform for traders. With specialized tools for swing and day trading, StocksToTrade will guide you through the market’s twists and turns.
Dig into StocksToTrade’s watchlists here:





Leave a reply