

Gerdau S.A. faces pressure as weak global steel demand and lower guidance weigh on sentiment; stocks have been trading down by -6.37 percent.
Key Takeaways
- Price action in GGB shows a pullback from the $5.20 area into the high‑$4s, with recent sessions closing under prior highs.
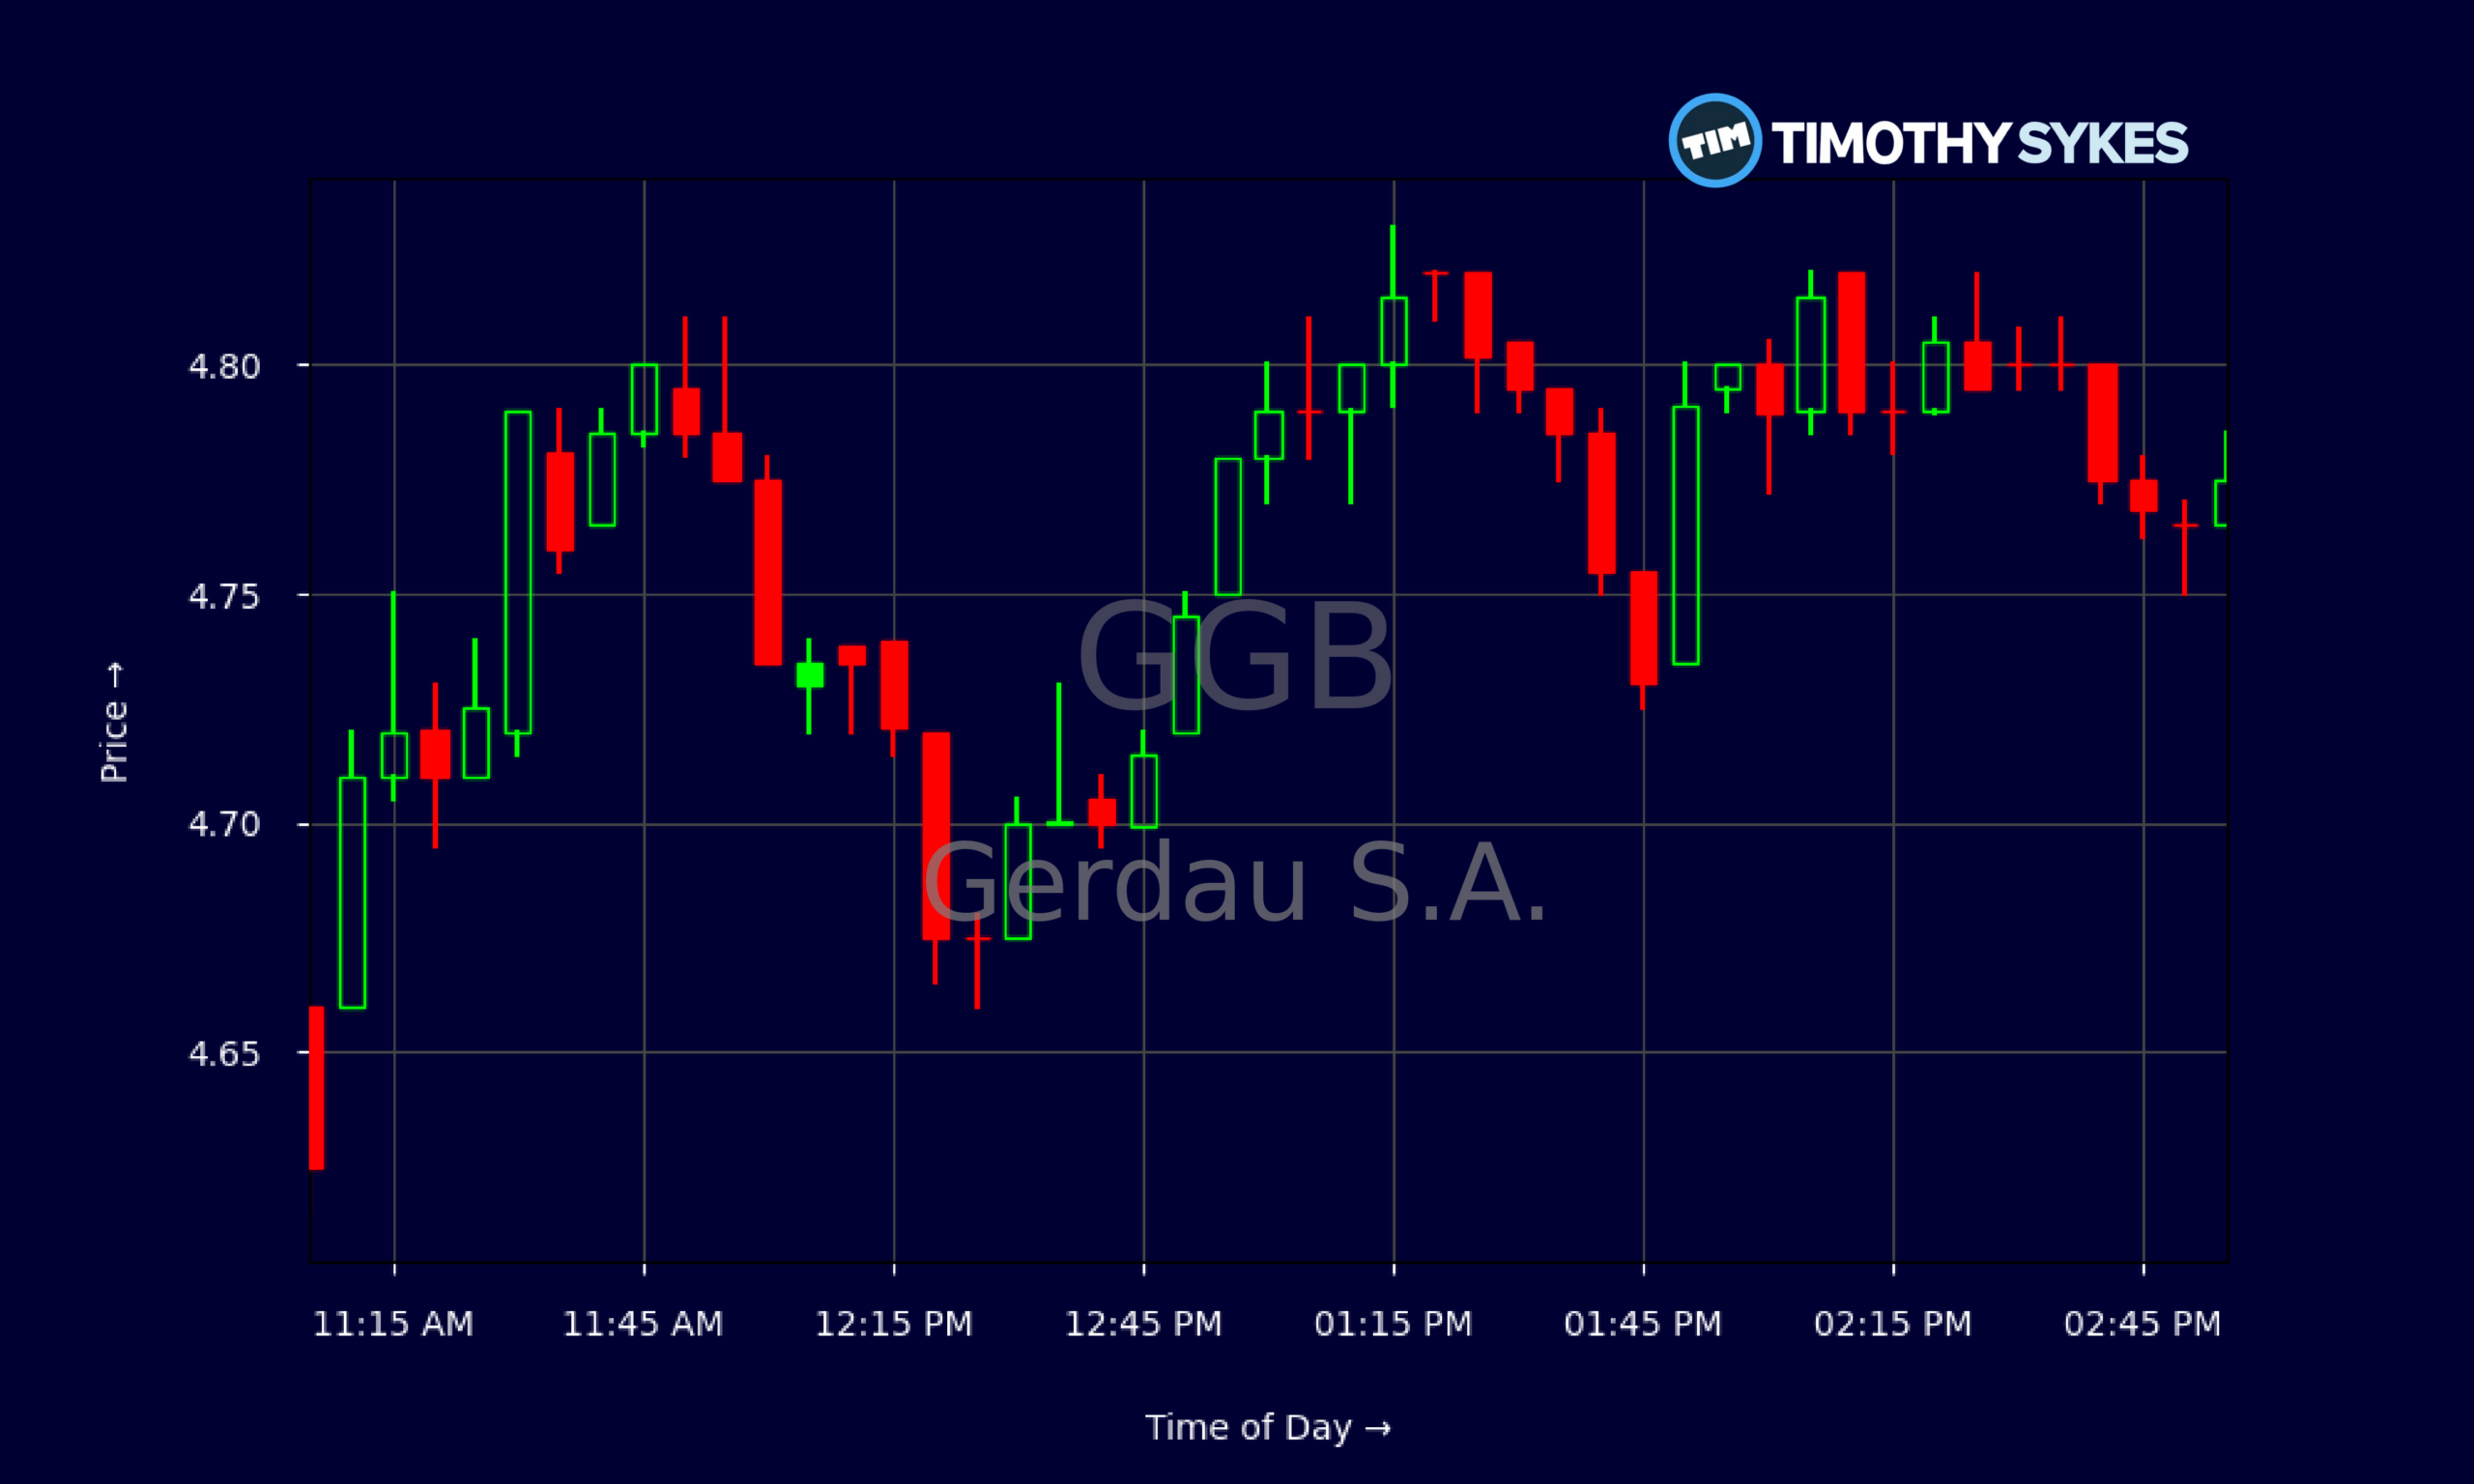
- Intraday trading in GGB featured a sharp morning fade followed by steady grinding recovery, signaling active dip-buying interest.
- The balance sheet for Gerdau S.A. shows over $6.3B in cash and relatively modest long‑term debt, giving GGB financial breathing room.
- Valuation metrics place GGB below 1x book value and under 1x sales, which many value‑focused traders watch closely.
- Steel‑sector cyclicality and global macro swings remain the biggest wild cards around GGB trend direction.
Live Update At 15:02:45 EDT: On Monday, October 26, 2026 Gerdau S.A. stock [NYSE: GGB] is trending down by -6.37%! Discover the key drivers behind this movement as well as our expert analysis in the detailed breakdown below.
Quick Financial Overview
Gerdau S.A., trading under ticker GGB, is a classic cyclical name tied to steel demand, but the financials show a company with real staying power. Revenue is about $67.0B, yet GGB trades at roughly 0.74 times sales and around 0.97 times book value. For value‑driven traders, those are attention‑grabbing numbers, especially with steel demand swinging on global growth and infrastructure cycles.
Profitability is still there. GGB posts a pretax profit margin near 18.8%, which is solid for a basic‑materials player facing commodity price swings. Return on equity at 9.58% and return on assets at 6.11% show the company is using its capital reasonably well, not just sitting on assets.
More Breaking News
The balance sheet is another plus for GGB. Total assets are about $81.7B vs. total liabilities of $27.9B, and cash plus short‑term investments sit around $6.4B. Long‑term debt of roughly $13.2B is meaningful but manageable, especially with a low long‑term debt‑to‑capital ratio of 0.14. For traders, that means GGB has room to ride out downturns and still fund operations without a fire drill.
Why Traders Are Watching GGB Price Action
When you study the GGB chart, you see a slow shift from strength to hesitation. On the daily side, GGB ran from a low near $4.72 up through the $5.30 area earlier in the month. That move showed solid momentum and attracted breakout traders. But over the last several sessions, GGB has slipped off those highs. The latest close around $4.78 marks a clear pullback from the $5.20–$5.30 zone, telling us buyers are no longer chasing every uptick.
Zoom into the intraday 5‑minute chart and the story gets more interesting. GGB opened near $5.02, spiked toward $5.20, and then sold off hard into the mid‑$4.60s by late morning. Heavy fade after an early push is a textbook trap for late breakout chasers. Yet from there, GGB gradually climbed back, grinding from the $4.60s up into the $4.80 neighborhood into the close. That grind shows dip buyers are alive and watching GGB closely.
This type of tug‑of‑war is what short‑term traders live for. GGB has clear intraday levels now: the low‑$4.60s as support and the $5.20 area as near‑term resistance. When a stock like GGB has tight spreads, strong volume, and defined levels, it tends to attract day traders and swing traders looking for repeatable patterns.
On top of that, Gerdau S.A.’s valuation backdrop gives swing traders extra confidence to stalk bounces. With enterprise value near $11.9B versus a much larger asset base, GGB trades more like a value play than a high‑flyer. That doesn’t guarantee upside, but it often limits the extreme downside panic you see in story stocks. For active traders, that balance between volatility and underlying support is the edge.
Conclusion
For traders tracking GGB, the setup is all about combining chart patterns with the company’s sturdy financial base. The daily trend shows Gerdau S.A. pulling back from recent highs, but not breaking down. GGB is consolidating in the high‑$4s after testing above $5, while intraday data shows aggressive morning selling met by determined afternoon buying. That kind of intraday recovery tells you there is real trading demand down below.
Financially, GGB’s roughly $6.4B in cash, moderate leverage, and sub‑1x price‑to‑book profile support the idea that dips may attract value‑minded traders. At the same time, a lofty price‑to‑earnings ratio near 38 reminds everyone that the market is still pricing in earnings strength, so extended weakness in steel demand would matter. Gerdau S.A. is not a “set and forget” name; it is a cyclical workhorse.
For short‑term players, the mandate is simple: respect the levels. The $4.60s are the key support zone, while $5.20–$5.30 is the line where GGB has failed recently. As Tim Sykes likes to say, “The market rewards discipline, not hope.” That idea lines up with a second core trading principle he emphasizes: As millionaire penny stock trader and teacher Tim Sykes, says, “Small gains add up over time; focus on building wealth gradually, not chasing jackpots.”. Traders studying GGB now should lean on that mindset — plan trades around clear risk, react to the price action, and always be ready to cut losses fast if those levels break. This analysis is for educational and research purposes only, and every trader must decide their own approach.
This is stock news, not investment advice. Timothy Sykes News delivers real-time stock market news focused on key catalysts driving short-term price movements. Our content is tailored for active traders and investors seeking to capitalize on rapid price fluctuations, particularly in volatile sectors like penny stocks. Readers come to us for detailed coverage on earnings reports, mergers, FDA approvals, new contracts, and unusual trading volumes that can trigger significant short-term price action. Some users utilize our news to explain sudden stock movements, while others rely on it for diligent research into potential investment opportunities.
Dive deeper into the world of trading with Timothy Sykes, renowned for his expertise in penny stocks. Explore his top picks and discover the strategies that have propelled him to success with these articles:
- Penny Stocks Trading Guide
- Best Penny Stocks Under $1 to Buy Today
- Top 8 Penny Stocks to Watch on Robinhood
Once you’ve got some stocks on watch, elevate your trading game with StocksToTrade the ultimate platform for traders. With specialized tools for swing and day trading, StocksToTrade will guide you through the market’s twists and turns.
Dig into StocksToTrade’s watchlists here:





Leave a reply