

Hornbeck Offshore Services Inc. stocks have been trading up by 8.07 percent amid bullish sentiment on offshore energy demand.
Market Insights For Active Traders
- Intraday action shows a strong push from the mid-$6s to over $7, signaling fresh buying interest and short-term momentum in Hornbeck Offshore Services Inc.
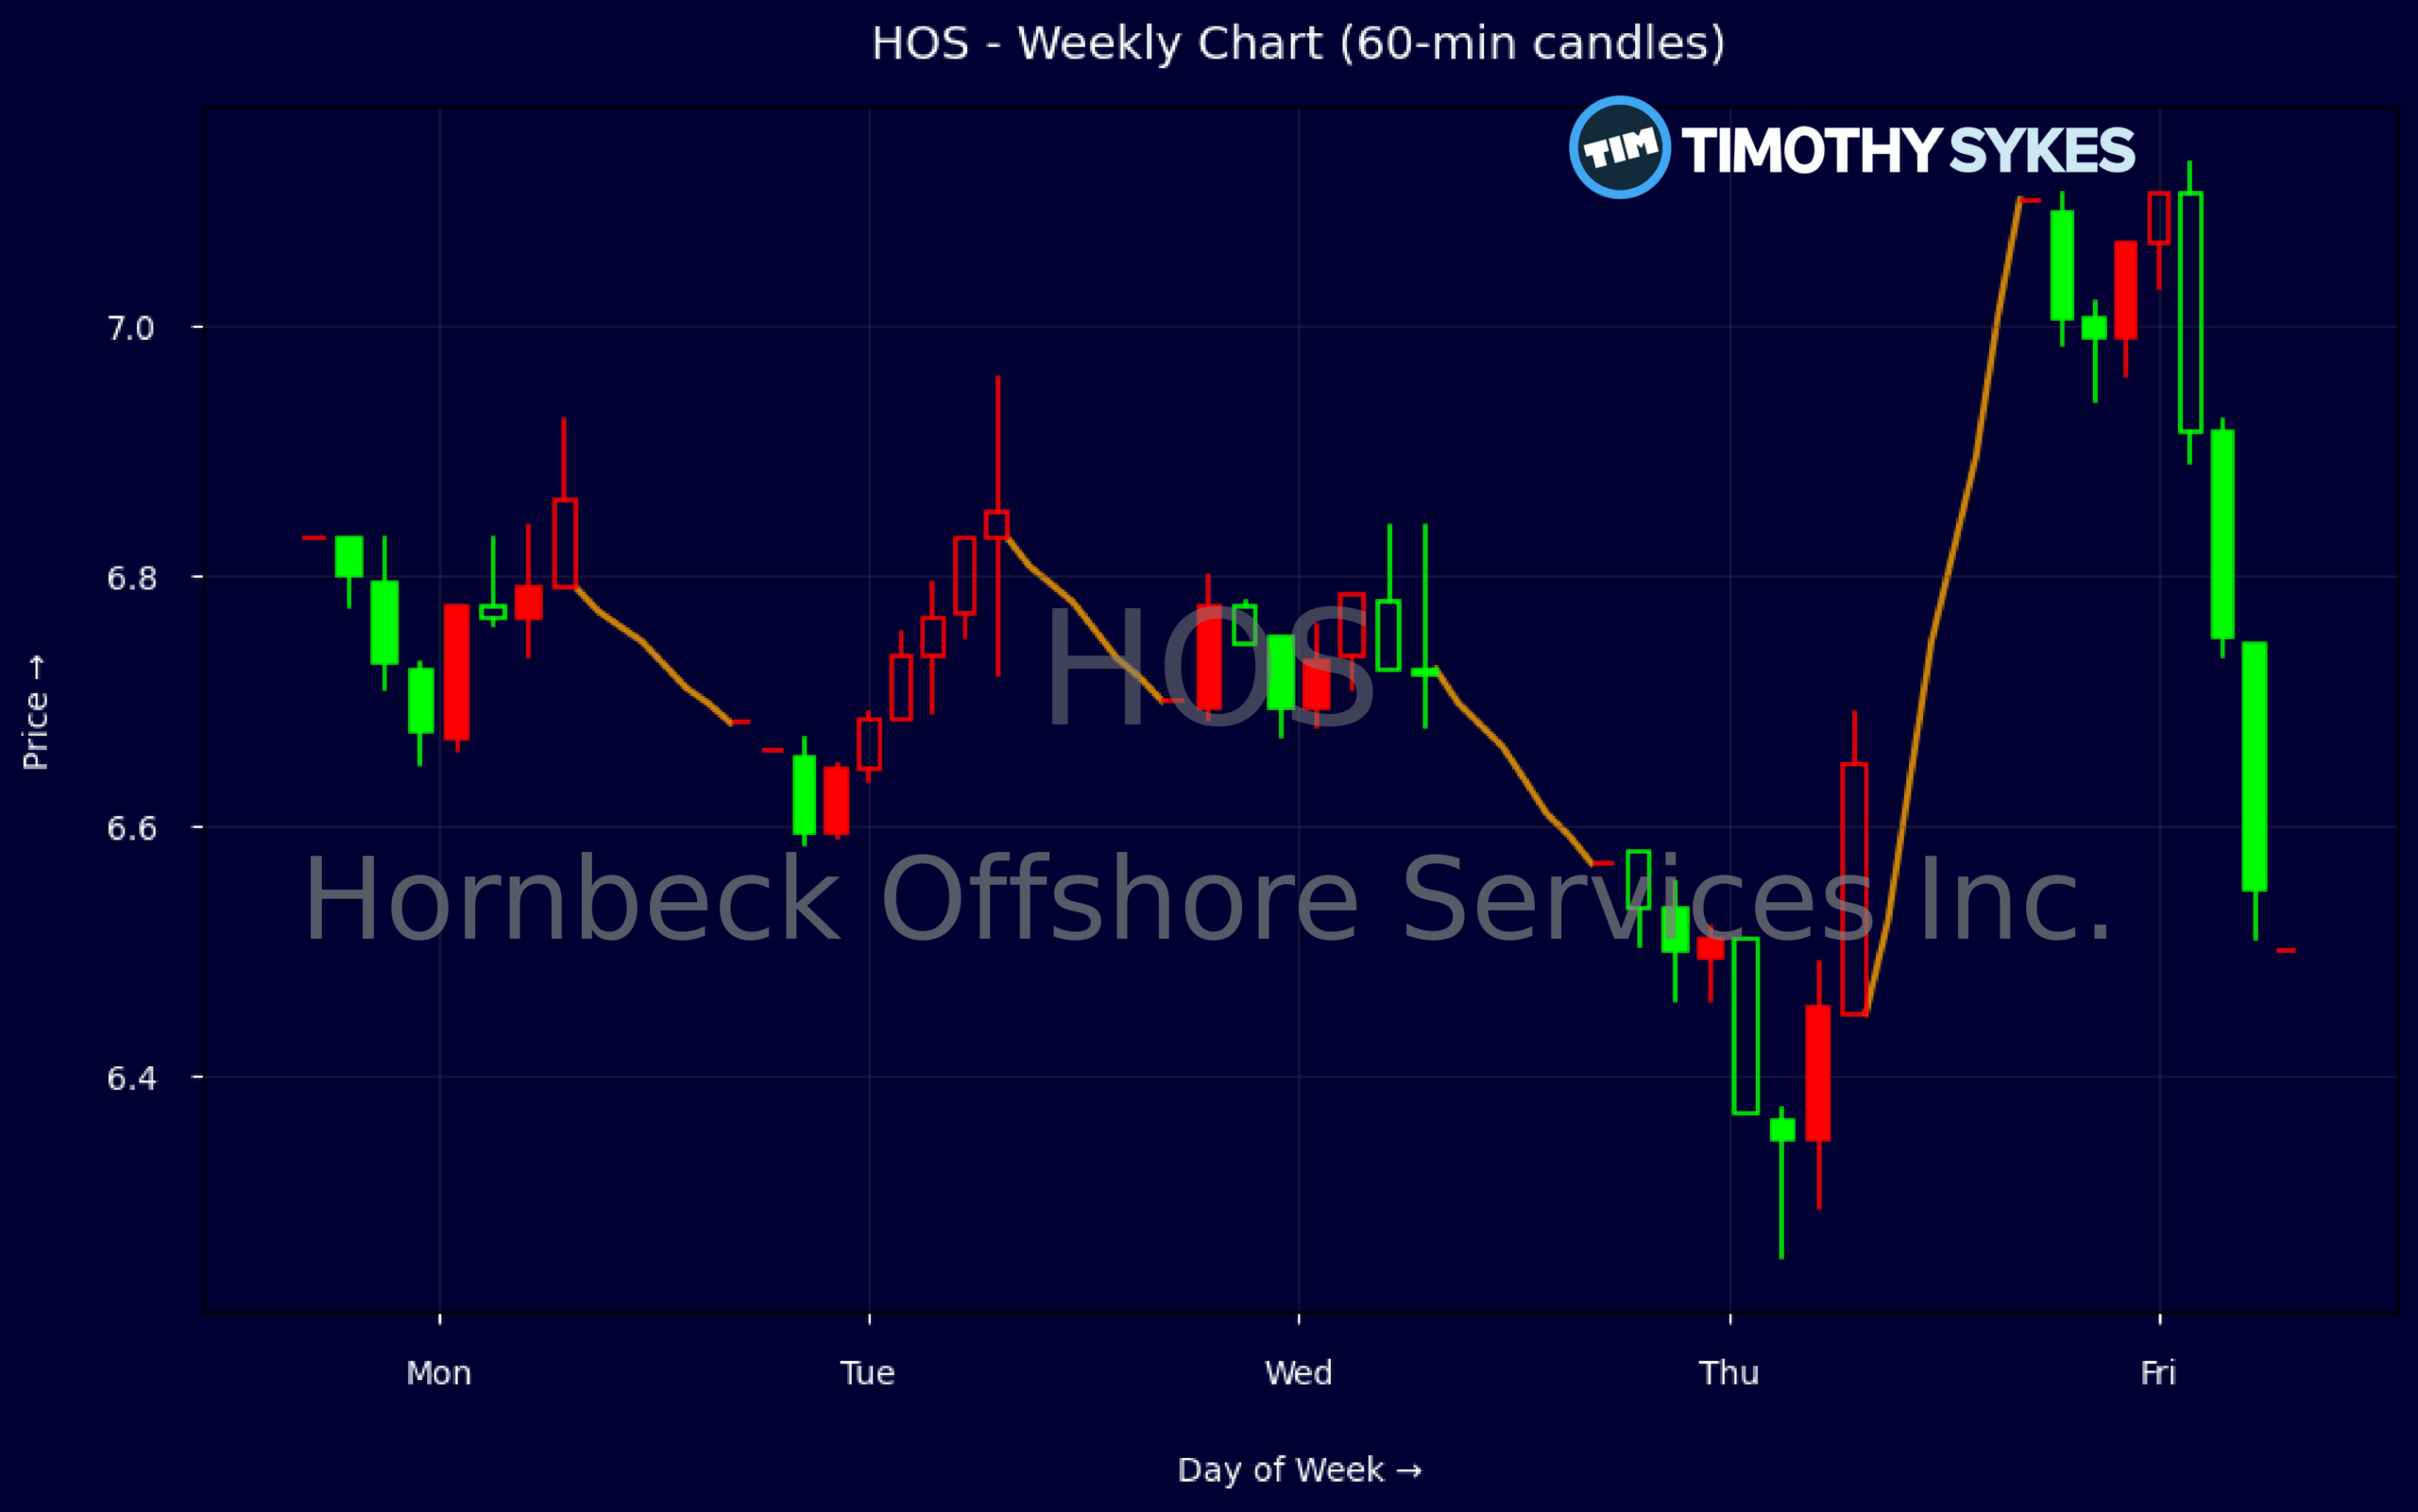
- Weekly candles sit in a tight $6.57–$7.10 band, suggesting consolidation after a steady grind higher for HOS.
- Valuation around 27.7x earnings and roughly 1.3x sales puts the stock at a premium that demands continued operational strength.
- Solid cash levels and positive free cash flow support Hornbeck Offshore Services Inc.’s ability to ride out sector swings and fund operations.
- Traders are watching whether HOS can hold above recent support in the mid-$6s to confirm this latest push as a trend, not just a spike.
Weekly Update Oct 19 – Oct 23, 2026: On Sunday, October 25, 2026 Hornbeck Offshore Services Inc. stock [NYSE: HOS] is trending up by 8.07%! Discover the key drivers behind this movement as well as our expert analysis in the detailed breakdown below.
Energy industry expert:
Analyst sentiment – positive
Hornbeck Offshore Services (HOS) sits as a niche, asset-heavy offshore support vessel operator with improving fundamentals but still cyclical earnings power. Quarterly revenue of ~$304M annualizes above the $1.29B TTM level, indicating momentum in dayrates and utilization. EBITDA of $55M and EBIT of $30.7M imply mid-teens EBITDA margin, modest but improving versus historical troughs. A P/E of 27.7 and P/S of 1.27 price in recovery, while price-to-book of ~1.05 suggests limited balance-sheet-driven downside.
Technically, weekly prints between 6.57 and 7.10 show a tight consolidation after a mild pullback, with the latest close near 7.10 signaling buyers regaining control. Intraday 5-minute candles show repeated support building around 6.60–6.70 with volume spikes on moves above 6.90, confirming accumulation rather than distribution. The dominant trend is short-term bullish within a developing base. A specific actionable level: buy against 6.60 support with a stop below 6.45 and first target at 7.75.
With no new headline catalysts, trading is being driven primarily by sector beta and offshore demand expectations. Versus broader Energy and Fossil Fuels benchmarks, HOS offers higher operational leverage to offshore upcycles but more volatility. Solid liquidity (~$652M cash) and manageable leverage support the equity case into the next contract renewal cycle. I expect outperformance versus traditional producers, with near-term resistance at 7.75 and secondary resistance near 8.50; support remains 6.60.
More Breaking News
Quick Financial Overview
Hornbeck Offshore Services Inc. (HOS) is printing constructive price action on light weekly data. Over the latest five weekly bars, the stock has traded between roughly $6.57 and $7.10, with closes clustered near the upper half of that range. That kind of tight structure usually reflects a market that is balanced but leaning bullish, as sellers fail to push price meaningfully below prior lows.
Intraday, the single 5-minute candle we have is revealing. Price opened near $6.55, flushed to about $6.51, then ripped to a high around $7.13 and closed in the $7.10 area. That is a wide intraday range with a strong close near the top, often a sign that dip buyers are in control and shorts are being forced to cover. For short-term traders, that type of bar is a classic momentum ignition signal.
Financially, Hornbeck Offshore Services Inc. is not a distressed balance sheet story. Quarterly revenue of about $304.0M against trailing revenue of roughly $1.29B shows a sizable operation. A price-to-earnings ratio of 27.67 and price-to-sales near 1.27 suggest the market already prices in a decent amount of recovery. Book value per share sits around $7.13, very close to the recent trading range, which means HOS has been hovering near book, a level many value-oriented traders track closely.
Conclusion
Hornbeck Offshore Services Inc. is giving traders a clean, data-driven setup: constructive price action backed by workable fundamentals. The weekly consolidation between the mid-$6s and just above $7 suggests HOS is building a base rather than breaking down. At the same time, that intraday surge from about $6.55 to above $7 with a strong close shows that buyers are willing to step in aggressively on small dips.
On the numbers side, steady revenue near $304.0M for the quarter and positive free cash flow of about $46.7M show that the business is generating real cash, not just accounting profits. With book value per share around $7.13 and the stock trading in that neighborhood, downside may be cushioned, but the 27.7x earnings multiple still means traders should respect valuation risk if earnings growth stalls. That’s where disciplined risk management becomes crucial. As millionaire penny stock trader and teacher Tim Sykes says, “It’s better to go home at zero than to go home in the red.”, and that mindset applies directly to managing position size and exits in a name like HOS.
For short-term players, the key levels are clear: support in the mid-$6s and resistance around $7.10–$7.20. A hold above support with rising volume would favor a momentum continuation, while a clean break back below $6.57 would warn that this was just a failed push. As I tell my students, “Your edge comes from reading what price and volume are actually doing, not from what you hope the stock will do.” This article is for educational and research purposes only.
“,”scores”:{“risk-level”:”medium”},”trade”:”true
This is stock news, not investment advice. Timothy Sykes News delivers real-time stock market news focused on key catalysts driving short-term price movements. Our content is tailored for active traders and investors seeking to capitalize on rapid price fluctuations, particularly in volatile sectors like penny stocks. Readers come to us for detailed coverage on earnings reports, mergers, FDA approvals, new contracts, and unusual trading volumes that can trigger significant short-term price action. Some users utilize our news to explain sudden stock movements, while others rely on it for diligent research into potential investment opportunities.
Dive deeper into the world of trading with Timothy Sykes, renowned for his expertise in penny stocks. Explore his top picks and discover the strategies that have propelled him to success with these articles:
- Penny Stocks Trading Guide
- Best Penny Stocks Under $1 to Buy Today
- Top 8 Penny Stocks to Watch on Robinhood
Once you’ve got some stocks on watch, elevate your trading game with StocksToTrade the ultimate platform for traders. With specialized tools for swing and day trading, StocksToTrade will guide you through the market’s twists and turns.
Dig into StocksToTrade’s watchlists here:




Leave a reply