

Dreamland Limited stocks have been trading up by 18.01 percent following news of a transformative new product launch.
Key Takeaways
- TDIC has retreated from early-October spike highs above $3 to the mid-$1 range, with recent trading tightening around $1.50.
- Dreamland Limited shows roughly $51.3M in cash and short-term investments against $18.6M in total debt, giving TDIC runway despite heavy leverage.
- Chart action in TDIC suggests a momentum fade, but intraday candles show active day trading interest and clear scalp ranges.
- Valuation on TDIC is low versus sales, yet negative returns on capital flag execution and efficiency concerns for medium-term traders.
Live Update At 07:48:12 EDT: On Tuesday, October 27, 2026 Dreamland Limited stock [NASDAQ: TDIC] is trending up by 18.01%! Discover the key drivers behind this movement as well as our expert analysis in the detailed breakdown below.
Quick Financial Overview
TDIC, the ticker for Dreamland Limited, is trading like a momentum name that lost its steam. Earlier in October, TDIC pushed as high as the $3 area, closing at $2.28 on 2026/10/14 after a huge intraday spike from $1.68. Since then, the stock has bled lower. Over the latest stretch, TDIC has slipped from $2.14 on 2026/10/02 to around $1.50 on 2026/10/26, a pullback of roughly 30%. That’s a big reset for short-term traders.
On the fundamentals, Dreamland Limited reported revenue of about $50.7M, with TDIC trading at roughly 0.91 times sales. That’s a low price-to-sales ratio for a speculative name, but the quality of those earnings matters. Book value per share sits near $1.64, while TDIC trades just below that level, signaling the market is discounting the balance sheet.
More Breaking News
Debt and leverage stand out. Dreamland Limited carries about $10.2M in long-term debt and $8.6M in current debt, while cash and equivalents are roughly $20.5M and total cash plus short-term investments reach about $51.3M. The leverage ratio near 15 and a brutal -305% return on capital tell traders that TDIC has serious efficiency issues to fix.
Why Traders Are Watching TDIC Price Action
TDIC remains on many watchlists because the chart shows what active traders like: volatility, failed breakouts, and clear levels. Dreamland Limited exploded on 2026/10/14 with a high of $3.90 before closing at $2.28. That kind of range attracts momentum traders, but TDIC couldn’t hold those gains. Over the next sessions, TDIC slipped into a pattern of lower highs, with closes marching down from the $2.20s into the $1.60–$1.70 zone, then to $1.50.
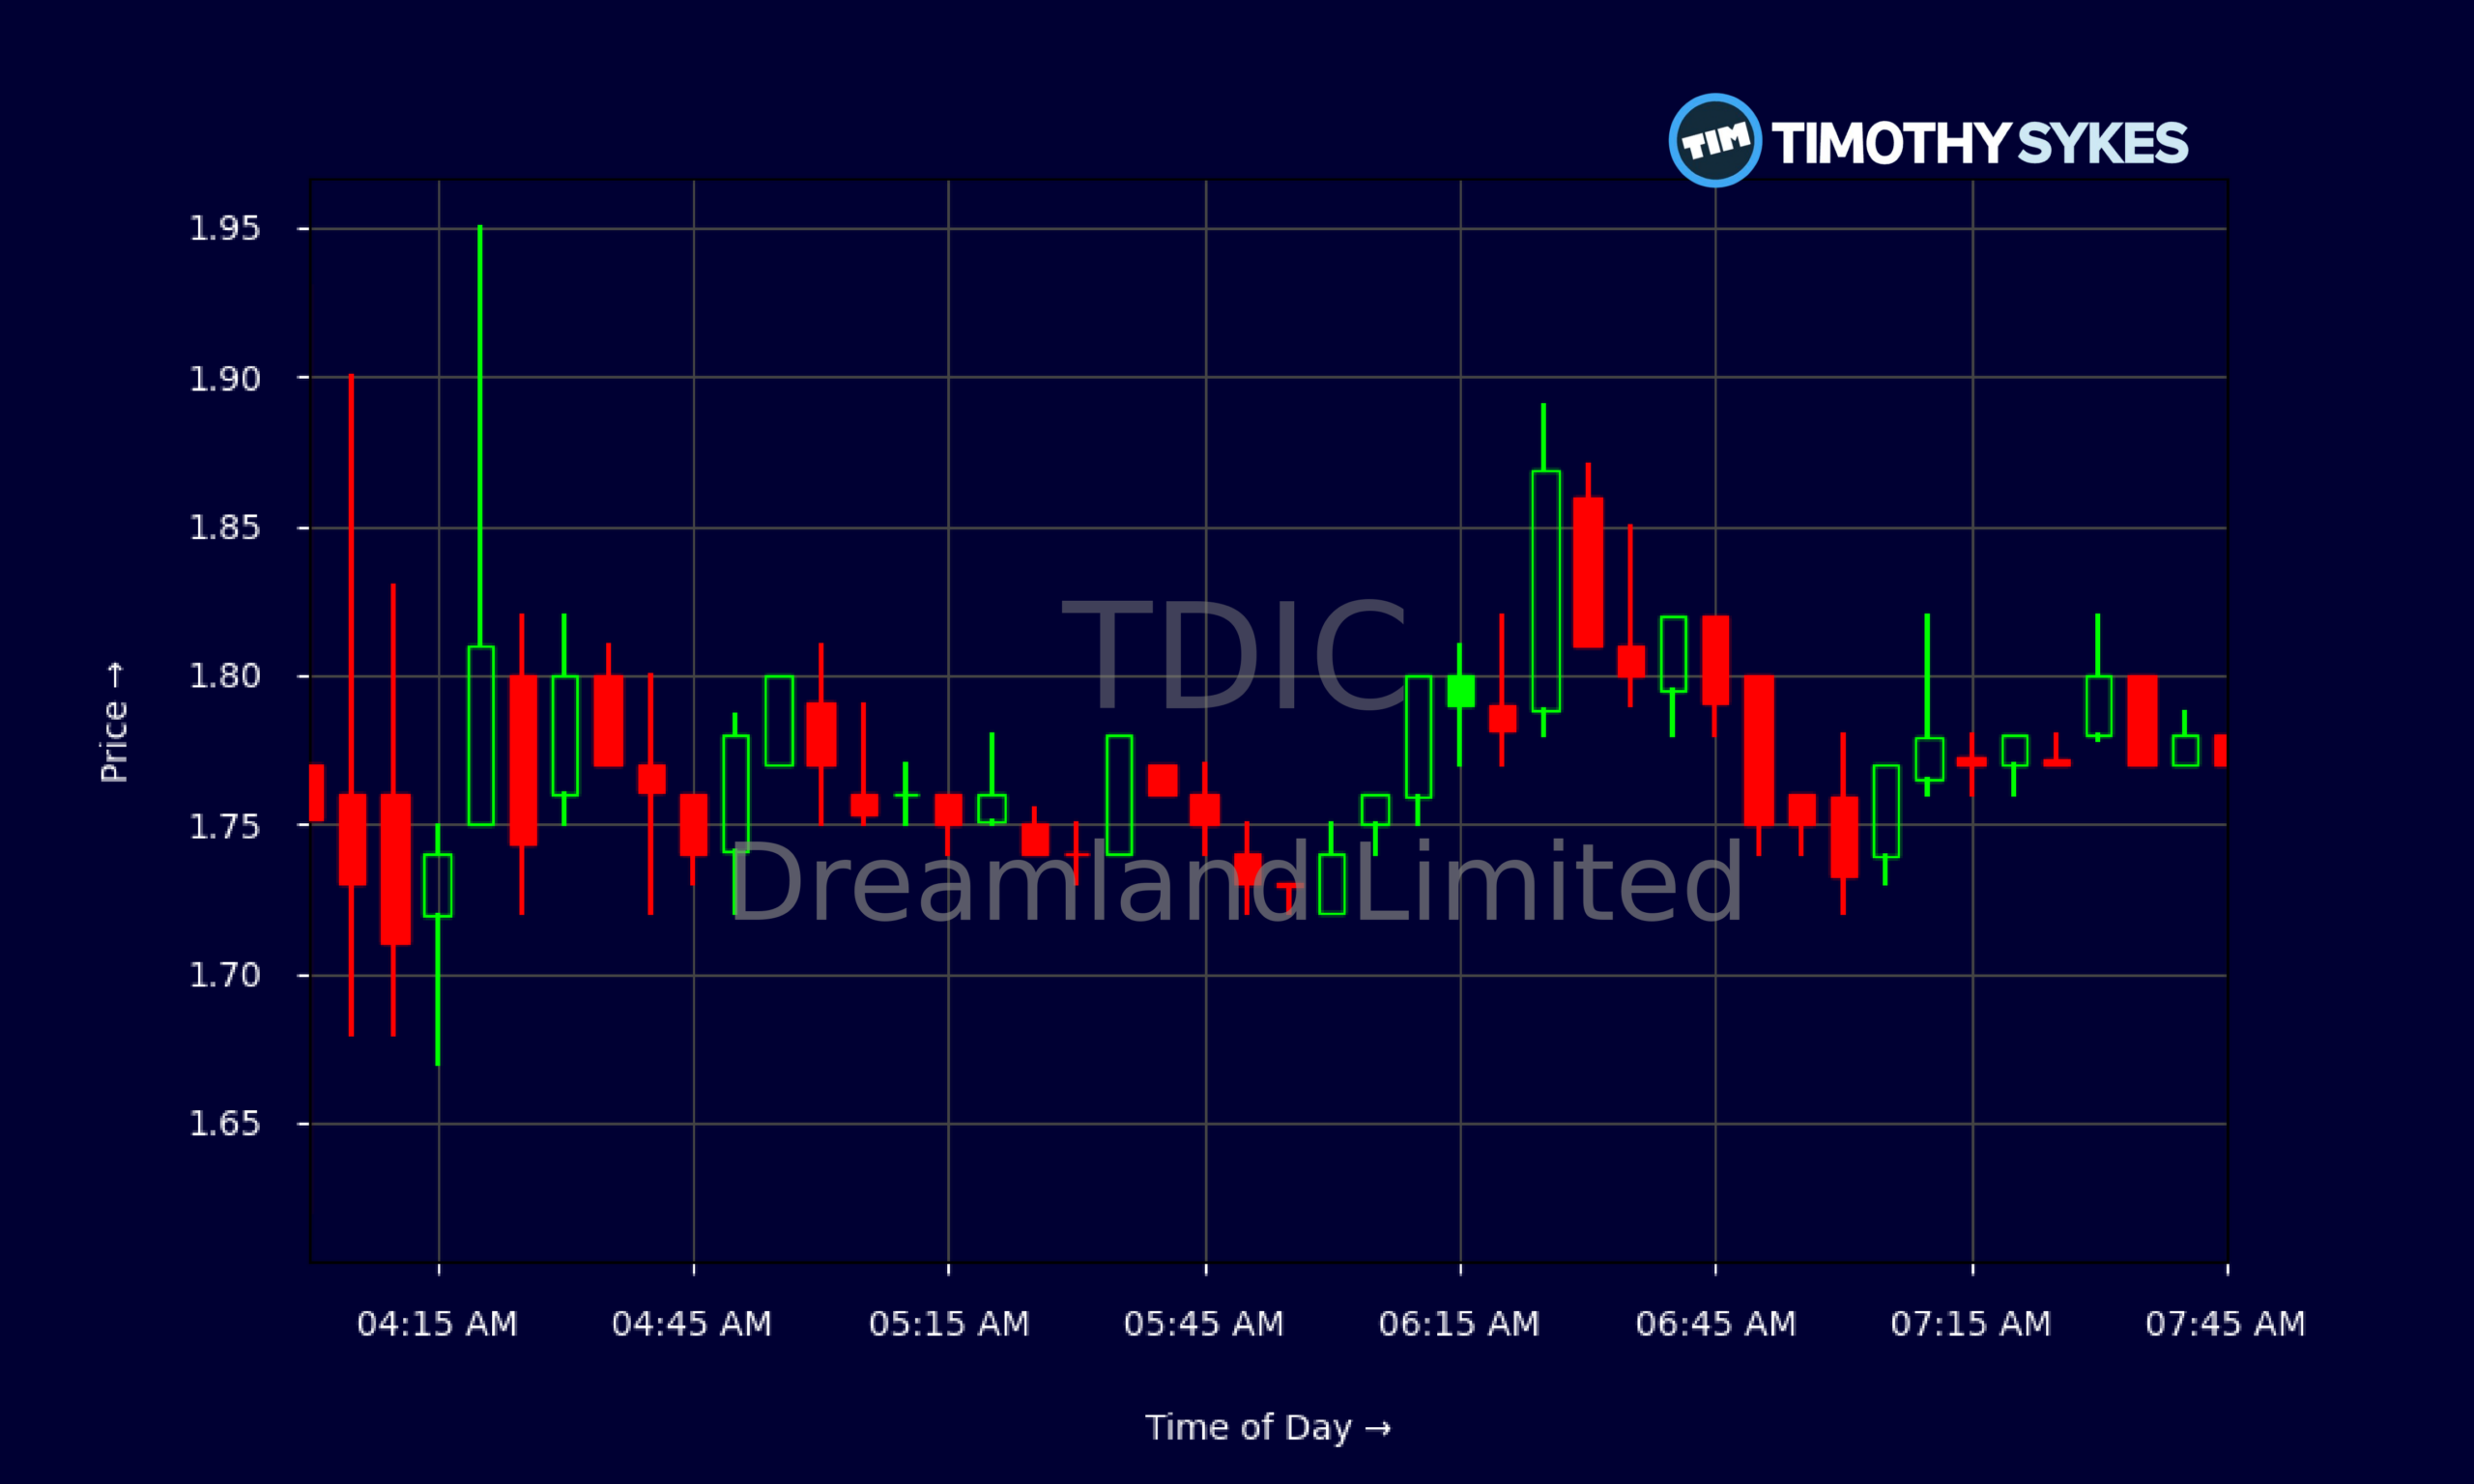
For short-term traders, that breakdown matters more than any story. TDIC is now trading under key recent support around $1.70. Each bounce toward that area has been sold, showing supply overhead. The intraday 5-minute chart backs this up. TDIC has been stuck mostly between about $1.72 and $1.87, with repeated pushes into the $1.80s getting slapped back. That’s classic range-bound action where scalpers play the edges, but swing traders stay cautious.
Under the surface, Dreamland Limited’s financials line up with what the chart is signaling. The company has decent liquidity, with strong cash balances compared to near-term obligations, so TDIC isn’t trading like it’s on the brink. But the ugly return on capital and high leverage ratio hint that Dreamland Limited has been burning resources without generating strong returns. Traders reading TDIC will see a name with room to maneuver financially, yet no clear sign of efficient growth. That tension helps explain why TDIC can spike hard, but struggles to trend.
Conclusion
TDIC is a textbook example of why traders must respect both charts and numbers. Dreamland Limited offers a mix of solid cash reserves and heavy leverage, wrapped in a stock that already gave back a huge momentum move. TDIC is now below key short-term support, trading under book value, and bouncing around in tight intraday ranges. That setup tells traders the easy long-side run is over, at least for now, and the stock is searching for a new equilibrium.
For day traders, TDIC still has opportunity. The 5-minute action in TDIC shows repeatable swings between the low $1.70s and high $1.80s. Those who know how to cut losses quickly and avoid chasing can grind out trades inside that box. As millionaire penny stock trader and teacher Tim Sykes says, “Be patient, don’t force trades, and let the perfect setups come to you.”. For swing traders, Dreamland Limited probably demands patience and strict risk control. The negative return on capital and leverage profile mean TDIC needs real operational improvement before the market rewards it with a sustained uptrend.
This is exactly the kind of situation Tim Sykes and Tim Bohen talk about when they say, “The market doesn’t care about your opinion, it cares about price action and risk.” TDIC is offering both right now. Traders studying Dreamland Limited should focus on support and resistance, volume spikes, and whether TDIC can reclaim the $1.70–$1.80 zone with strength. Until that happens, treating TDIC as a short-term trading vehicle, not a long-term story, keeps the odds on your side.
This is stock news, not investment advice. Timothy Sykes News delivers real-time stock market news focused on key catalysts driving short-term price movements. Our content is tailored for active traders and investors seeking to capitalize on rapid price fluctuations, particularly in volatile sectors like penny stocks. Readers come to us for detailed coverage on earnings reports, mergers, FDA approvals, new contracts, and unusual trading volumes that can trigger significant short-term price action. Some users utilize our news to explain sudden stock movements, while others rely on it for diligent research into potential investment opportunities.
Dive deeper into the world of trading with Timothy Sykes, renowned for his expertise in penny stocks. Explore his top picks and discover the strategies that have propelled him to success with these articles:
- Penny Stocks Trading Guide
- Best Penny Stocks Under $1 to Buy Today
- Top 8 Penny Stocks to Watch on Robinhood
Once you’ve got some stocks on watch, elevate your trading game with StocksToTrade the ultimate platform for traders. With specialized tools for swing and day trading, StocksToTrade will guide you through the market’s twists and turns.
Dig into StocksToTrade’s watchlists here:





Leave a reply