

Almonty Industries Inc. stocks have been trading down by -9.26 percent amid heightened concern over project financing and production delays.
Key Takeaways
- Price action in ALM shows a steady pullback from the mid-$13s to below $9, with rising volatility attracting short-term trading interest.
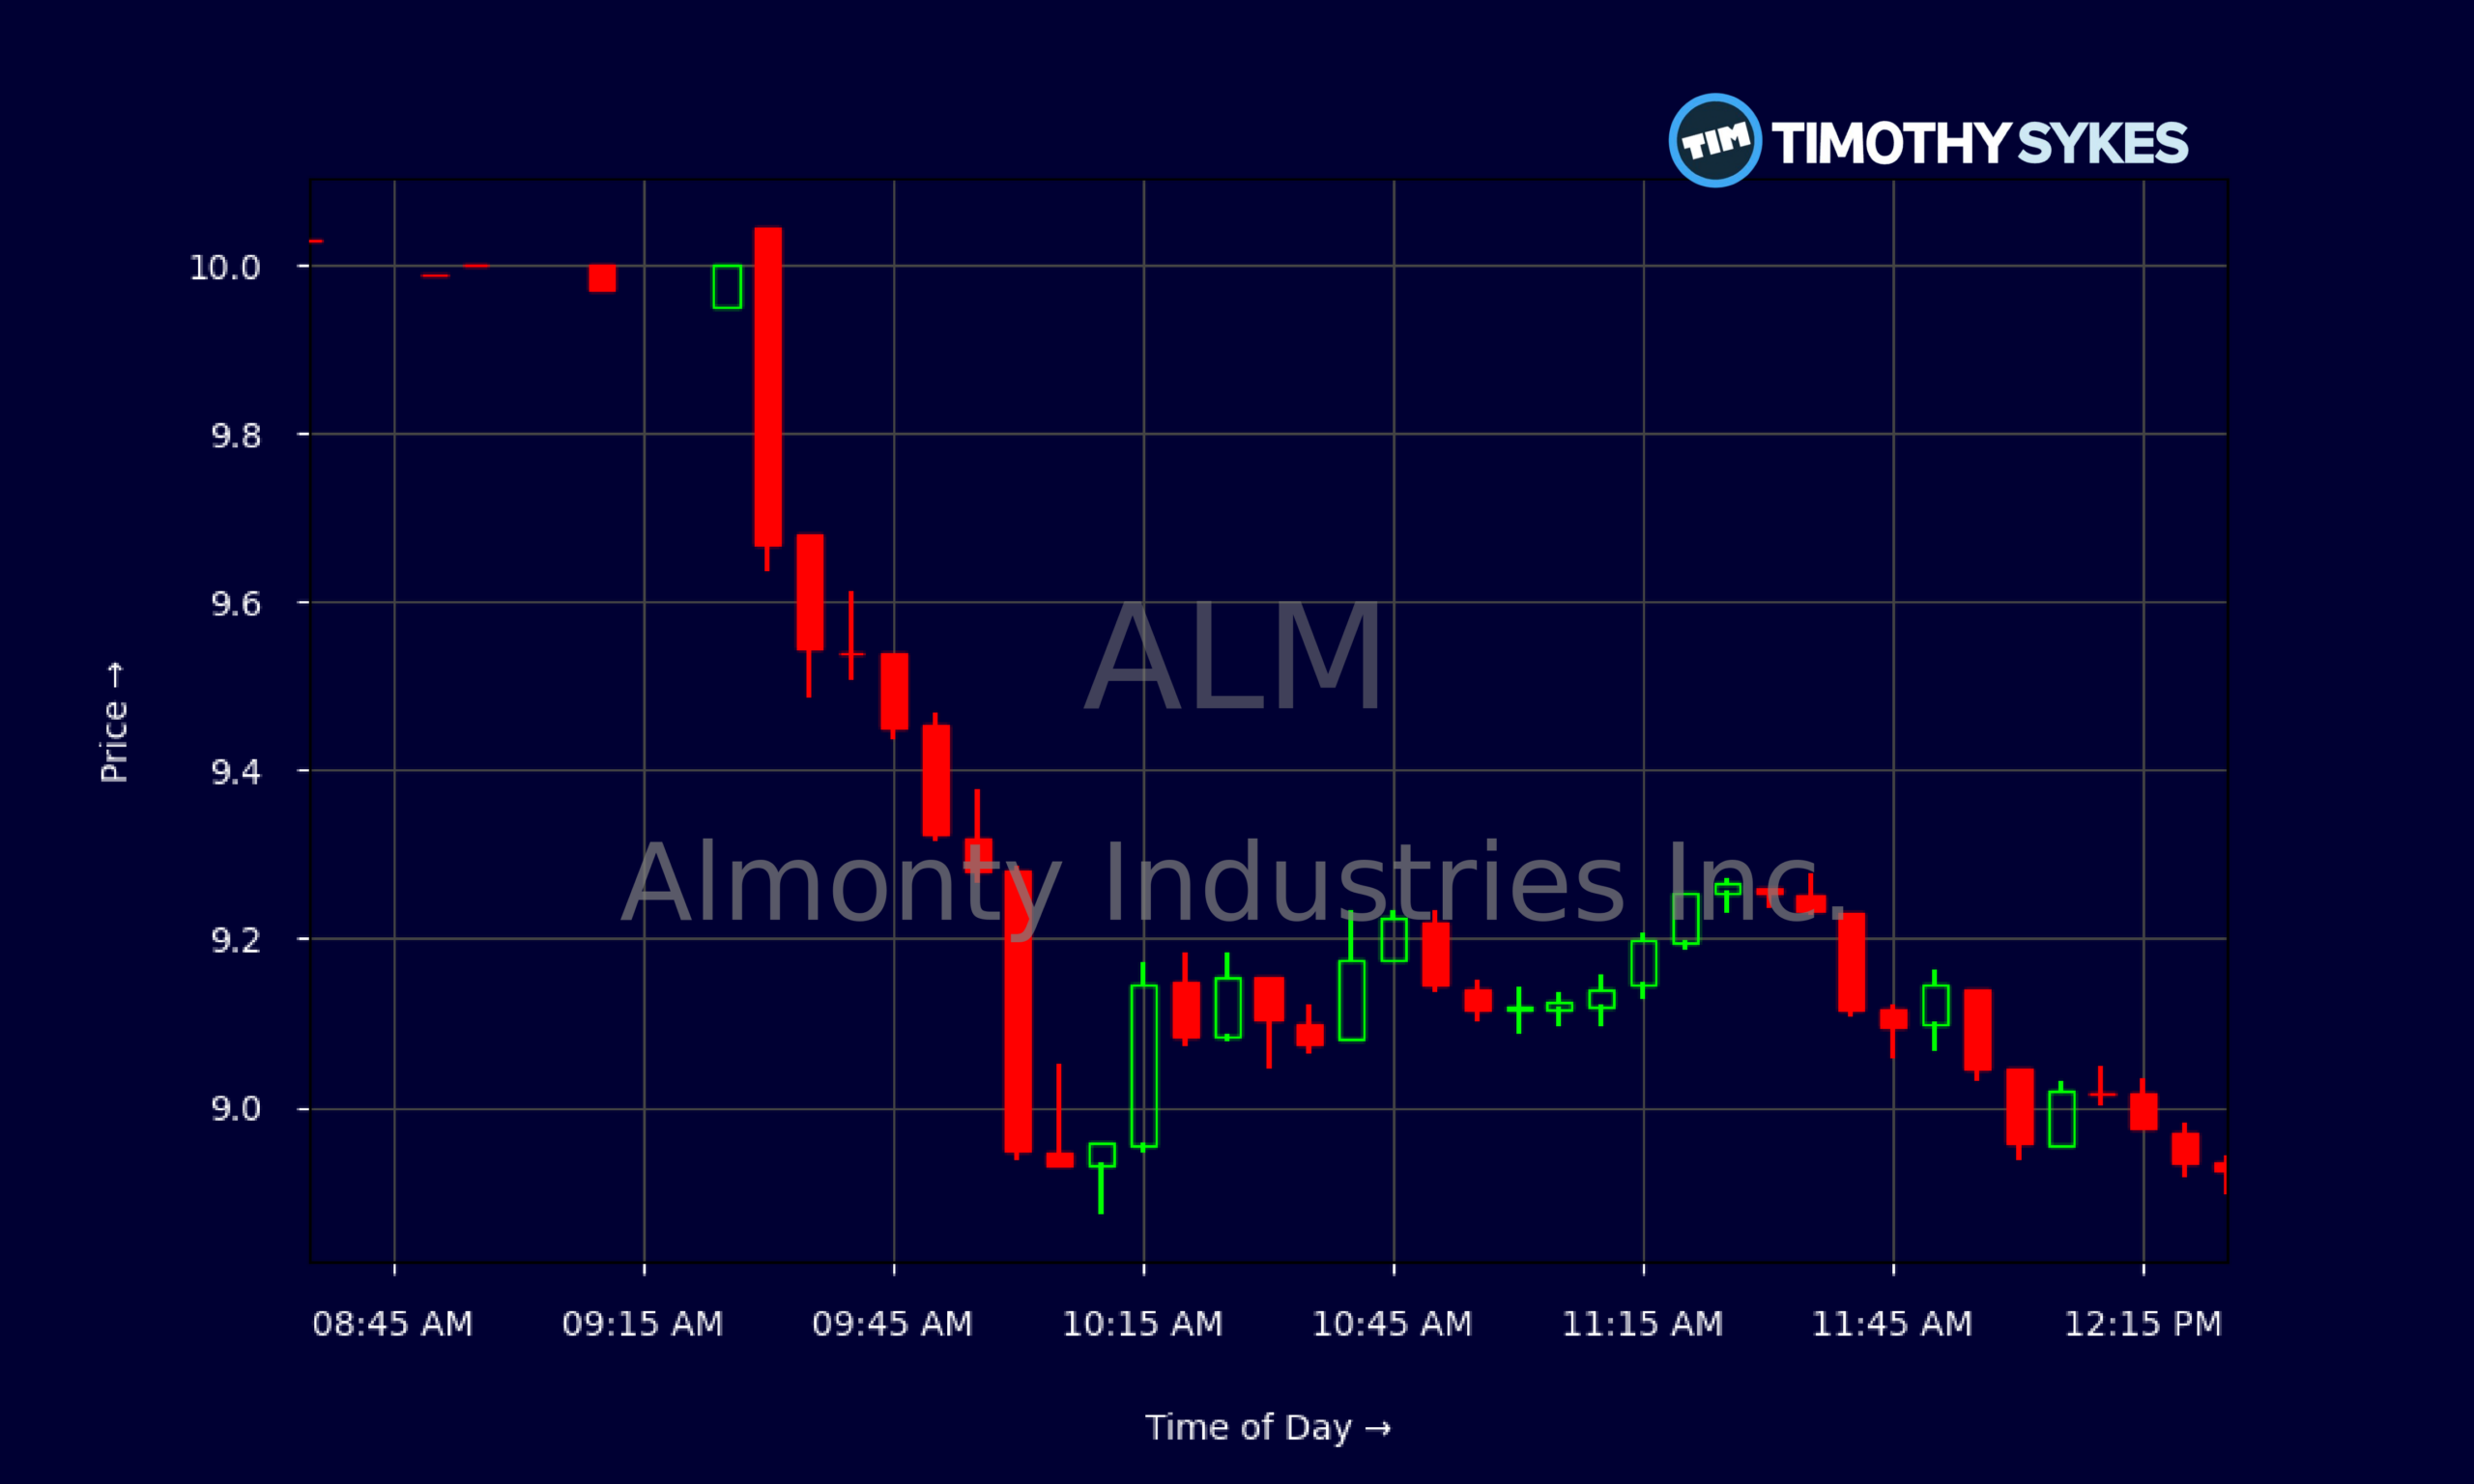
- Intraday, ALM opened near $10 and sold off toward the high-$8s, signaling clear selling pressure and potential overhang from recent buyers.
- Almonty Industries Inc. reports strong revenue growth and thick gross margins, but the stock trades at rich price-to-sales and price-to-book multiples.
- ALM holds a large cash pile versus current liabilities, giving the company runway but also raising questions about capital allocation.
- Traders are watching whether ALM can stabilize above recent lows or if momentum continues to favor the downside in the near term.
Live Update At 12:32:16 EDT: On Monday, October 19, 2026 Almonty Industries Inc. stock [NASDAQ: ALM] is trending down by -9.26%! Discover the key drivers behind this movement as well as our expert analysis in the detailed breakdown below.
Quick Financial Overview
Almonty Industries Inc., trading under ticker ALM, is showing a classic tug-of-war between strong fundamentals and stretched valuation. On the income side, ALM posted roughly $43.0M in quarterly revenue with a fat gross margin near 49%. That kind of margin tells traders the core business has pricing power, which matters in a cyclical metals and mining environment.
ALM also printed about $181.8M in net income for the period, driven in part by gains on securities, and EBITDA near $194.1M. That’s big money compared to current sales and explains why ALM’s profitability ratios look wild. But traders should dig deeper: headline return metrics are inflated by one-off gains, not just operating strength.
On the balance sheet, ALM holds about $1.22B in cash and short-term investments against total liabilities near $1.15B. Current assets tower over current liabilities, with a current ratio near 9.6. In simple terms, Almonty Industries Inc. is liquid and has room to maneuver.
More Breaking News
The flip side: ALM trades at a price-to-sales above 55 and price-to-book around 8.6. Those levels tell traders the market already priced in a lot of future success, which makes any technical breakdown important to respect.
Why Traders Are Watching ALM’s Pullback
ALM’s chart is where the story gets interesting. On the daily time frame, Almonty Industries Inc. has slipped from recent highs around $13.70–$14 down to the high-$8s. That’s a drop of roughly one-third in a short window. For active traders, that kind of move screams opportunity, but also risk.
The recent close near $8.92 caps a clear downtrend: a sequence of lower highs from $13.72 to $13.52, then $13.40, $13.18, and so on, followed by accelerating downside into the $9s and now below $9. ALM has broken through prior support areas one by one, showing that dip buyers were not strong enough to absorb supply.
Zooming into the intraday action, ALM opened premarket and early regular hours around $10. The stock tried to push above that level at the open, hit $10.045, then quickly faded. From there, the tape shows a steady grind down into the mid-$9s, followed by another leg lower into the $8.90s. Every bounce was short-lived, with sellers hitting ALM on strength.
For short-term traders, this intraday pattern — lower highs, steady pressure, and closing near the session low — points to control by the bears. For swing traders, ALM is testing whether this is a simple retrace within a bigger uptrend from earlier in the year, or the start of a deeper re-pricing of the stock’s rich multiples. The combination of high valuation, big prior run, and now heavy selling makes Almonty Industries Inc. a name to stalk carefully, not chase blindly.
Conclusion
ALM is a textbook case of a strong story stock meeting gravity. On paper, Almonty Industries Inc. looks powerful: high margins, rapid revenue growth, positive free cash flow around $6.8M, and a massive cash cushion above $1.22B that dwarfs short-term debt. Leverage is meaningful, but interest coverage is solid, and the current ratio leaves room for error.
But markets trade expectations, not just numbers. With ALM sporting a price-to-sales above 55 and price-to-book near 8.6, traders are no longer paying for what Almonty Industries Inc. is today — they are paying up for what they hope it becomes. When a stock like ALM starts to crack from $13+ down to the high-$8s, that’s the market re-testing just how much future growth it really wants to price in.
For active traders, the plan is simple: respect the trend, define your risk, and let the chart guide your timing. Intraday, ALM is showing clear resistance near $10 and fading strength throughout the session. Until Almonty Industries Inc. proves it can reclaim and hold key levels, strength remains a spot for disciplined profit-taking or tight, tactical trades — not hope. As Tim Sykes loves to remind his community, “The market doesn’t owe you anything — trade the price action, cut losses quickly, and let the hype pass you by.” As millionaire penny stock trader and teacher Tim Sykes, says, “Consistency is key in trading; don’t let emotions dictate your trades.”.
This is stock news, not investment advice. Timothy Sykes News delivers real-time stock market news focused on key catalysts driving short-term price movements. Our content is tailored for active traders and investors seeking to capitalize on rapid price fluctuations, particularly in volatile sectors like penny stocks. Readers come to us for detailed coverage on earnings reports, mergers, FDA approvals, new contracts, and unusual trading volumes that can trigger significant short-term price action. Some users utilize our news to explain sudden stock movements, while others rely on it for diligent research into potential investment opportunities.
Dive deeper into the world of trading with Timothy Sykes, renowned for his expertise in penny stocks. Explore his top picks and discover the strategies that have propelled him to success with these articles:
- Penny Stocks Trading Guide
- Best Penny Stocks Under $1 to Buy Today
- Top 8 Penny Stocks to Watch on Robinhood
Once you’ve got some stocks on watch, elevate your trading game with StocksToTrade the ultimate platform for traders. With specialized tools for swing and day trading, StocksToTrade will guide you through the market’s twists and turns.
Dig into StocksToTrade’s watchlists here:





Leave a reply