
Let’s get some administrative details out of the way before I hop into the top penny stocks July 2019 . …
Please go back and read Top Penny Stocks to Watch in June. It explains my thoughts on “hot stock picks” and why I adapt to the market rather than memorize patterns.
In a nutshell:
- It’s more important for you to understand the process of making a watchlist than to get so-called hot picks from me. Or anyone else.
- Your goal should be to become a self-sufficient trader. Don’t follow my alerts — except to understand my thought process.
- Learn to recognize patterns but also be able to recognize when they aren’t working.
- I provide a daily watch list to Trading Challenge students. Stocks come and go. I teach trading, not investing. Join the challenge to get my daily watchlist.
- Do your own research. It’s much better for you to understand why I’ve put a stock on the list than to blindly think it’s a potential trade.

Table of Contents
The Broader Market : Top Penny Stocks July 2019
We just witnessed one of the biggest middle-finger salutes to the old saying “Sell in May and go away” in history.
The markets were not only up in June…
- The NASDAQ composite recorded its best June in nearly two decades.
- The Dow Jones Industrial Average recorded its best June in 81 years.
- The S&P 500 posted the best June since 1955. That’s 64 years.
Wow.
Just as the beginning of May was the start of a month-long slide, June signaled a clear reversal.
For example, except for June 3, the market shot up every day the first week of the month. The second week we saw healthy consolidation, and the third week, another pop. The month ended with a red week. But overall the markets held gains for the month — and the year.
Here’s a 1-year chart of the SPDR S&P 500 Trust ETF (NYSE: SPY):
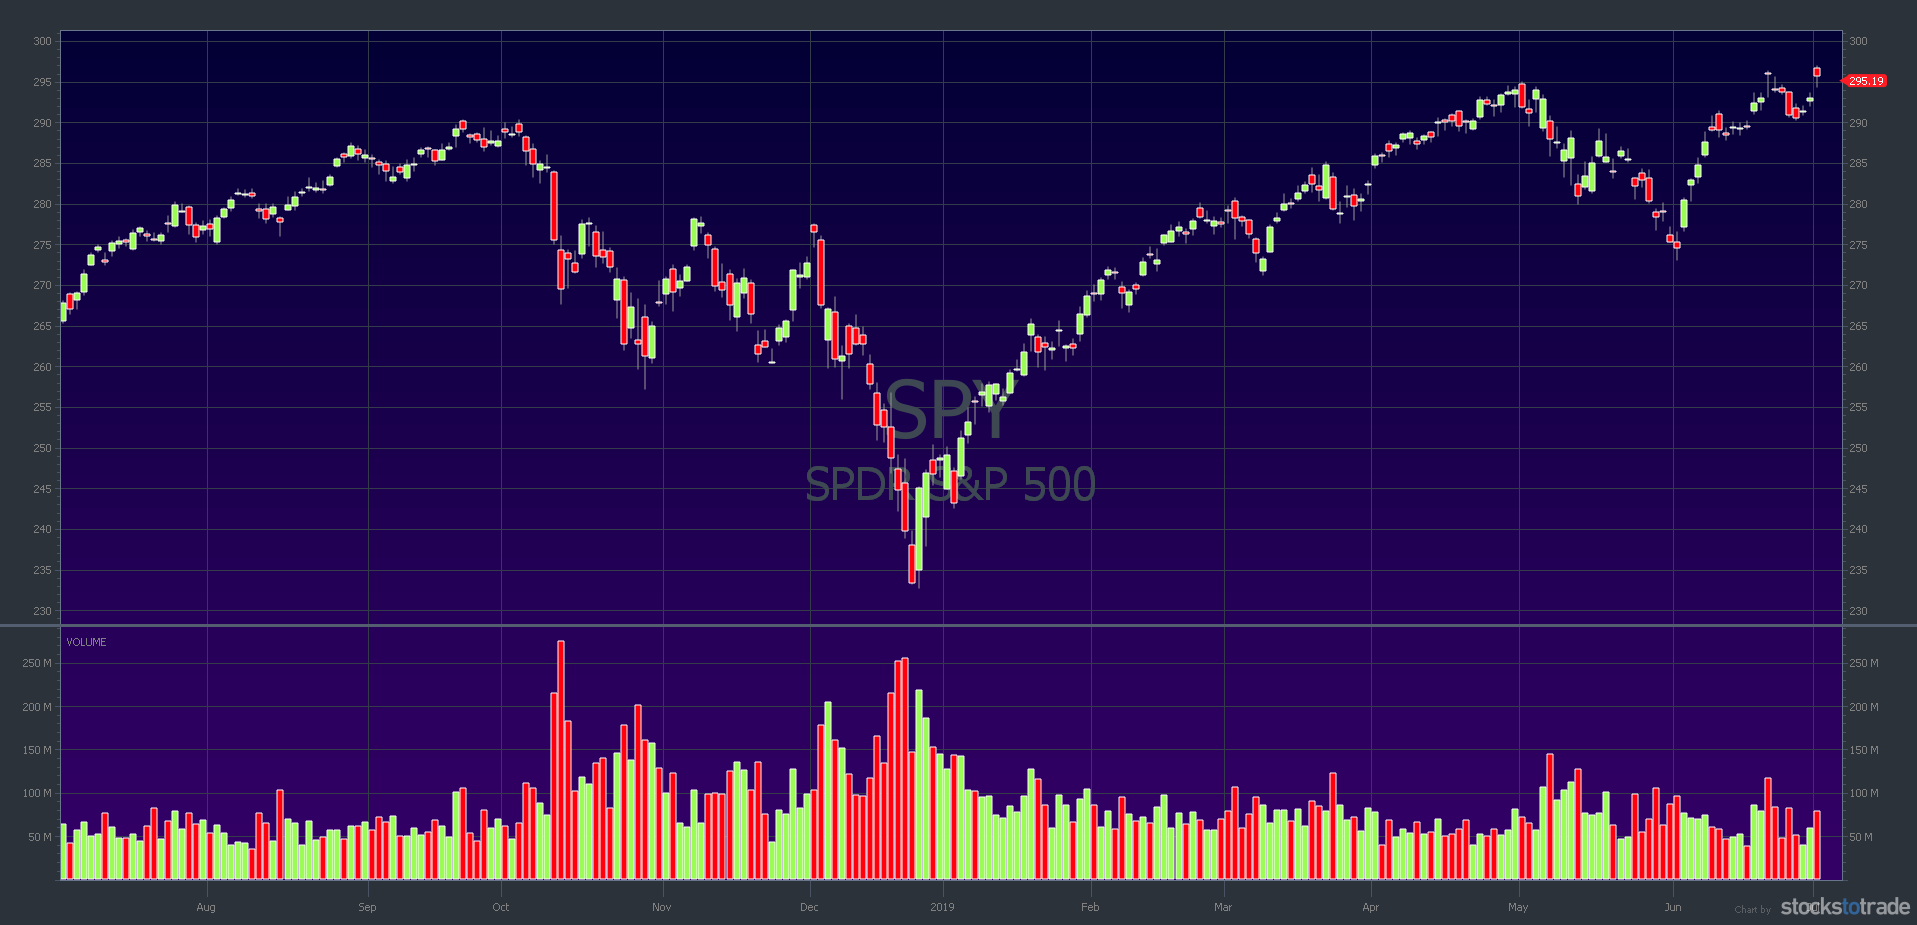
U.S. Markets Testing All-Time Highs — Again

Last month I mentioned the S&P looked like a possible double top. Now the markets are once again testing all-time highs.
I also said we’re only one China trade-deal away from a possible breakout. Things haven’t changed too much in that respect. We did get news out of the G20 summit in Japan that the U.S. and China will restart trade negotiations. That’s positive. Now we wait and see.
Penny Stock Trading in the Current Market
As always, I adapt my trading to what’s actually happening rather than a prediction. I also adjust based on my personal schedule. I don’t force trades. June was no different.
I only took 15 trades during the month because I didn’t see many of my favorite setups. And … my personal schedule didn’t fit very well. I spent a good part of the month in time zones that make trading the U.S. markets tough — like Japan and Hawaii.
That might seem counter intuitive since the market was up. Welcome to trading. There’s a lot about it that’s counterintuitive.
Now, before I give you my top penny stocks to watch in July 2019, let’s recap the picks from June. This will give you an idea of how fast things can change with penny stocks.
Recap: June 2019 Top Penny Stocks to Watch
- Soliton, Inc. (NASDAQ: SOLY) went supernova on May 28 and 29. Newbie shorts got squeezed as it ran from $5.82 all the way to $29. In June it was choppy. It found support around $14, but on July 1 it cracked below support.
- Obalon Therapeutics, Inc. (NASDAQ: OBLN) spiked in May based on the release of expanded clinical data and rumors of a buyout bid by Johnson & Johnson (NYSE: JNJ). The stock pretty much tanked for the entire month. From its June 3 high of $1.58, OBLN dropped roughly 54% and is trading in the 70-cent range.
- Eltek Ltd. (NASDAQ: ELTK) was a possible dip buy for me in June based on its drop of nearly 50% off of May highs. ELTK spent most of June downtrending. It had one notable morning spike on June 10 but still closed down for the day. The stock seems to be holding historical support in the high $3s to low $4s.
- Legacy Reserves, Inc. (NASDAQ: LGCY) was the darling of the market on June 3. It spiked roughly 540% on news the company reached forbearance agreements with its lenders. On June 18, Legacy filed for Chapter 11 bankruptcy with outstanding debts of roughly $1.68 billion.
- Castor Maritime Inc. (NASDAQ: CTRM) spiked on earnings news. CTRM has a history of failed one-day spikes. This time was no different. After its initial pre-market spike on June 4, it tanked. By the end of trading on June 5, CTRM was back to pre-spike levels and is trading in the low $4 range.
More Breaking News
- MRVL Stock Slides As WSB Chip Momentum Unwinds Premarket
- LASE Stock Rockets As Defense Orders Ignite Trading Frenzy
- TE Stock Pulls Back As T1 Energy Inc. Volatility Spikes
- WCT Stock Whipsaws As Traders Target Volatile Moves
Trading Lessons From the June 2019 Recap
Remember, most of these companies are terrible. Most will go bankrupt. That’s why I trade the ticker rather than invest in the company. LGCY bagholders from June 3 got stuffed. Bagholders on any of these stocks got stuffed, but the LGCY bagholders got the worst of it.
Take the time to study the charts of these stocks. See how they performed. Study history to learn patterns.

Timothy Sykes’ Top Penny Stocks July 2019
Again, the stocks on the list made it because of the lessons they provide. They might not be in play by the time you read this. That’s the beauty of penny stocks.
How I Pick Stocks for My Watchlist
Every day I look for the top percent gainers. Whether it’s at night or pre-market depends on my schedule/time zone. Then I sort them in order based on volume traded. After that, I look at long-term charts, company profiles, etc. I always look for the news catalyst. Sometimes there isn’t a good catalyst, which makes me more cautious.
With a monthly watchlist, it’s not much different since I don’t stay in trades long-term. I did choose three gradually uptrending stocks with multi-month runups for this list. Even though they move slowly, they could break out any day with the right news and volume. We’ll start with those.
Digital Turbine Inc. (NASDAQ: APPS)
Digital Turbine has a nice looking long-term chart. It’s been uptrending since November 2018. The company provides software to the mobile industry. Clients include original equipment manufacturers (OEM), advertisers, and app developers. The chart shows the stock has the ability to hold gains and is trading near multi-year highs.
Check out the 1-year chart:
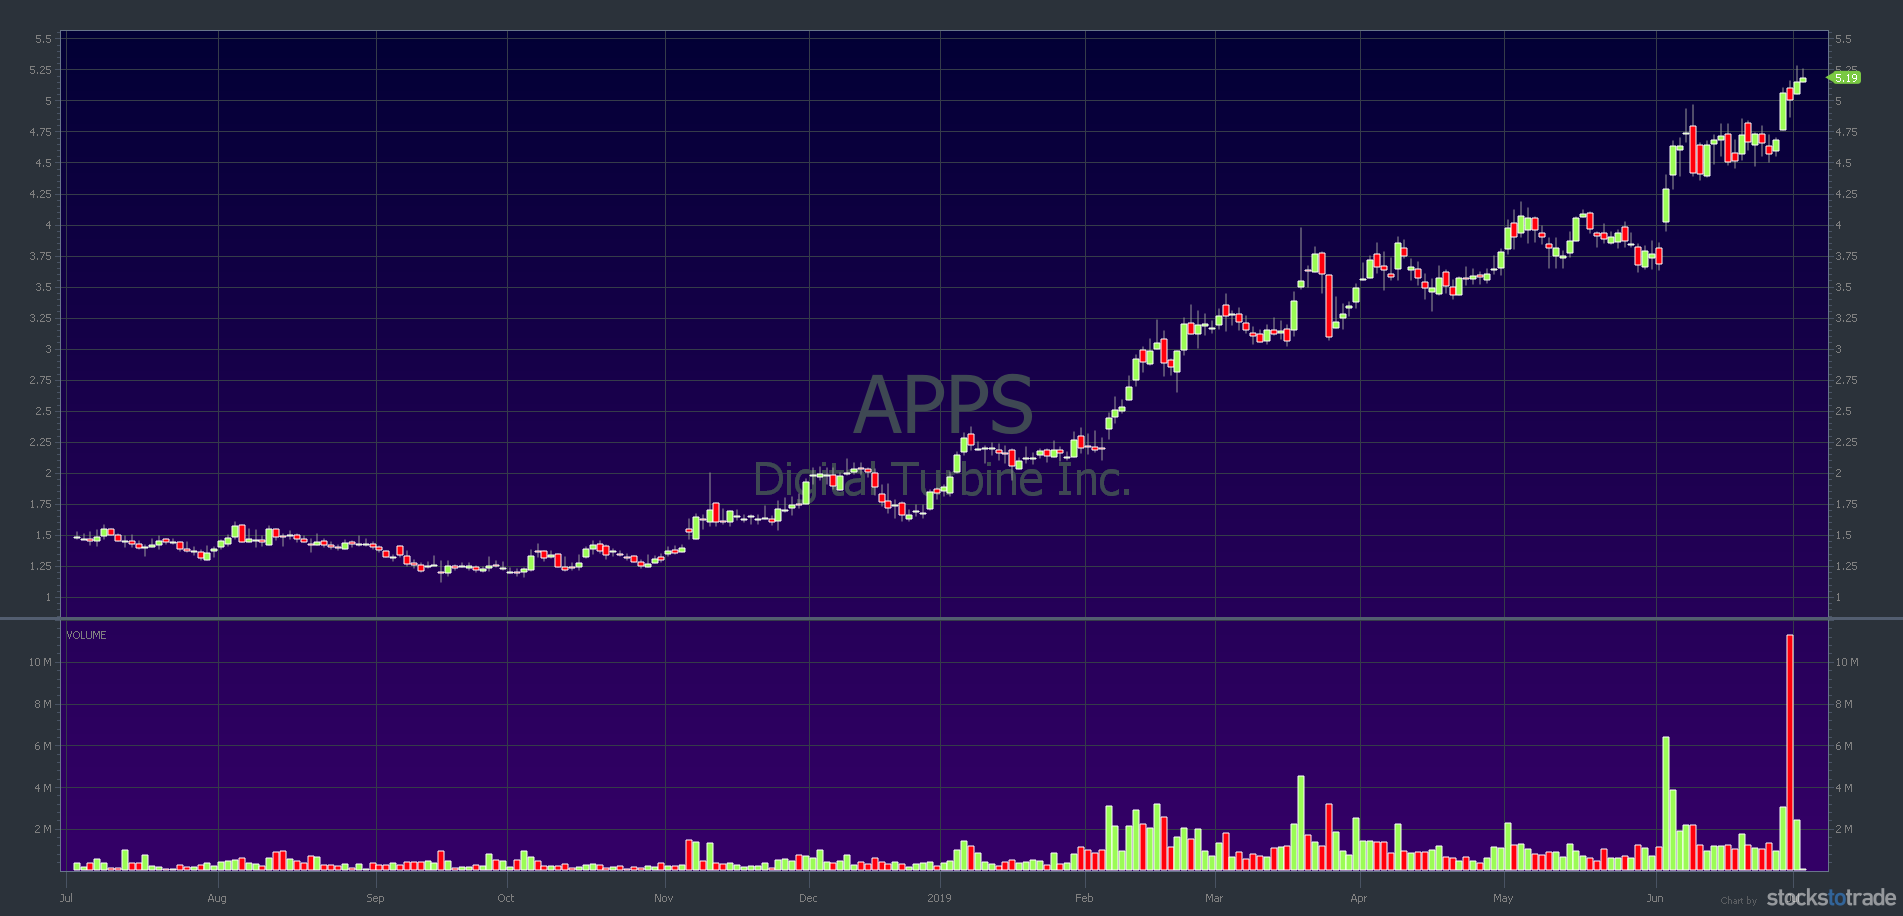
APPS was an earnings winner at the start of June and has continued its uptrend. Trading volume is low compared to the float but has increased since February. Remember to look at ALL the indicators explained in my Trader Checklist Part Deux guide. Volume can affect the ease of your entry and exit.
Conformis, Inc (NASDAQ: CFMS)
Conformis is another slow mover due to low volume, but the long-term chart shows a nice uptrend. The company designs, manufactures, and sells individually tailored joint replacement implants.
Here’s the 1-year chart:
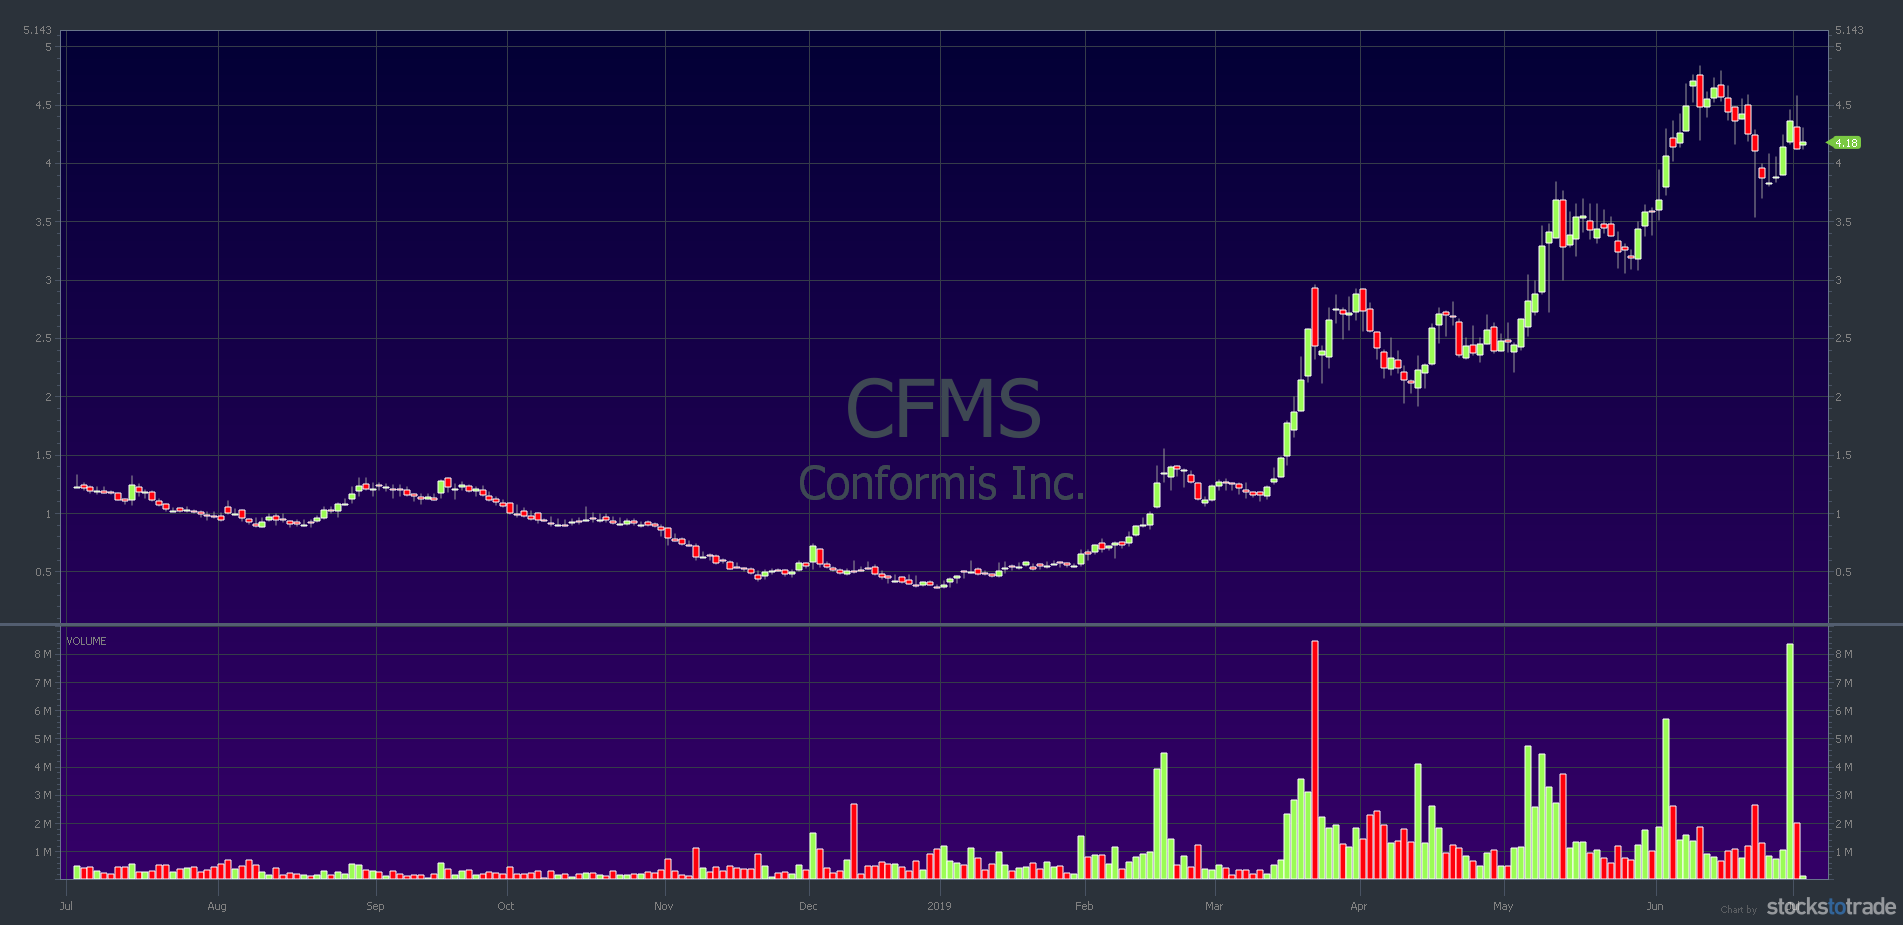
As you can see on the chart, CFMS is a former multi-day runner. Most recently, it had a three-day run starting after hours on June 25 following a $33 million round of financing.
Corindus Vascular Robotics Inc. (AMEX: CVRS)
Corindus Vascular Robotics designs and manufactures robotic-assisted systems for interventional vascular procedures. They boast the only FDA-cleared robotic system for those procedures. Plus, years of clinical evidence.
Corindus joined the Russell 3000 Index on July 1, following the annual Russel reconstitution.
Here’s the chart:
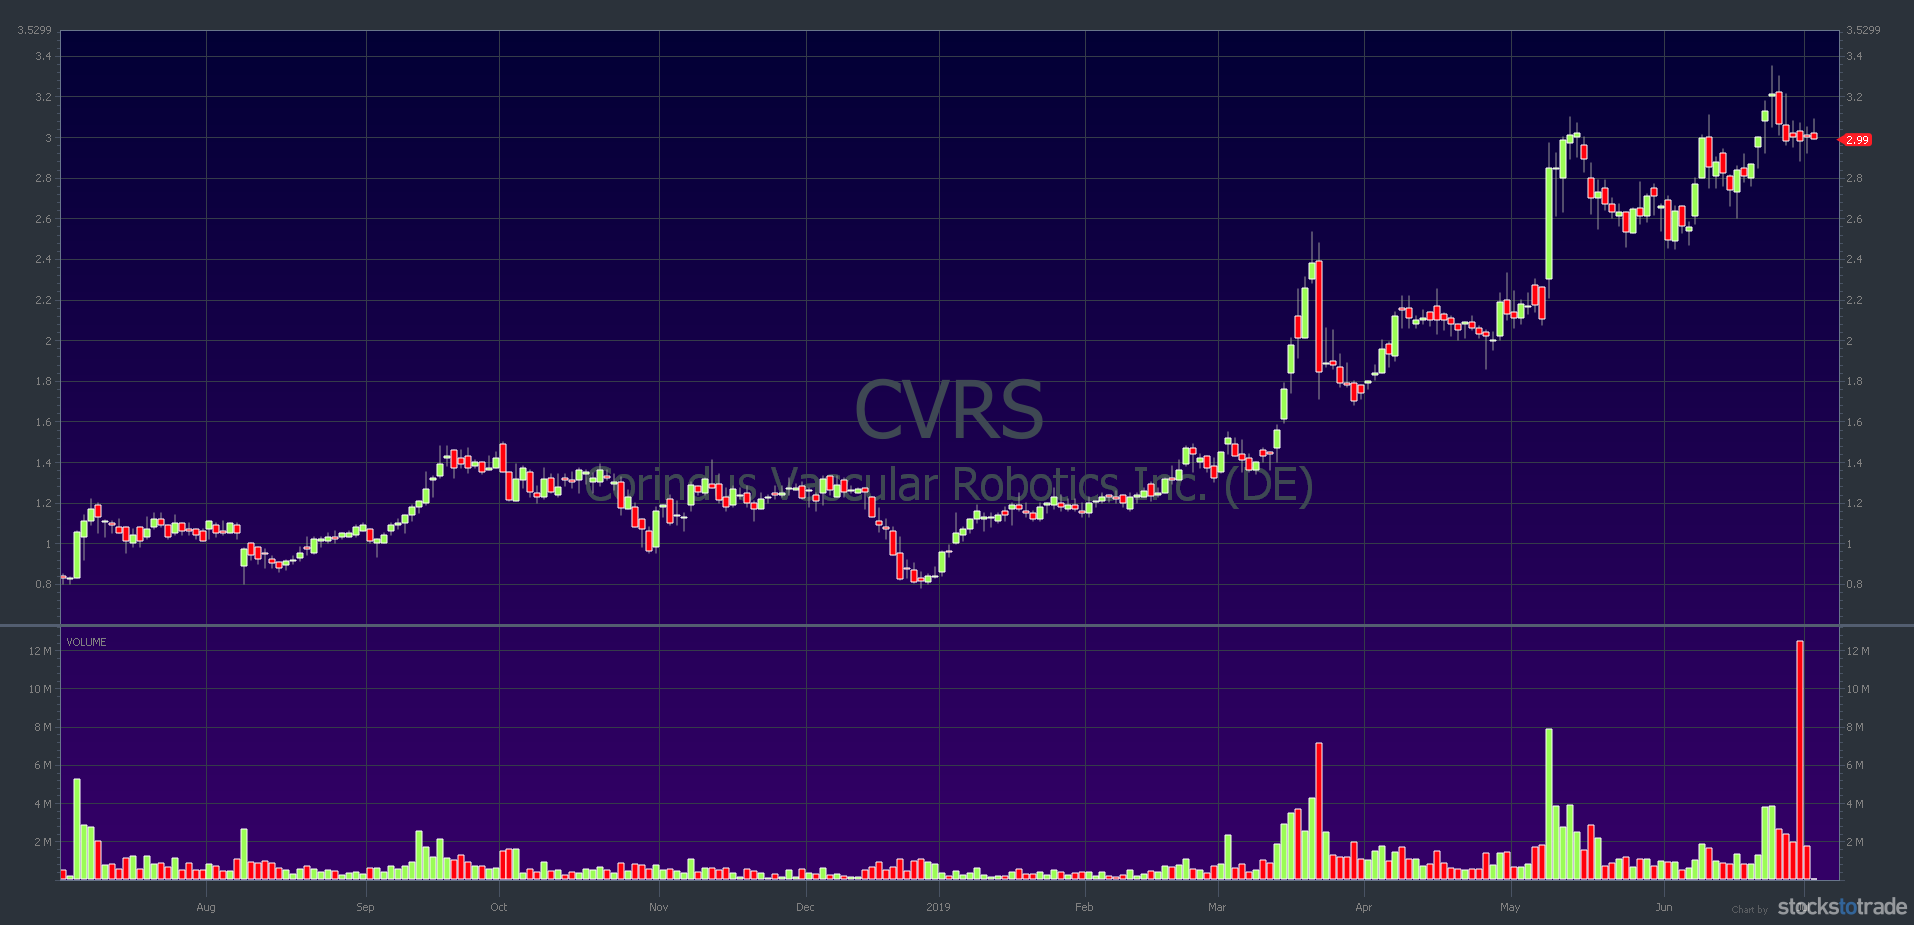
Corindus spiked on May 8 even after they missed earnings projections by a penny per share. Why the spike on missed earnings?
- Corindus Vascular Robotics announced increased year-on-year revenue.
- The company announced purchase orders for 11 of their super-cool robotic systems (called CorPath GRX).
- And Corindus announced they have cash to burn.
A biotech with revenue growth, orders for products, and cash in the coffers. Notice how the resistance near $2.50 in March became the support in June. That’s another concept you’ll come to understand better as a Trading Challenge student.
Now for a few recent spikers…
Avid Bioservices Inc. (NASDAQ: CDMO)
Avid Bioservices provides development and manufacturing services to other biotech and pharmaceutical companies.
CDMO is a recent earnings winner. An analyst from Janney Montgomery Scott upgraded it to a buy with a $10 price target. On that news, in pre-market trading on June 28, shares were up as much as 20% from the previous day’s close.
Here’s the 10-day chart with 5-minute candlesticks:
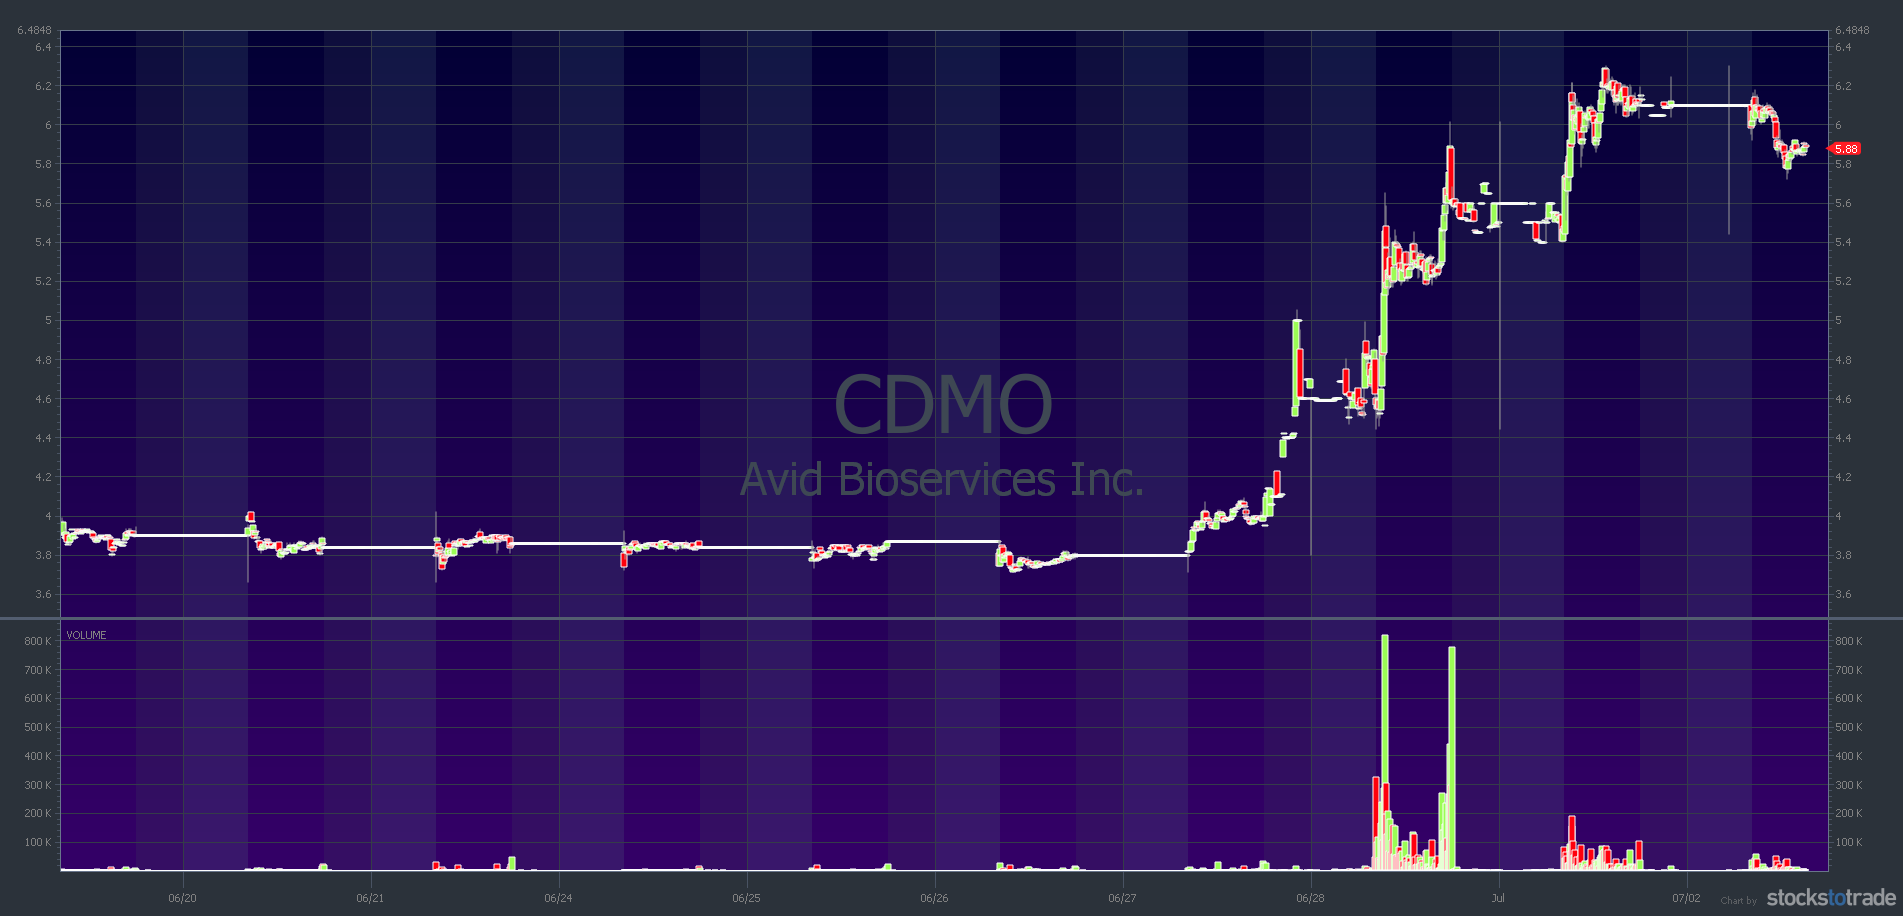
CDMO has some positives and some negatives. It’s an earnings-winner play reaching multi-day, multi-week, and multi-month highs. It’s a former runner. But, it’s choppy, and trading volume in relation to its float is low.
The right news catalyst and a boost in volume could see this one run more. This is a potential dip buy only for me.
FuelCell Energy Inc. (NASDAQ: FCEL)
FuelCell Energy designs, manufactures, and installs fuel-cell power plants. They also have solutions for energy storage and recovery.
The 1-year chart below shows only one multi-day run back in February. The long-term trend is all down. Notice the huge gap up after FuelCell announced a 12–1 reverse stock split, which took effect on May 9.
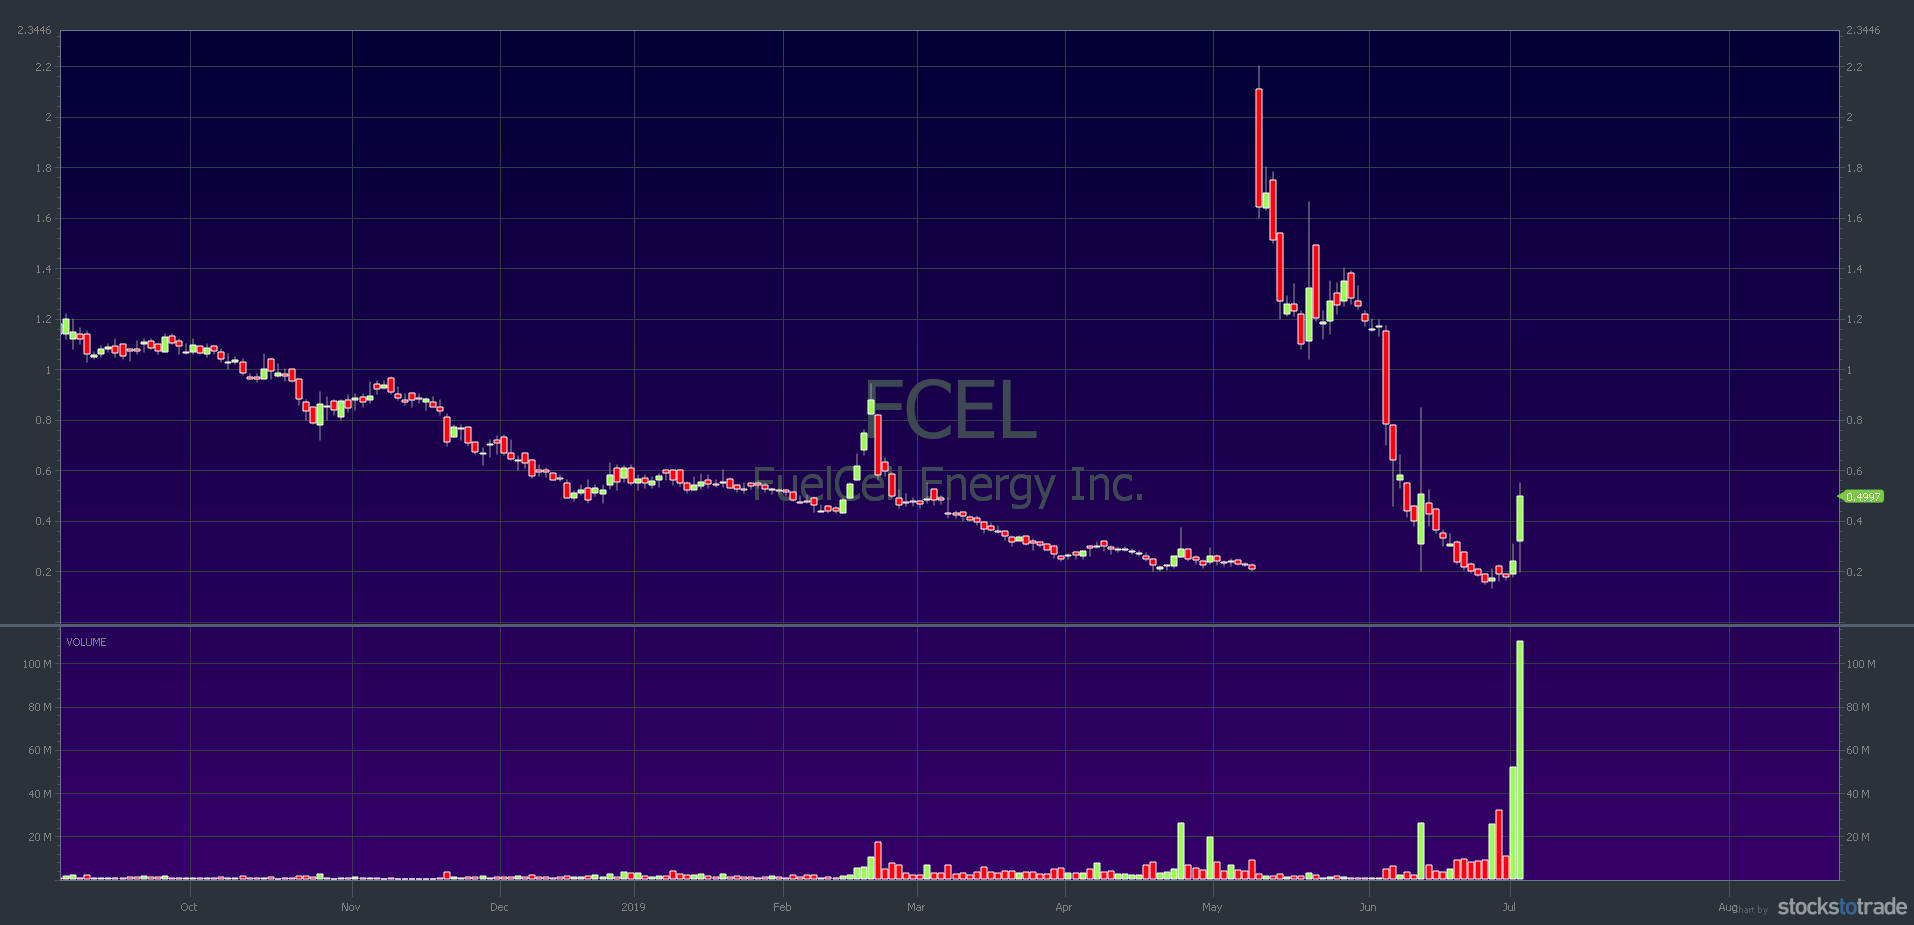
After the reverse stock split, the chart is ugly. So why add it to this watchlist? A few reasons:
- Volume started to pick up on June 27 when FuelCell announced a new carbon capture project.
- On July 1, it was one of the top percent gainers in the market.
- Volume on July 1 was heavy but nothing compared to July 2.
- It’s the biggest percent gainer in the entire market as I write (July 2).
Check out the 2-day chart:
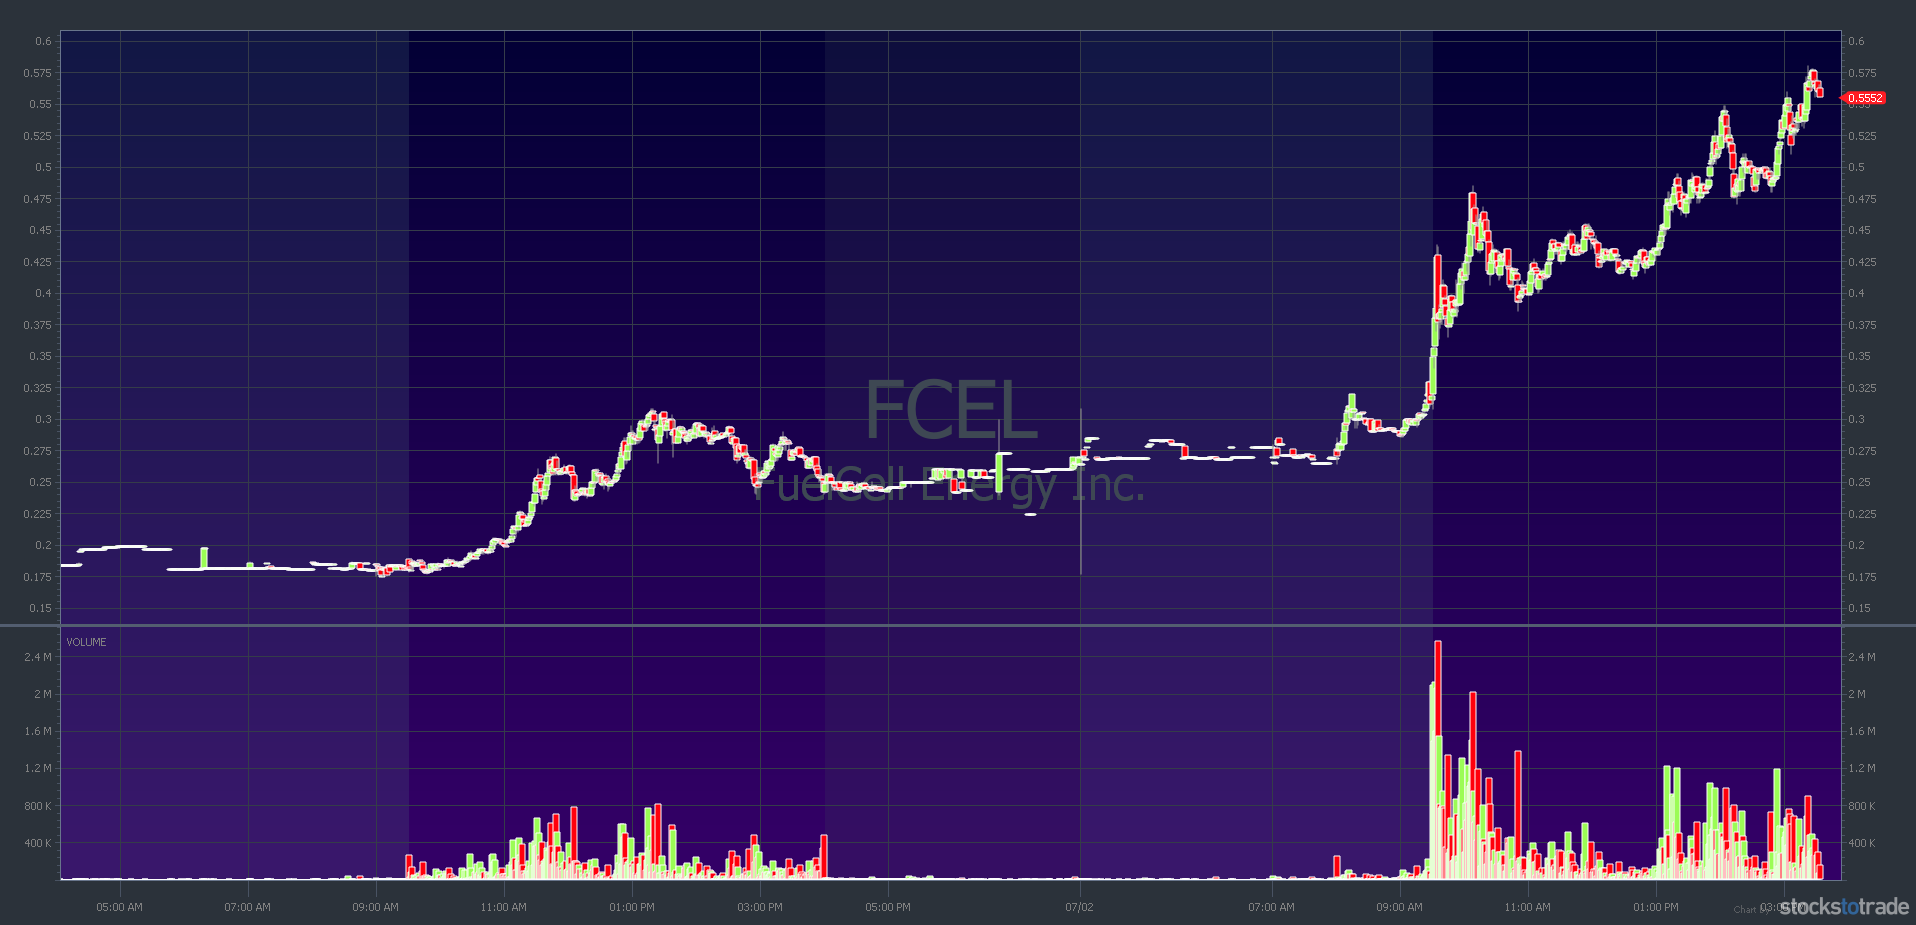
After the run on July 1, I added this to the daily watchlist I share with Trading Challenge students. Look at the MASSIVE volume on July 2. As I write during power hour, the volume is 133.08 million shares on a float of 20.75 million. In other words, the float has rotated more than six times in one day. Huge. (Power hour is the last hour of trading before the market close.)
Also, the stock is hitting a new high of the day. We’ll see what this one can do. As I said, the long-term chart is bad. It’s very choppy. I won’t chase it, so it’s a potential dip-buy only for me. Ideally on a big morning panic. A few Trading Challenge students reported doing well trading FCEL on July 2. [Update: I tried to buy into the morning panic on July 3 but couldn’t get my order executed. It was moving too fast. Scary stock Whew!]
Ocular Therapeutix Inc (NASDAQ: OCUL)
Ocular Therapeutix is a biopharmaceutical company focused on therapies for eye diseases.
As you can see on the chart below, OCUL dropped roughly 11% back in May — the gap down on the chart. One of their therapies, called OTX-TP, failed a phase 3 trial. But there’s been a steady rebound since then. The stock recently hit multi-month highs and is now green year-to-date.
Check out the 6-month chart:
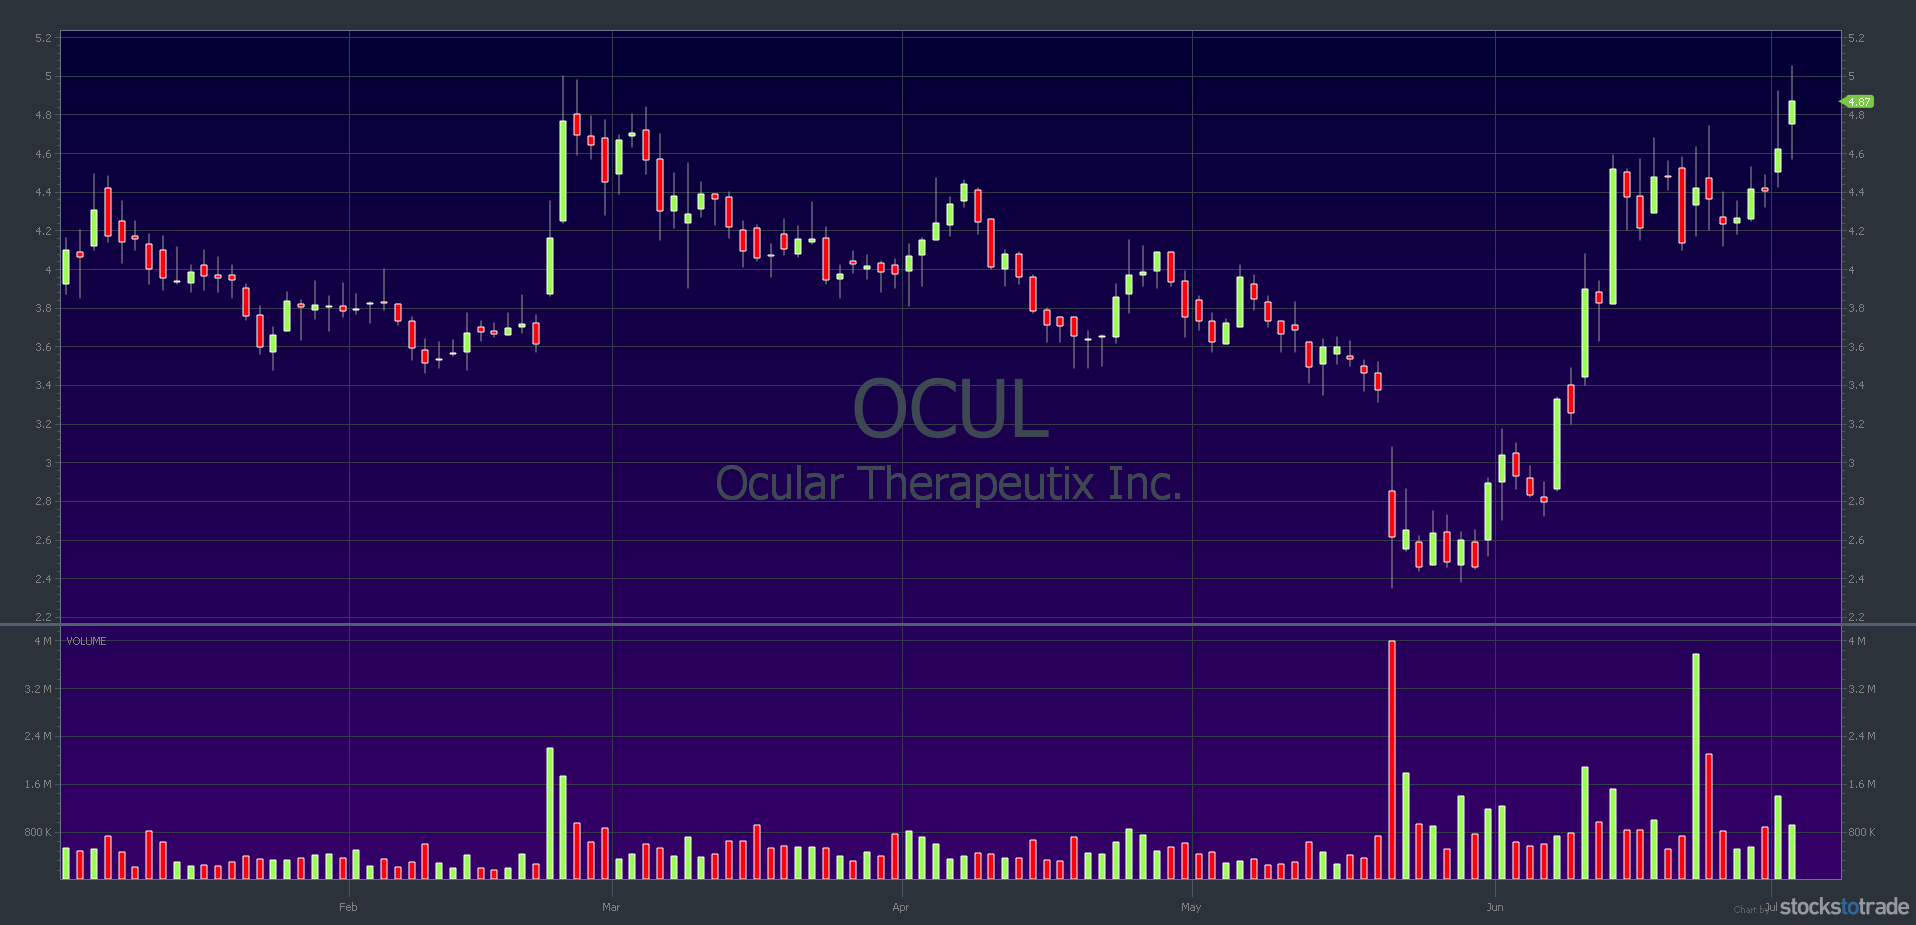
Now look at the 2-month chart with 15-minute candlesticks:
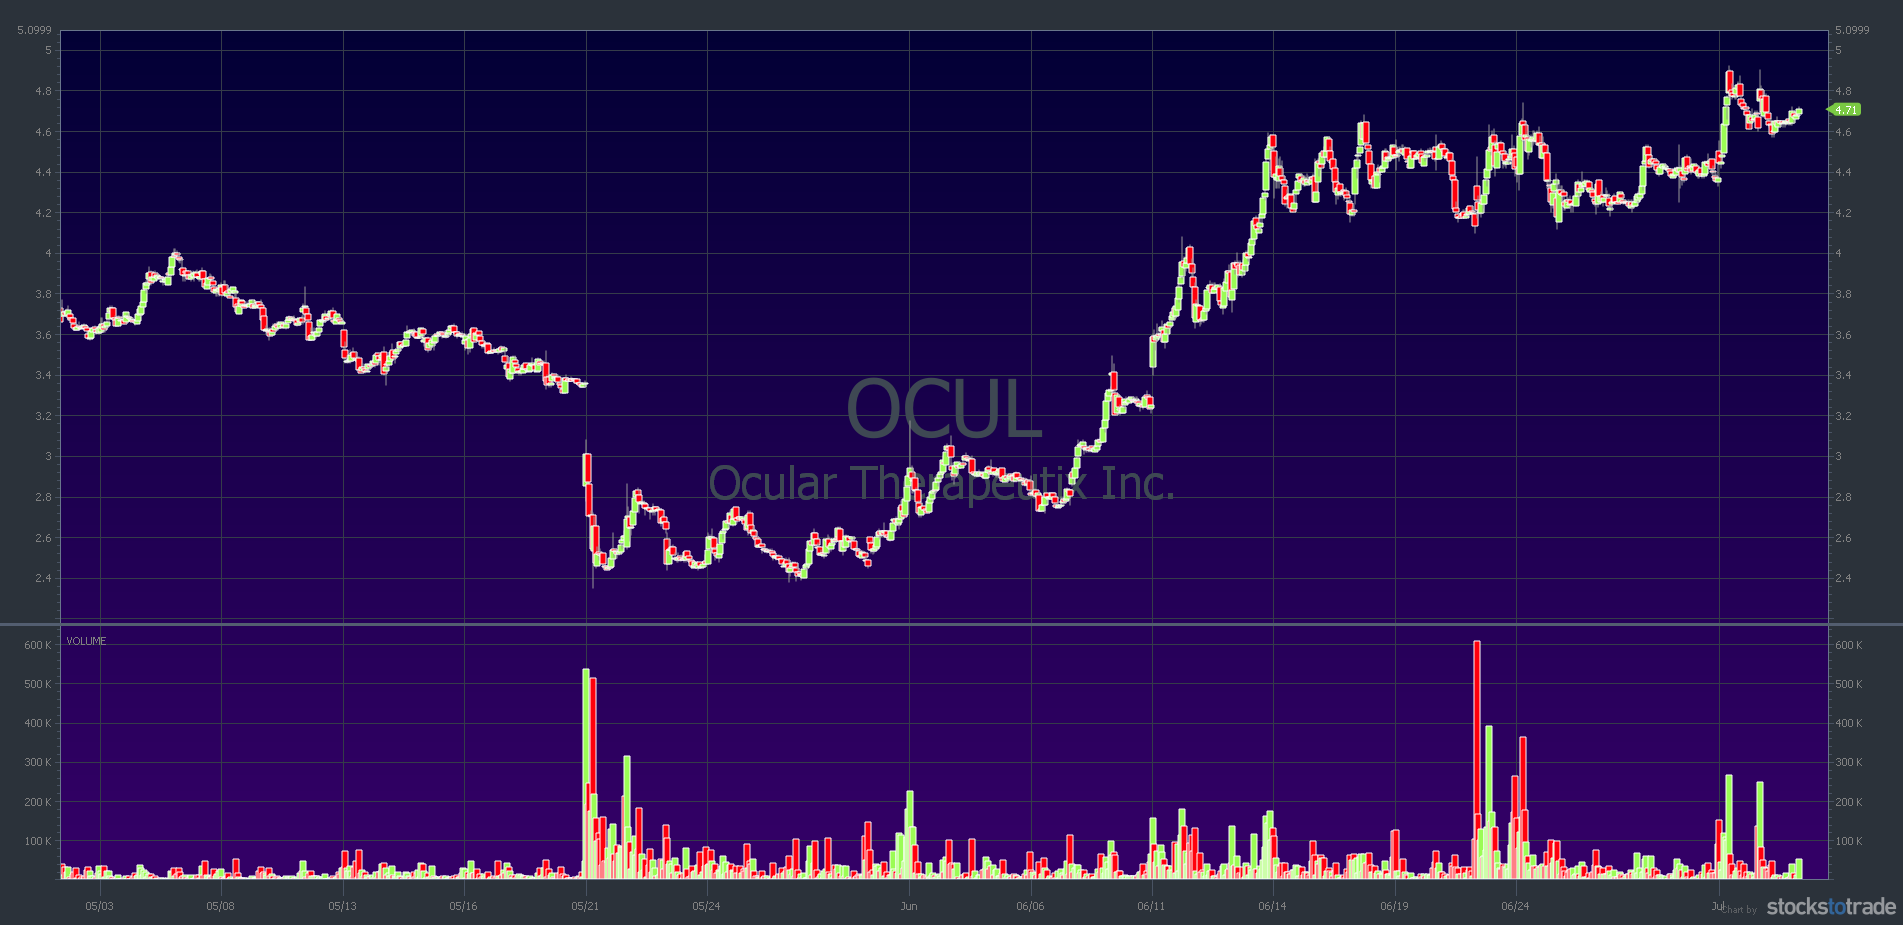
Ocular Therapeutix had several news catalysts during this run:
- May 30 — Ocular Therapeutix announced they would present at three biotech investor conferences in June.
- June 10 — there was a large volume of insider buying before the launch of a new product.
- June 21 — the company announced FDA approval of a new drug application.
- July 1 — the company announced the commercial launch of their DEXTENZAⓇ product for use in the U.S.
How to Use This Top Penny Stocks to Watch List
Like I said last month — this list is NOT advice to buy these stocks.
Instead, study the charts, look them up in real-time using your favorite stock screener. I use StocksToTrade every day. It’s how I found these stocks and all the stocks I trade.
Do some research to find what’s driving price action. I’ve given an overview of the news catalysts for these stocks. Read the press releases and articles. It’s all part of your preparation to trade. The better prepared you are, the better your chance take advantage when opportunities present themselves.
Watch How To Make Millions to learn the best patterns. Apply for Trading Challenge if you’re ready to study and work harder than you’ve ever worked in your life. I’m happy to have you as a student — but no lazy losers. Get on it.
Are you a trader? What’s your criteria for a stock to make your daily watchlist? Comment below. New to trading? Comment below with “I’ll look for the biggest percent gainers every day!”

Leave a reply