
Everyone wants an edge in their trading right? We all want the answer.
The one thing that’s failproof.
The easy button.
Is the Ichimoku Cloud an easy button?
Here’s a big hint: There is NO easy button. It doesn’t exist. If it did, you wouldn’t be here right now.
Everyone would know about it. Social media would be abuzz and everything would come to a screeching halt because we’d all have the answer.
The WORK HARD AND EARN IT button is right here ⇒ Trading Challenge.

But Tim, what’s up with traders who say they have the answer? Or those who say “this indicator is infallible.”
Then they spend a lot of time telling you how to use it. Right at the end of their lengthy explanation they tell you to use it with another indicator. And basic support and resistance. Almost everyone tells you to use basic support and resistance.
Imagine that.
There are literally dozens of technical indicators. Developed by people with a lot more math going through their brains than I care to think about. And every one of them comes up with something they think works. Then the real fun begins. They have to convince everyone else it works.
I want to reiterate something I wrote in a recent post about stochastic oscillators. I didn’t say it exactly like this. But the general idea was …
It’s easy to overcomplicate things. Especially if you’re looking for the easy button. Some people call it the shiny object syndrome. You learn of something and think you have to start using it. Then, before you’ve really had enough time to learn it, you just go for it.
Time takes time. And learning how to use indicators takes time. So if you do choose to use them, be willing to put in the time. There is NO easy button.
What does all this have to do with the Ichimoku Cloud? You might decide the Ichimoku Cloud is the one technical indicator you need. Or you may take one look and say, “that’s too complicated for me.”
Table of Contents
A Big Caveat About Technical Indicators (Make it Two)

First caveat: If you’re a beginning trader, it’s best to focus on chart patterns and basic support/resistance. There’s enough to think about without adding layers of complexity.
Second caveat: technical indicators are just that — indicators. Take any individual article about how to trade using a technical indicator with a grain of salt. I’ll continue to point this out as I take you through the Ichimoku Cloud.
The Ichimoku is one of the most ‘action packed’ technical indicators going. It’s based on a simple moving average variation, but it uses five lines. It’s pretty crazy when you first look at it.
But it’s not super complicated, Once you wrap your head around it, it’s pretty straightforward. The question is, does it support your trading strategy? This post should help you decide.
What is the Ichimoku Cloud
The Ichimoku Cloud is sometimes called the Ichimoku Kinko Hyo. It uses several moving average variations to indicate support, resistance, and momentum. At first, it looks pretty scary. But once you spend some time with it and understand what you’re seeing it’s much like any indicator.
Ichimoku roughly translates as one look or one glance. So the Ichimoku Cloud is the one-glance cloud. The idea is, you can take one glance at the chart and know whether you should buy, sell, or sit on the sidelines.
The Ichimoku cloud was developed by Japanese journalist Hosoda Goichi. He spent — get ready for this — three decades developing it as a way to improve his price forecasting.
Remember earlier when I said time takes time? Talk about dedication. Hosoda Goichi put in the time. He didn’t release his ideas to the world until the 1960s but he’d been at it since the ‘30s.
What are the lines in the Ichimoku Cloud?
Before you try trading using the Ichimoku cloud, learn what the lines represent. Seems obvious but it’s amazing how unprepared some people are when they start trading. Not you. You’re here to learn. Here they are (graphic to follow) …
The first two lines are a variation of moving average. Instead of using closing price, they use high/low average within a period. Like regular moving averages, these two lines signal momentum because one is fast and one is slow.
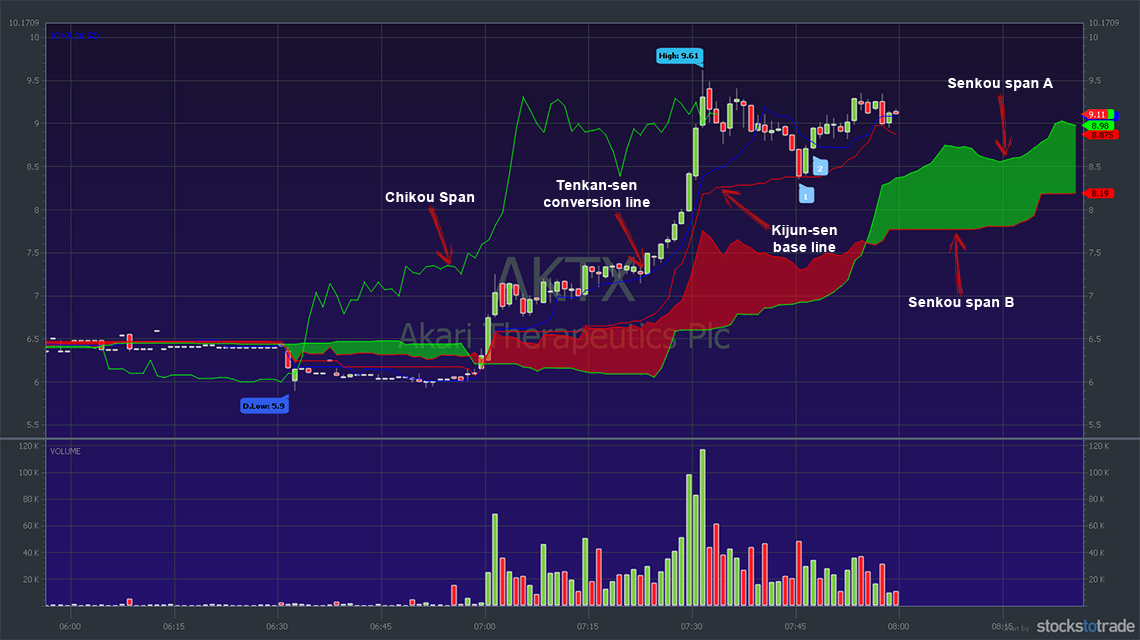
- Tenkan-sen: this is often called the signal or conversion line. It calculates the average of the highest high and lowest low for the past 9 periods. (Like most indicators, the number of periods can be changed to tweak the Ichimoku Cloud.) It’s calculated like this: (9 period high + 9 period low)/2
- Kijun-sen: this is often called the confirmation or base line. Essentially, it’s a slower version of the Tenkan-sen. Kijun-sen is calculated like this: (26 period high + 26 period low)/2
Next come the span lines. These lines form the border of the cloud, or kumo. The span lines are perceived to act as support or resistance depending on their relationship to current price. In other words, if the current price is above the span lines, Ichimoku traders believe they act as support. If the current price is below, traders consider them resistance.
- Senkou span A is a moving average of the Tenkan-sen and Kijun-sen lines. It’s calculated like this: (Tenkan-sen + Kijun-sen)/2. It’s plotted 26 periods ahead.
- Senkou span B is calculated in a similar manner to the first two lines but for a longer period. It’s calculated like this: (52 week high + 52 week low)/2. It’s plotted 26 periods ahead.
Note that these calculations can (and do) lead to horizontal lines as part of the cloud. This is because the high and/or low of a given period might not change for several trading sessions.
The final line is the Chikou span. This is the only line based on closing price rather than a high/low average.
- Chikou span: this is often called the lagging span. It is calculated like this: period close plotted 26 periods behind.
Many traders ignore the Chikou span altogether. After all, it’s just the closing price projected backwards, right? Thing is, Hosoda Goichi spent three decades developing the Ichimoku Cloud. He must have had a reason for putting it there.
My take on it: Chikou span gives extra visual confirmation of possible support or resistance.
Here’s a chart with the Ichimoku Cloud on it. This is Akari Therapeutics Inc (NASDAQ: AKTX). Back on March 14th this stock spiked during pre-market trading. The entire chart is pre-market. I didn’t trade it but it was on my alert watchlist on Profitly. Since it was on the list I thought I’d check it with the Ichimoku Cloud.
Check it out:
What Do All the Ichimoku Cloud Lines Mean?
Let’s take a quick step back and look at the big picture. Ichimoku Cloud is based on a variation of the simple moving average. So if you don’t understand moving averages …
… read my Moving Average Guide post.
In a nutshell, a lower number of periods used to calculate a moving average means a faster moving line. A faster moving line more closely follows the price. The conversion line is based on 9 periods and the base line is calculated using 26 periods. So, the conversion line moves faster. Which is why the blue line on the chart stays closer to price action.
The Kijun-sen (base line) — is slower. It smoothes out the data like a standard moving average.

The Senkou spans are the same. Span A is a moving average of the conversion and base lines. It moves faster than Senkou span B. Senkou span B is slower because it’s calculated using 52 periods. Remember, these two lines are projected forward 26 periods.
The moving average post mentions a psychological game of cat and mouse traders play. What do I mean by that? Let’s take a step further back from Ichimoku Clouds and moving averages.
All the way to …
… the battle between bulls and bears. I hope this helps you understand why the Ichimoku lines are perceived support or resistance. Bears think the price is going to drop — they want to sell. Bulls think the price is going up — they want to buy.
Confirmation Bias and Technical Indicators: How Does Ichimoku Stand Up?
Here’s where human nature comes into play. We look for evidence to confirm our beliefs. It’s called confirmation bias. So when you look at a technical indicator on a chart, the tendency is to look for proof that it works in favor of your belief.
This is why I say the market is full of self-fulfilling prophecy. (My lawyers are gonna love that.) Let me clarify so you don’t think I’m giving you a bunch of supernatural mumbo-jumbo. If enough traders believe something will happen — and trade on that belief — then it happens.
As I’ve said in the past — I don’t use much in the way of technical indicators. Not using them fits my trading strategy and my time frames. But my way might not be the right way for you. (Even if I do believe my way is an easier and faster way to grow a small account.)
So what happens when the indicator fails you? Every article about technical indicators says to buy ‘when this line crosses that line.’ Or, ‘when the price closes below this line.’
And some of those buy and sell signals would pan out and make it a profitable trade. But other times they don’t work at all. Period. Anyone who tries to tell you different is a blatant liar.
But here’s where this whole thing gets juicy and … why you should learn as much as possible about technical indicators. There are traders out there who trust what the indicator is telling them. They don’t believe it’s an opinion wrapped up in an algorithm. And that’s where you can develop a psychological edge.
How?
Because you are learning to accept that your opinion (your trade thesis) is going to be wrong sometimes. If you pay enough attention as a Trading Challenge student, hopefully it won’t be too often. But all traders lose. And at the beginning, most lose more than they win.
So learning how technical indicators work — without attachment to what they ‘signal’ — can give you a HUGE advantage over the sheeple. Remember, in every trade there’s a buyer and a seller. Often this means there’s a winner and loser. Your goal is to be the winner.
How to Use the Ichimoku Cloud to Find Trades
Okay, let’s take a look at how to use the Ichimoku Cloud to trade. Before I go further, I want to reiterate that I don’t use it to trade.
Look at Long Term Trends
One of the best ways to use the Ichimoku Cloud is to identify longer-term trends. It’s easy to see: when stock price is below the cloud and remains below the cloud, the trend is down. When the price is above the cloud and remains above the cloud, the trend is up.
Let’s look at the one-year chart of a stock I recently traded: Restoration Robotics Inc (NASDAQ: HAIR).
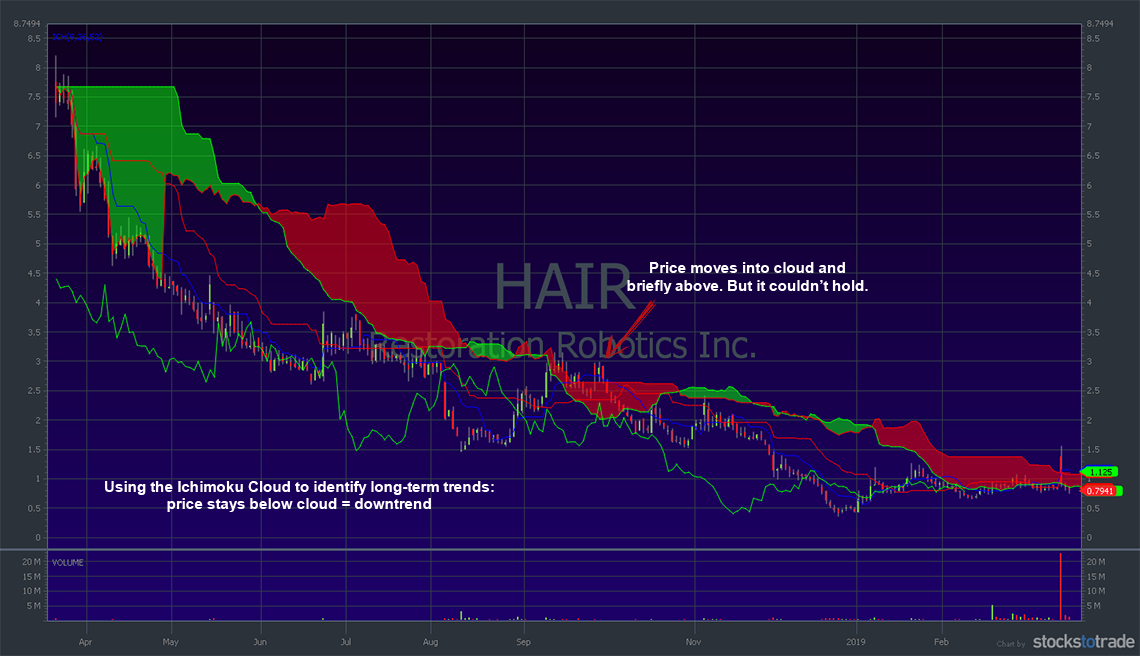
Notice the long-term trend is down and the price stays below the cloud most of the time.
Conversion and Base Lines Signals
As I noted above, the conversion and base lines are variations of a moving average. They behave in a similar way to signal possible trades. The first way to look at these lines is in relation to support and resistance. The next way to look at them is for momentum.
If a stock price is above the two lines, they are possible support. If the price is below, they act as possible resistance. When the lines cross, they signal momentum shift similar to moving averages. If the fast line crosses above the slow line, it signals bullish momentum. When the fast line drops below the slow line, it signals bearish momentum.
Here’s another chart of a stock I recently traded. New Age Beverages Corporation (NASDAQ: NBEV) went supernova in September 2018. Then it came crashing down and traded wildly for most of October before settling into a recognizable trend.
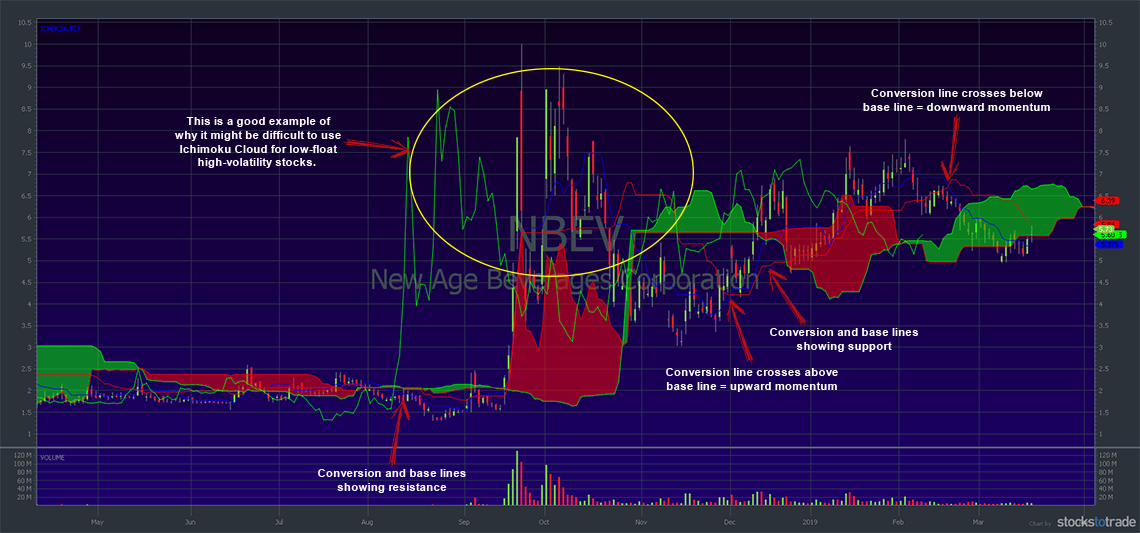
I’ve placed arrows to show where support, resistance, and momentum are indicated by the Ichimoku conversion and base lines. But I also want you to take a good long look at the area I circled, the supernova and the crazy month of trading. That’s a great example of how Ichimoku might not be the best indicator for low float, high volatility stocks.
The supernova and crash period could have been the best time to trade this stock. After the breakout it got a bit choppy for me — I prefer clean charts. Either way, the cloud wouldn’t have helped much in those circumstances.
RSI
Some traders use the Relative Strength Index (RSI) indicator with the Ichimoku Cloud. The RSI is commonly used to indicate overbought and oversold conditions. When used with the Ichimoku Cloud, you look for divergence between the RSI and price.
Take a look at the Jaguar Health Inc. (NASDAQ: JAGX) chart:
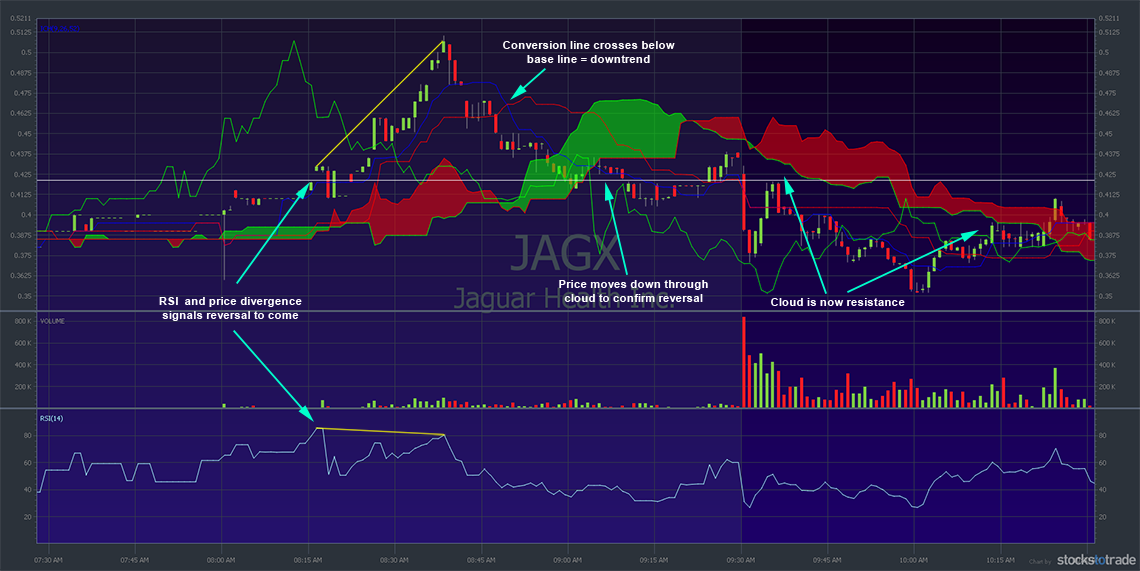
Notice the divergence between RSI and price? It signaled a reversal. Next, the conversion line crossed below the base line as the reversal started. That signaled downward momentum. Finally, price drops through the Ichimoku Cloud, confirming downtrend.
Stop Placements
I’m a firm believer in using mental stops rather than setting an electronic stop. There are many reasons for this, not least of which it’s easy to get shaken out of a trade with an electronic stop. It’s also possible you could get stuck if the price moves too quickly past your stop price.
When you use the Ichimoku Cloud, stops are based on support and resistance levels indicated by the various lines. So you watch the indicator to determine when to get out.
For example, look again at the JAGX chart above. Let’s assume you opened your position somewhere near where the price rose above the lagging span. You placed a mental stop at the conversion line. If you closed when the price dropped to the conversion line (3rd red candle from the top) you’d be profitable.
Signal Summary
Among Ichimoku Cloud trading devotees, there’s a preferred ‘order’ to the lines for everything to be right in their universe. I’m about to punch a hole in it. But first I’ll tell you what they say is the best order.
Bullish Signals
For a bullish chart, the lines are perfect when in this order, left to right. (With price above all of them, of course.)
- Chikou span (lagging span).
- Tenkan-sen (conversion line)
- Kijun-sen (base line)
- Senkou span A (green cloud border)
- Senkou span B (red cloud border)
Bearish Signals
And … it’s the opposite order from the bullish signals. This time the price should be below all the lines. And the lines should be in this order …
- Senkou span B (red cloud border)
- Senkou span A (green cloud border)
- Kijun-sen (base line)
- Tenkan-sen (conversion line)
- Chikou span (lagging span)
Right. So I said I’d punch a hole in it. Check out the final chart example below. It’s from a trade I took. I didn’t use the cloud but I’ve overlaid it to see how it looked.
All the lines are in perfect bullish order near the beginning of the green cloud formation on the right. After that, it dropped slowly back to the price range I traded. What’s my point? Even the ‘perfect’ setup doesn’t always work. And you can still profit when things aren’t perfect.
Example of the Ichimoku Cloud: My Shoulda-Coulda-Woulda SOLO Trade
I thought for fun I’d show you a chart where I made a profitable trade. And I could have done even better if I’d followed the Ichimoku Cloud strategy described in this post.
Below is a chart from Electrameccanica Vehicles Corp Ltd.(NASDAQ: SOLO). As you can see, I opened and closed a trade right near the market open. It was long with a profit of $450.**
Here’s the chart:
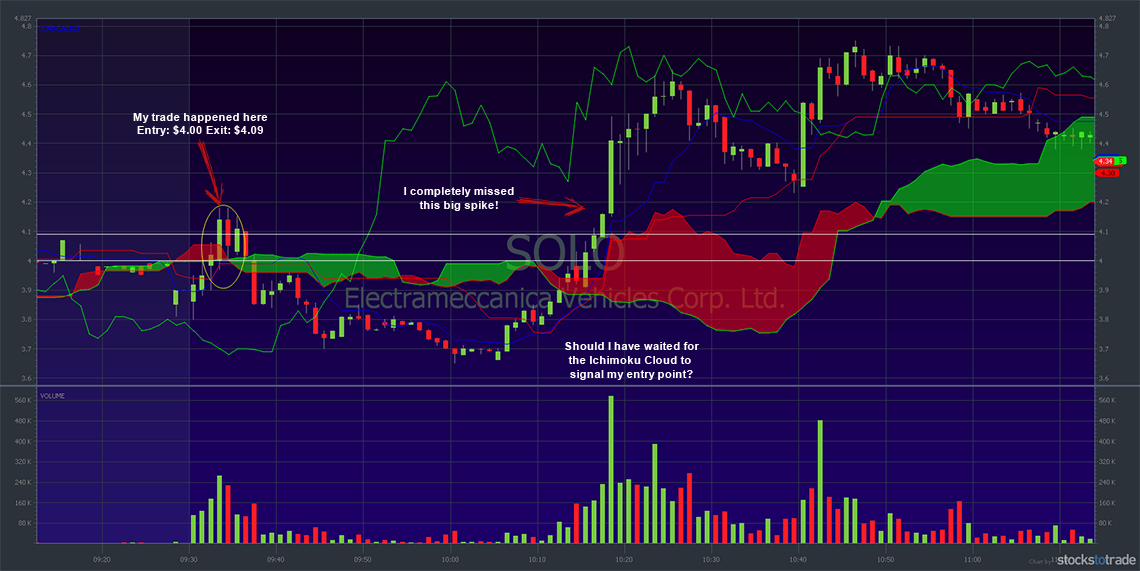
This is interesting to me …
I don’t use Ichimoku, but according to the chart I could have ridden that nice late-morning spike for a MUCH bigger profit. Win some and lose some, right?
What was my thesis? I bought this former supernova running. It’s in the hot car space. My goal was to sell into the low to mid $4s. It was a scary, choppy stock. It was moving so fast I couldn’t even get executed right at the top of the small spike I traded. I was glad to be out for a small profit.
Trading Challenge
I’m not going to tell you I’ll teach you how to use the Ichimoku Cloud when you join the Trading Challenge.
That doesn’t mean you can’t or shouldn’t use it for trading. I have students who use all sorts of indicators. And I’m proud of them.
Want to know something? Some of my students are better traders than me. And I want you to be a better trader than me. To be a more effective teacher, I trade a small account. I use simple patterns I know, basic support and resistance, and a whole bunch of market psychology. Plus experience.

These are the things I know and teach. They help students with small accounts grow them into bigger accounts. Once you have a bigger account you can start getting into all the crazy stuff. If you’re ready to start small, learn good habits, and grow your account …
… join the Trading Challenge today.
Conclusion
The Ichimoku Cloud is an interesting indicator. Check this out: I’ve learned some new things writing and preparing this post for you. That’s what I hope you do every day. Learn new things.
Is Ichimoku Cloud a legit way to trade? I don’t use it to trade. Like any technical indicator, if you spend time and learn how it works it could be a nice addition to your bag of tricks. (Not just on a surface level, but really learn it.)
Are you a trader? Do you use the Ichimoku Cloud to trade? I want to know how it works for you. Comment below!

Leave a reply