Stock charts and software are crucial tools for traders. As someone who has mentored thousands of traders, I’ve seen firsthand the difference the right tools can make.
There’s a variety of options available, catering to different needs and preferences. In my experience, the best choices often balance functionality, ease of use, and cost. Reviews of these products can offer insights, but remember, what works for one trader might not suit another. The key is to find a software that aligns with your trading style and goals.
Readers should delve into this article because it offers a comprehensive guide on stock charts and software, essential for informed trading decisions, and is written by an experienced trader and teacher.
I’ll answer the following questions:
- What is chart trading?
- How does chart trading work?
- What are the different types of charts for trading?
- How do I choose the right trading chart?
- What are the differences between free and paid stock charts?
- How can I effectively analyze charts?
- Why are charts useful for trading?
- How do I read candlestick patterns?
Let’s get to the content!
Table of Contents
What Is Chart Trading?
Chart trading is a vital technique for any trader looking to make informed decisions in the stock market. It involves analyzing stock charts, which are visual representations of price action and volume over a specific time frame. For traders, these charts are essential tools that help in recognizing trends and patterns in the stock market. As someone who has spent years trading and teaching, I’ve seen first-hand how chart trading can significantly enhance a trader’s ability to make profitable decisions.


How Does Chart Trading Work?
The process of chart trading revolves around studying historical data to predict future stock price movements. Traders use various types of charts and indicators, such as moving averages or Fibonacci retracements, to analyze market trends and make trades based on this analysis. It’s not just about spotting a trend; it’s about understanding the underlying price action and market psychology. Drawing from my own trading experience, I can say that effective chart analysis can be the difference between a successful trade and a missed opportunity.
Types of Charts for Trading
Understanding different chart types is essential for effective trading. The most common include line charts, bar charts, and candlesticks, each offering unique insights. Candlestick patterns, for instance, provide detailed information about market sentiment and potential reversals, crucial for day traders and swing traders. Line charts, with their simplicity, are often preferred by beginners or those focusing on longer-term trends. Bar charts strike a balance, offering more detail than line charts but less complexity than candlesticks. Each type serves different purposes and selecting the right one depends on your analysis techniques and market understanding.
Candlestick charts are not just visually appealing; they’re a deep dive into market psychology. Each candlestick pattern tells a story of supply and demand, of fear and greed. Understanding these patterns is crucial for predicting future market movements. As a trader, I’ve leveraged candlestick charts to gain insights into market sentiment, helping me make informed trading decisions. For traders looking to master this art, I recommend exploring my detailed guide on candlestick chart patterns, where I break down complex patterns into easy-to-understand concepts.
Bar Charts

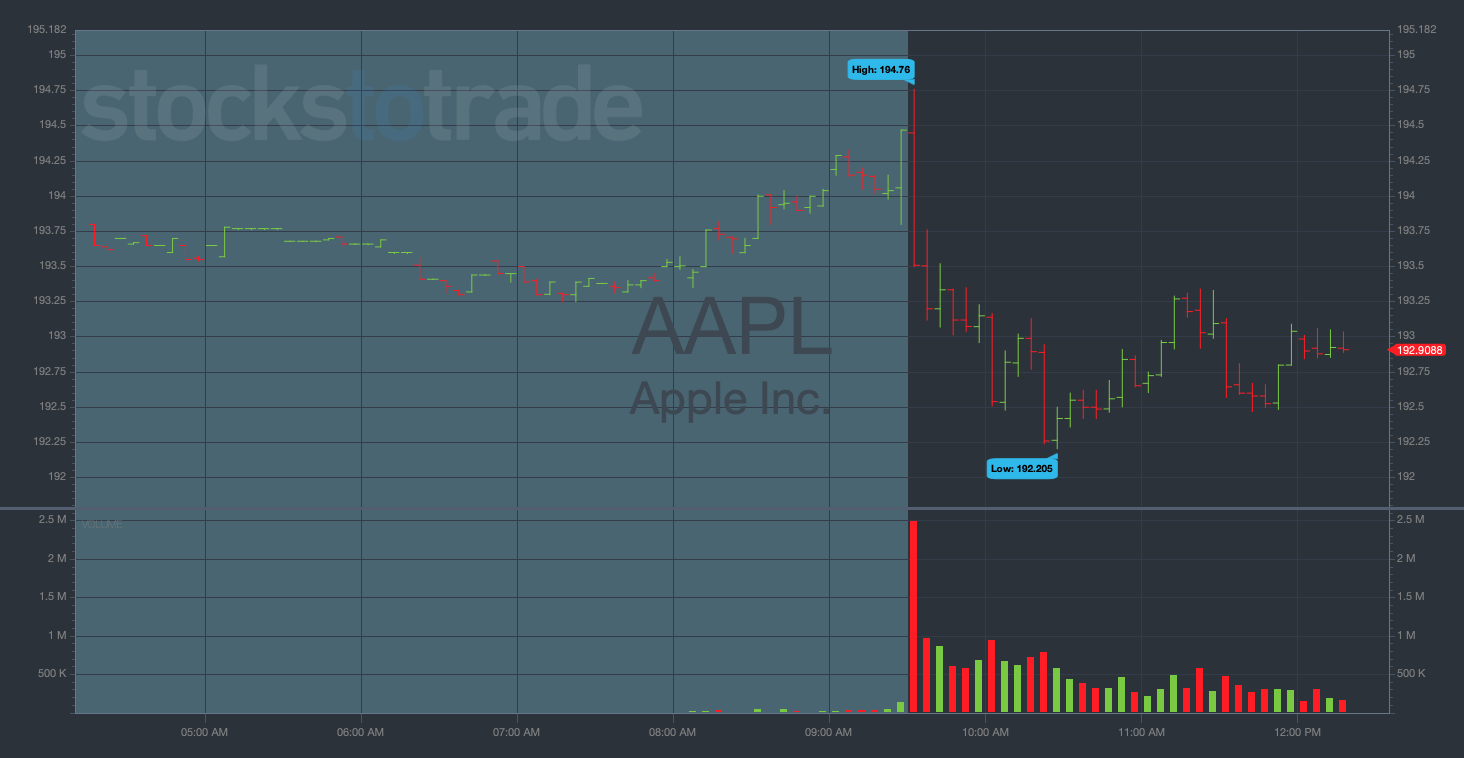
Bar charts provide a clear visualization of price movement over a set period. Each bar represents the opening and closing prices, as well as the highs and lows for the period. This type of chart is invaluable for traders who need a detailed view of price action to develop their trading strategies.
Candlestick Charts
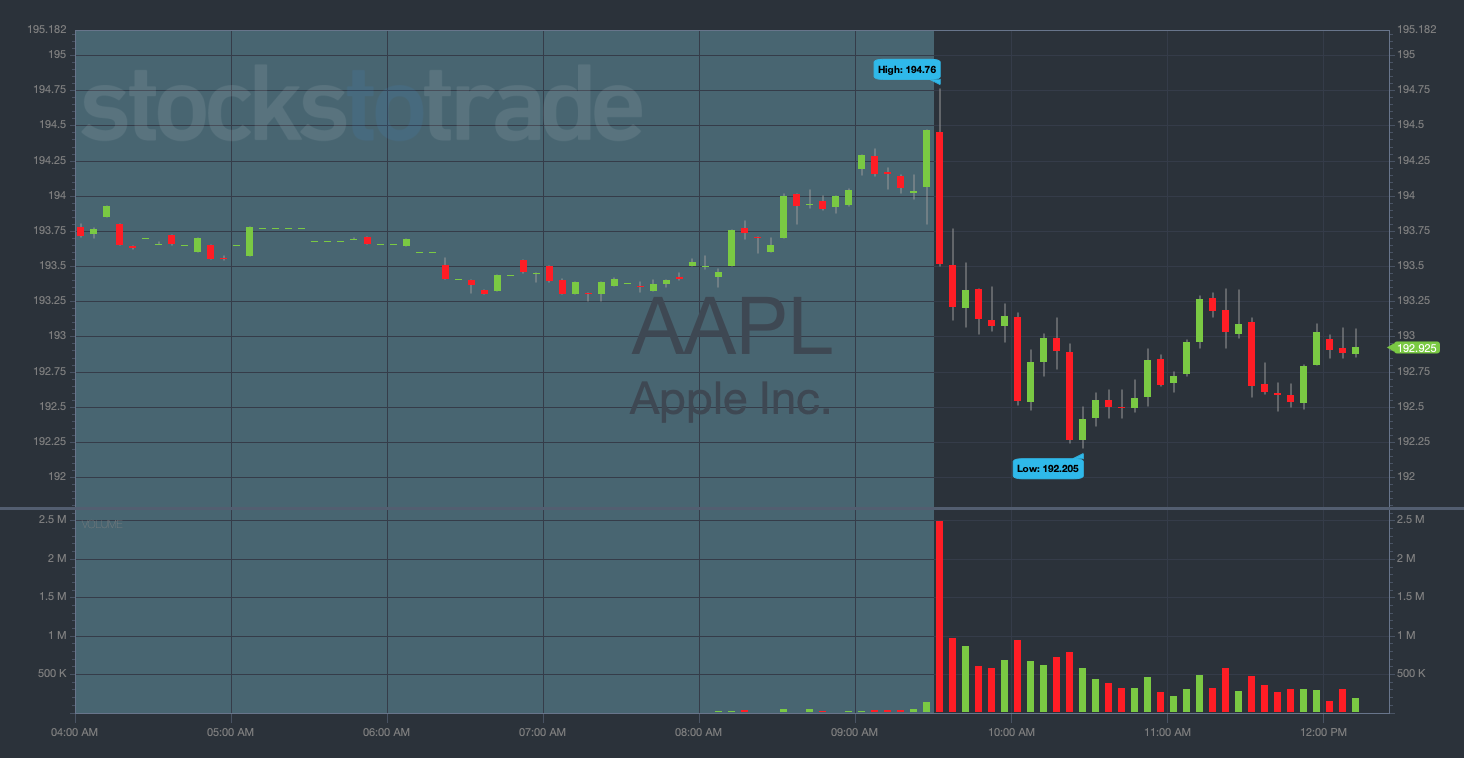
Candlestick charts are popular among traders for their ability to display a wealth of information in a visually appealing way. Each candlestick shows the open, high, low, and close price for a given period. Patterns within these charts are crucial for predicting future price movements, a technique I frequently emphasize in my teaching.
More Breaking News
- Rivian Stock Grinds Higher As Volkswagen Deal And R2 Launch Loom
- RKTO Jumps As Rocket One Pivot Targets Space AI
- BBAI Stock Climbs As Panama Deal Confirms AI Traction
- ASTC Stock Soars 2,500%* While Traders Wait On The SpaceX IPO
Line Charts
Line charts are the simplest form of stock charts, showing the closing prices over time. They are best suited for traders who want a straightforward view of a stock’s trend without the complexity of additional data like opening prices or highs and lows.

Point & Figure Charts
Point & figure charts focus on significant price movements, disregarding time. This chart type is excellent for traders looking to identify breakout patterns and major trends without the noise of minor fluctuations.
Renko Charts
Renko charts are based on price movement and not time, similar to point & figure charts. They help traders see trends more clearly by filtering out smaller price movements, making them a favorite for those who follow my strategies focused on trend following.
Kagi Charts
Kagi charts emphasize the direction of price movements and are less concerned with the time aspect. These charts change thickness to indicate a change in trend, which can be a potent tool for identifying reversal patterns.
Range Bars
Range bars eliminate time from the equation and focus solely on price movements. Each bar represents a specified price movement, offering a unique perspective on volatility and price action.
Heikin-Ashi Charts
Heikin-Ashi charts are a variation of candlestick charts. They use average price data to create a smoother representation of the market trend, making it easier for traders to identify and follow trends.

Best Stock Chart Software
When it comes to stock chart software, there’s no one-size-fits-all. Products vary in features, pricing, and complexity. Some popular options include TD Ameritrade’s Thinkorswim, known for its comprehensive tools and resources, and TradingView, appreciated for its user-friendly interface and community-driven content. Others prefer MetaTrader for its advanced technical analysis capabilities. As an experienced trader and teacher, I’ve used various platforms and can attest to the importance of choosing software that aligns with your specific needs, whether it’s advanced drawing tools, a wide range of indicators, or real-time data.
StocksToTrade
StocksToTrade is a platform I often recommend for its comprehensive tools and data that are crucial for effective stock analysis. Its real-time data, research options, and various indicators make it a top choice for traders at all levels.


When it comes to trading platforms, StocksToTrade is first on my list. It’s a powerful day and swing trading platform that integrates with most major brokers. I helped to design it, which means it has all the trading indicators, news sources, and stock screening capabilities that traders like me look for in a platform.
I use StocksToTrade to scan for news, tweets, earning reports, and more — all covered in its powerful news scanner. It has the trading indicators, dynamic charts, and stock screening capabilities that traders like me look for in a platform. It also has a selection of add-on alerts services, so you can stay ahead of the curve.
Grab your 14-day StocksToTrade trial today — it’s only $7!
TradeStation
TradeStation is a robust platform that offers advanced charting and analysis tools. Its customization options and wide range of indicators cater to both beginner and experienced traders, aligning with the strategies I teach.
TradingView
TradingView is popular for its user-friendly interface and community-driven insights. It provides access to a variety of charts and indicators, along with the ability to share and discuss strategies with a global community of traders.
StockCharts
StockCharts is known for its high-quality charting tools. It offers a range of chart types and indicators, making it a valuable resource for conducting thorough market analysis.
Webull
Webull is a newer entrant but has quickly gained popularity for its intuitive interface and comprehensive features, including advanced charting tools and real-time market data, suitable for the dynamic strategies I advocate.
How To Choose a Trading Chart
Choosing the right trading chart is a critical decision for any trader. Whether you’re into day trading, swing trading, or long-term investing, the chart you use can significantly impact your strategy and results.
Start by considering the type of trading you’re involved in. For example, day traders need charts that provide real-time data and can track short-term price movements effectively, capturing momentum and volatility.
Additionally, your brokerage account type might dictate the charting tools available to you. Some brokers offer advanced charting options, while others may have more basic offerings. It’s also vital to consider the studies and indicators that are crucial to your trading strategy. Can the charting software support these?
Lastly, personal preference plays a role – ensure the chart’s interface is intuitive and aligns with your analysis style. Whether it’s a standalone charting application or one integrated with your trading account, the right choice can enhance your trading efficiency and accuracy.
Choosing the right trading chart is just the beginning. The real skill lies in interpreting these charts to make informed decisions. Whether you’re a day trader or a long-term investor, understanding how to read stock charts is fundamental. It’s not just about recognizing patterns; it’s about understanding what these patterns signify in the broader market context. To help traders develop this crucial skill, I’ve created a comprehensive guide on how to read stock charts, offering insights into different chart types and the nuances of market analysis.
Trading Style
Your trading style significantly influences the type of chart you’ll need. Day traders often require detailed, minute-by-minute charts to catch short-term price movements. Swing traders might prefer hourly or daily charts to identify longer-term patterns. Position traders, on the other hand, may use weekly or monthly charts to understand overarching market trends. Each style demands different levels of detail and responsiveness from the charting software. In my trading career, I’ve switched between these styles and can confirm that the right chart can make a substantial difference in your strategy’s effectiveness.
Market Analysis
Your approach to market analysis – whether technical or fundamental – also dictates your charting needs. Technical traders rely heavily on charts, using tools like indicators, overlays, and oscillators for analysis. Fundamental traders, while they may use charts for timing entries and exits, often prioritize financial news and economic reports over technical analysis. As a trader who emphasizes technical analysis, I’ve found that combining both approaches can provide a more holistic view of the markets.
Personal Preference and Ease of Use
Don’t underestimate the importance of personal preference and ease of use. A charting tool might have all the necessary features but if it’s not user-friendly, it can hinder your trading efficiency. Over my teaching career, I’ve seen many traders struggle with overly complex systems. It’s essential to choose a platform that you find intuitive and comfortable to work with.
Time Frame and Scalability
Consider the time frame and scalability of the charting software. If you’re a day trader, you need software that provides real-time data without lags. Scalability is also important; as your trading evolves, you might need more advanced features. Some platforms offer different versions or subscription models to cater to this need.
Level of Detail and Information Required
Finally, assess the level of detail and information required. Active traders might need access to a variety of technical indicators and drawing tools, while others may only need basic charting capabilities. The level of detail also extends to the number of markets and symbols the software can track – crucial if you’re trading in multiple markets or dealing with a diverse portfolio.
Free vs. Paid Stock Charts
The main difference between free and paid stock charts often lies in the depth of features and real-time data availability.
While paid stock charts offer advanced features, free stock charts can be incredibly effective, especially for beginners or those with limited trading activity. These charts provide essential tools for basic analysis and can be a great starting point for new traders. However, it’s important to choose the right platform. To assist traders in this selection, I’ve compiled a list of the best free stock charts available. These platforms offer a balance of functionality and simplicity, making them ideal for those just starting their trading journey.
Paid charts, used by most professional traders, offer more advanced features like real-time data, comprehensive technical analysis tools, and a wider range of securities, including stocks, forex, and crypto.
In my experience, while free charts are a good starting point, serious traders often find the investment in a paid subscription pays dividends in terms of the quality of their analysis and the results they achieve.
Tips for Effective Chart Analysis
Effective chart analysis is a cornerstone of successful trading, especially in day trading where understanding momentum and market movements is crucial.
To start, familiarize yourself with different chart types and indicators. Use these tools to develop a strategy that aligns with your trading goals and risk tolerance. For instance, momentum traders might focus on indicators like moving averages and RSI (Relative Strength Index) to identify potential entry and exit points. It’s also important to back-test your strategy using historical data to see how it would have performed in past market conditions – this is where studies and example analyses come into play.
Remember, consistency is key. Stick to your chosen analysis methods to avoid being swayed by market noise or emotions.
Also, keep your charts uncluttered; too many indicators can lead to confusion and indecision. Regularly review and adjust your strategy based on market changes and personal performance to stay aligned with your trading objectives.
Keeping it Simple
In chart analysis, simplicity can be key. It’s easy to get overwhelmed with too many indicators or complex techniques. In my years of trading, I’ve found that the most effective strategies are often the simplest. Use a few well-understood tools and resist the temptation to overcomplicate your analysis. This approach helps in maintaining clarity and making more informed decisions.
Consistency in Analysis
Consistency is crucial in chart analysis. Stick to a defined set of rules and criteria when analyzing charts. This consistency helps in developing a reliable strategy and avoids the pitfalls of random, emotion-driven decisions. Over the years, I’ve seen many traders falter by constantly changing their approach; consistency, on the other hand, breeds confidence and improves decision-making.
Continuous Learning and Adaptation
The markets are ever-changing, and so should your approach to chart analysis. Continuous learning and adaptation are vital. Stay updated with the latest techniques, tools, and market trends. Engage with other traders, read relevant books and articles, and consider joining trading communities. In my teaching career, I’ve always emphasized the importance of being a lifelong learner in the trading world.
Avoiding Paralysis by Analysis
Paralysis by analysis occurs when a trader gets so caught up in analyzing data that they fail to make a decision. To avoid this, set clear rules for your trades and stick to them. Remember, no amount of analysis can predict market movements with absolute certainty. Sometimes, taking action based on well-thought-out analysis is better than waiting for the perfect signal that may never come.
Why Are Charts Useful for Trading?
Charts are indispensable tools in the arsenal of a trader, serving multiple roles regardless of the trading style, whether it’s day trading, position trading, or swing trading. They provide a visual representation of market data, making it easier to identify trends, patterns, and potential trading opportunities.
For day traders, charts are essential in capturing the momentum of the market, allowing them to make quick, informed decisions. Charts also facilitate a wide range of technical analysis studies, enabling traders to apply various strategies and indicators to understand market behavior better.
Furthermore, having a visual overview of market movements helps in managing risk more effectively. When linked with a brokerage account, charts can provide real-time data, enhancing the ability to make timely trades.
In essence, charts translate raw market data into a more digestible and actionable format, enabling traders to devise and execute their strategies with greater precision.
Visualization of Market Trends
Charts are invaluable for visualizing market trends. They provide a graphical representation of price movements over time, making it easier to spot trends and patterns. As a trader, I rely heavily on charts to understand where the market is heading. They help in identifying the overall direction of the market, which is essential for making informed trading decisions.
Enhanced Trend Identification
Charts enhance the ability to identify trends. By using various technical analysis tools, traders can spot emerging trends early. This early identification is crucial for maximizing profit potential. In my trading career, spotting trends early has often been the difference between a successful and an average trade.
Pattern Recognition and Analysis
Charts are key in pattern recognition and analysis. Recognizable patterns, like head and shoulders or triangles, can signal future price movements. My experience has taught me the importance of understanding these patterns and using them to anticipate market behavior.
Identification of Support and Resistance
Charts help in identifying support and resistance levels – crucial concepts in technical analysis. These levels can indicate where the price might pause or reverse, providing valuable insights for entry and exit points. As a trader, I use support and resistance to gauge market sentiment and make strategic trading decisions.
Integration of Volume in Analysis
Volume is an important component of chart analysis. It provides insights into the strength of a price movement. High volume on a price increase might suggest strong buying interest, while low volume might indicate a lack of conviction. Integrating volume with price analysis has been a key part of my trading strategy, offering a more comprehensive view of market dynamics.
Key Takeaways
- Select a stock chart and software that align with your trading style and needs.
- Simplicity and consistency in chart analysis are crucial.
- Continuous learning and adaptation are key to successful trading.
- Charts are invaluable for visualizing market trends, identifying trends, patterns, support and resistance, and integrating volume in analysis.
Trading isn’t rocket science. It’s a skill you build and work on like any other. Trading has changed my life, and I think this way of life should be open to more people…
I’ve built my Trading Challenge to pass on the things I had to learn for myself. It’s the kind of community that I wish I had when I was starting out.
We don’t accept everyone. If you’re up for the challenge — I want to hear from you.
Apply to the Trading Challenge here.
Trading is a battlefield. The more knowledge you have, the better prepared you’ll be.
How do you use charts in your trading strategy? Let me know in the comments — I love hearing from my readers!
Frequently Asked Questions
How Do I Read Candlestick Patterns?
Reading candlestick patterns involves understanding the relationship between the open, high, low, and close of a price. Each candlestick provides information about market sentiment. For instance, a long green candlestick typically indicates strong buying pressure, while a long red candlestick signals strong selling pressure. Learning common patterns like doji, hammer, and engulfing can provide insights into potential market reversals or continuations.
How Do I Add Indicators and Overlays to My Chart?
To add indicators and overlays to your chart, first select the charting software that supports these features. Most platforms have a menu or toolbar where you can choose from a variety of indicators like moving averages, RSI, or Bollinger Bands. Overlays, such as Fibonacci retracement or trendlines, can also be added similarly. It’s important to understand the purpose of each indicator or overlay to use them effectively in your analysis.
Where Can I Chart Stocks for Free?
There are several platforms where you can chart stocks for free. Some popular options include TradingView, Yahoo Finance, and StockCharts.com. These platforms typically offer basic charting tools and delayed data, which can be sufficient for beginners or long-term investors. However, for more advanced features and real-time data, you may need to consider a paid subscription.

Leave a reply