By the time you read this, I’ll be up on stage in Miami, speaking to a room full of trading students eager to take their game to the next level.
This is what I live for…not the luxury travel or dining at Michelin restaurants.
I want to leave this world a better place than I found it.
That’s why I hop around the globe, helping charities make life better for everyone.
When I trade, MY STUDENTS ARE MY SOLE FOCUS!
I relay every opportunity I find and alert them to every danger I see.
Folks that join my MILLIONAIRE CHALLENGE get access to literally years of video content I created over the last two decades.
My goal isn’t to make someone a millionaire overnight. I want to make them a millionaire in their lifetime.
So far, I’ve got more than 20 students who’ve hit that mark, many of them on stage with me over the next two days.
As they tell their stories, most folks are surprised that the one key that links them together isn’t their strategy or a specific setup…
It’s their risk management.
Every one of my students that’s become a trading millionaire knows how to maximize gains.
But what sets them apart is they know how to minimize losses.
Right now, that’s more important than ever.
You’ve probably seen or heard comparisons between this market and 2008 or the 1970s.
That sounds absurd, right?
Actually, there might be something to this idea.
In fact, it comes straight out of the same concepts I teach my Millionaire Challenge students.
And if I’m right, there could be rough waters ahead for months, even years.
Here’s why…
2022 vs 2008
This graphic has been floating around on the internet for the last few months.
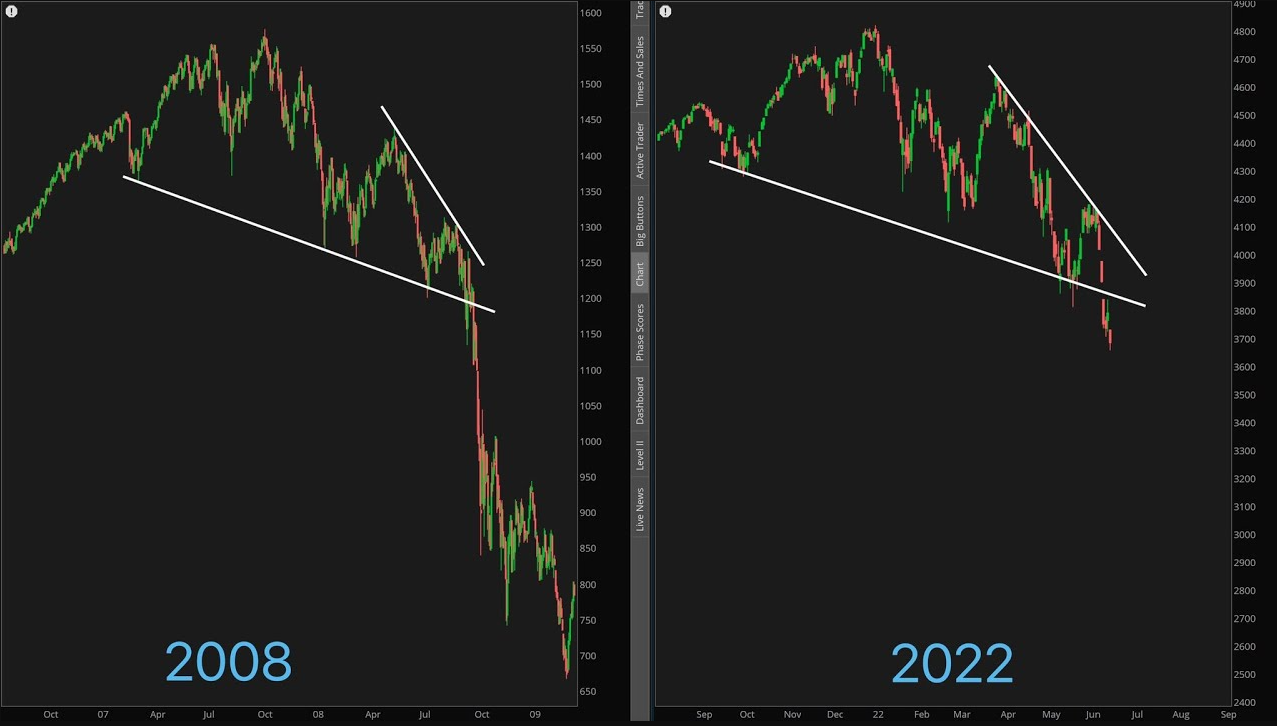
The pattern is rather similar.
Many of you are familiar with my 7-Step Penny Stock Framework.
This process I discovered years ago plays out time and again on penny stocks, meme stocks, cryptos, or wherever a bubble might form.
And it plays out in major markets as well.
Now, I don’t expect the market to make as dramatic of a pattern as the framework entails. Nor do I expect it to fade into oblivion.
However, I do believe it will follow similar phases.
We’ve seen this happen before.
This is a chart of the Nasdaq Composite Index when it imploded during the dotcom bubble.
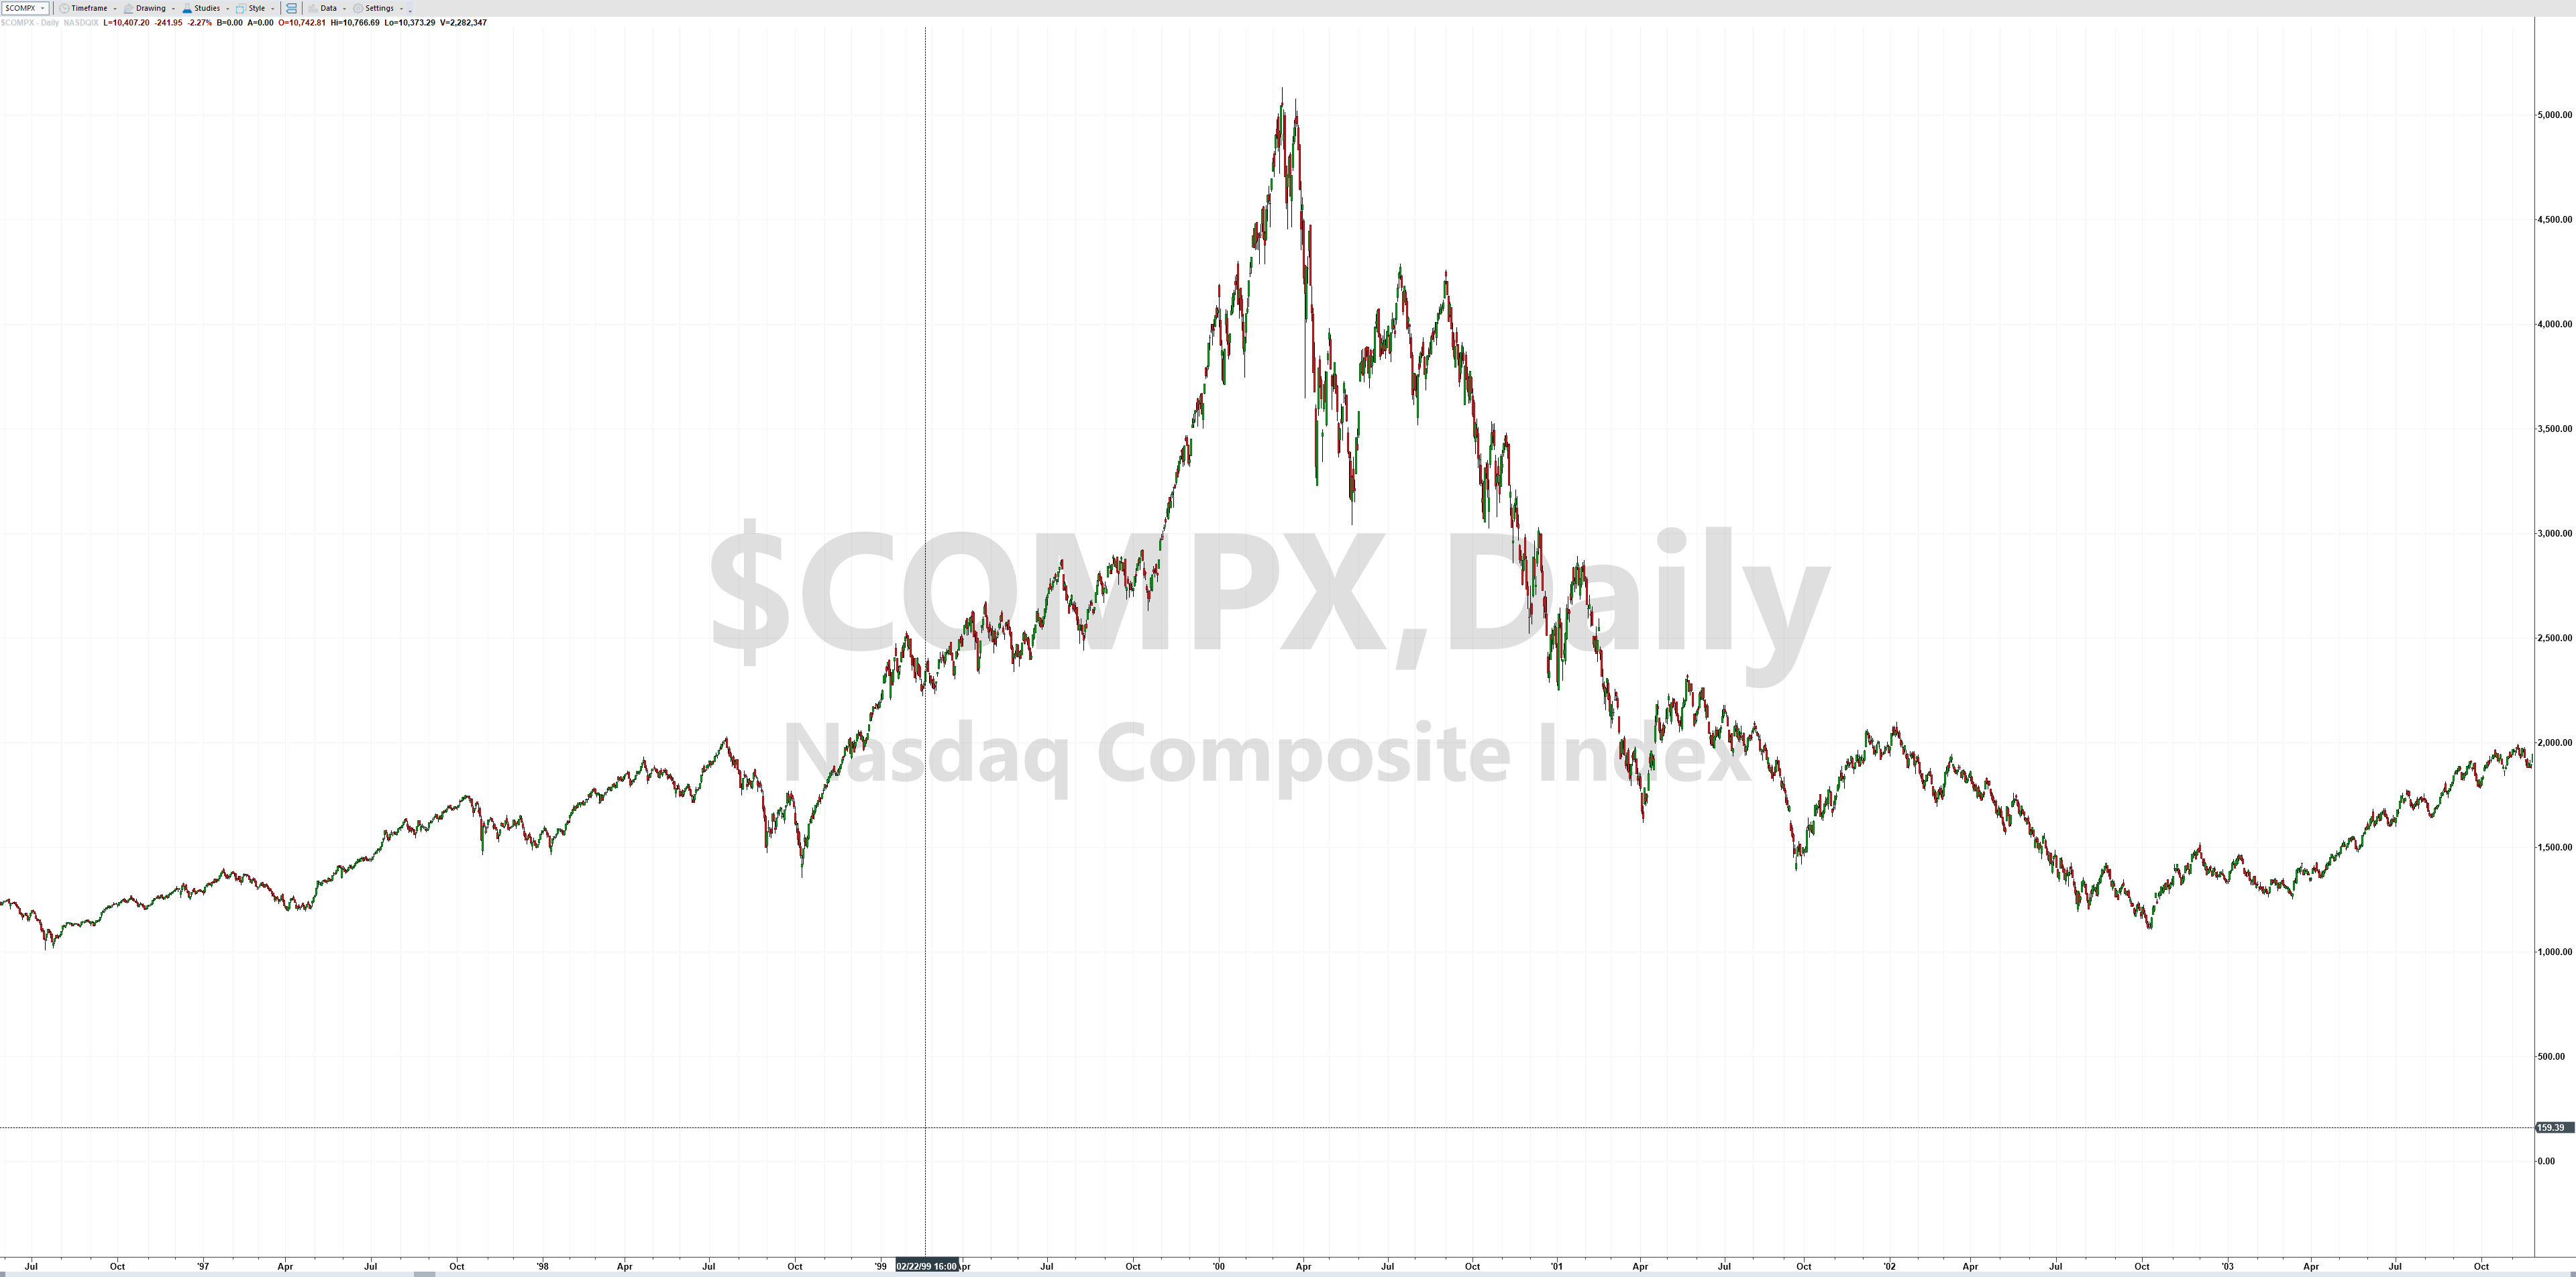
I want you to compare this to the 7-Step Penny Stock Framework and tell me it didn’t follow the same pattern.
If markets were to follow a similar path, we could still be a long ways from the bottom.
And there are a lot of reasons this is probably true.
At a macro level, the global economy looks just like it did in the 1970s:
- Uncontrolled inflation
- Supply chain disruptions
- Energy crisis
- Geopolitical conflict
- Government partisanship
It took us 10 years to pull out of the malaise that was the ‘70s.
If you look at our economy, none of the issues we face seem close to resolution.
The question shouldn’t be why won’t stocks rebound it should be how can they not go lower.
Thankfully, I use the 7-Step Penny Stock Framework to prepare my students for either scenario.
They know what to look for in dip buys and what true rallies look like.
As I’ve noted before, I’m keeping my position sizes small and lightly testing the waters in various sectors.
I won’t make a lot of money this way. But I WILL know when the markets are turning around.
Until then, I’m being extra careful because if markets crack, penny stocks won’t just drop a few percentage points. They can fall dozens of percentage points in minutes.
The Bottom Line
Markets hate uncertainty. Unfortunately, we have that in spades right now.
Instead of trying to force trades, I stick with my process using my StocksToTrade platform, its Breaking News chat, and my time-tested chart patterns to ONLY take premium plays.
Because right now isn’t the time to be a hero. It’s the time to prepare to become one.
–Tim

Leave a reply