No one takes a road trip without directions or, at the very least, a map.
But that’s what you do when you trade without a chart pattern.
Chart patterns are the very foundation of what I teach and how I, and many of my millionaire students, trade.
By now, most of you have heard about my #1 pattern – Supernovas.
This was the first pattern I came across that totally changed my life.
Now, I want to let you in on a little secret.
Chart patterns are about more than just visuals. It’s about the narrative they tell.
When I look at a chart pattern, I don’t just see numbers. I see a novel written about the transactions between buyers and sellers.
One of my top millionaire students, Mark Crook, did an excellent review of BrightMinds Biosciences Inc. (NASDAQ: DRUG) for my challenge students.
Normally, I’d keep this material exclusive to them.
However, Mark’s analysis was so spot on that I just had to share it with you.
I’ll explain his trade and, more importantly, WHY he took it.
Do You Supernova?

At the start of 2022, many of the Supernovas flamed out the same day they spiked.
In July, that changed as we saw more and more multi-day runners.
However, as I mentioned in one of my previous newsletters, I expect the bullishness to die off towards the end of the month.
My 7-step penny stock framework, which you can read about here, lists the various phases of the pattern.
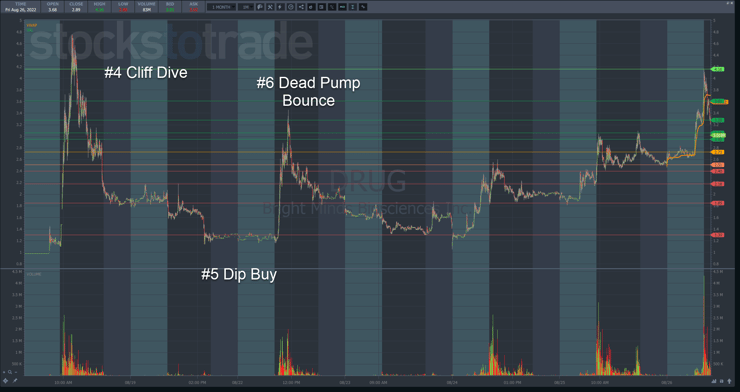
As Mark pointed out, within that framework, most people probably expected the stock to fall into #7, the long kiss goodnight, after the second spike that made a lower high (#6).
Normally, a stock gets to that point and fades into oblivion with some bounces here and there along the way.
Those small bounces are great plays for dip buys.
However, this stock did something very different.
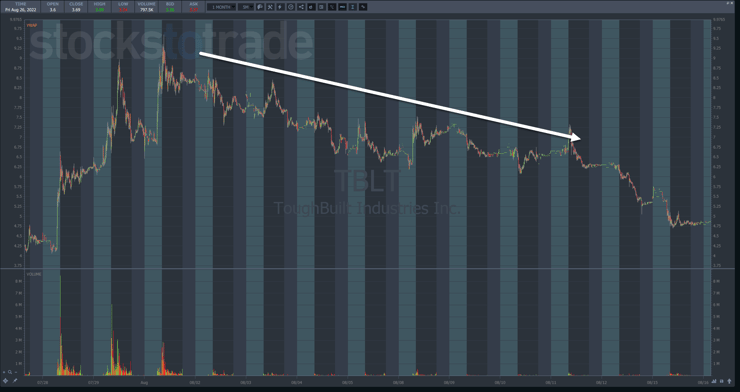
You see, normally, stocks do something like this…
…where they bounce now and then but slowly fade into oblivion.
Instead of taking this typical path, DRUG held the $1.30 low from the dip buy on light volume.
More Breaking News
- Stock Reevaluation: Ondas Inc Grapples with Market Challenges Amid Lower Q3 Results
- GGB Stock Hovers as Market Reactions Vary Amid Market Speculation
- Vale’s Stock Soars Following Significant Price Target Increases
- Price Predictions Fueled by Company Moves In Market Dynamics
But slowly, shares began to climb as volume increased.
Over the next two days, DRUG popped and consolidated to form a bullish formation.
Think about that for a moment.
A stock that’s had a tremendous run found support on light volume.
To me, that says there were few, if any, sellers at that spot.
Once buyers became more aggressive, shares began to rise.
Although there was evidence the stock wanted to make another push after the first push on the 24th, the second day’s push solidified this notion.
At that point, it makes all the sense in the world to look for a move through the highs at $3.40 from the dead pump bounce.
The key was not the lower highs but the higher lows. That narrowed the trading range, creating the elements necessary to squeeze higher.
And when the stock began to make a higher high, the writing was on the wall.
Mark took a small trade, entering somewhere around $2.70 and exiting part of the trade at around $3.00.
However, the story told by the pattern here is what’s important.
Consolidation patterns by themselves are meaningless without context.
For example, the dead pump bounce created a bullish consolidation that failed.
Why didn’t the one that came after that?
It all comes down to where they occurred in the 7-step framework and the associated price action.
That first bounce is typical after a stock goes Supernova.
The resurgence on heavy volume after that is unusual and more indicative of a spike in a previous runner that we see weeks to months down the road.
Nonetheless, the price action says what it says.
Higher lows and higher highs on heavy trading speak volumes.
Spend time learning your chart patterns. But, don’t just look for the obvious ones. Study the failures and the unusual ones like DRUG.
Look at the price action and ask yourself: what’s it trying to tell me right here?
And when you’re ready, join me in the millionaire challenge.
—Tim


Leave a reply