

Suncor Energy Inc. stocks have been trading up by 4.46 percent amid strong oil price gains and upbeat sector outlook.
What Traders Need To Know
- Suncor Energy Inc. is selling its Terra Nova, White Rose and West White Rose stakes to Ithaca Energy for up to CA$1.55B, with Ithaca taking on major future investment and abandonment liabilities.
- The company is accelerating share repurchases under its normal course issuer bid to CA$750M per month from CA$500M, boosting capital returns.
- The divestiture of non-core offshore assets sharpens Suncor’s focus on oil sands while shedding about CA$1.4B in abandonment and lease obligations.
- Multiple brokers including UBS, RBC, CIBC, Raymond James and Jefferies have raised price targets on SU, mostly with positive ratings like Buy and Outperform.
- ExxonMobil and Suncor are seeking to block a Boulder, Colorado climate-damages lawsuit at the U.S. Supreme Court, adding a legal and ESG overhang for the stock.
Weekly Update Oct 12 – Oct 16, 2026: On Sunday, October 18, 2026 Suncor Energy Inc. stock [NYSE: SU] is trending up by 4.46%! Discover the key drivers behind this movement as well as our expert analysis in the detailed breakdown below.
Energy industry expert:
Analyst sentiment – positive
Suncor’s fundamentals position it as a top‑tier integrated oil sands levered cash‑flow story. EBIT margin of 21% and EBITDA margin of 33% on C$52.4B revenue confirm strong upstream and downstream integration, with ROE at 19–31% and ROIC in the mid‑teens, well above sector averages. Balance sheet strength is solid: net leverage low with total debt‑to‑equity of 0.3, interest coverage ~25x, and current ratio 1.7. FCF of C$4.3B in the latest quarter easily covers dividends and buybacks.
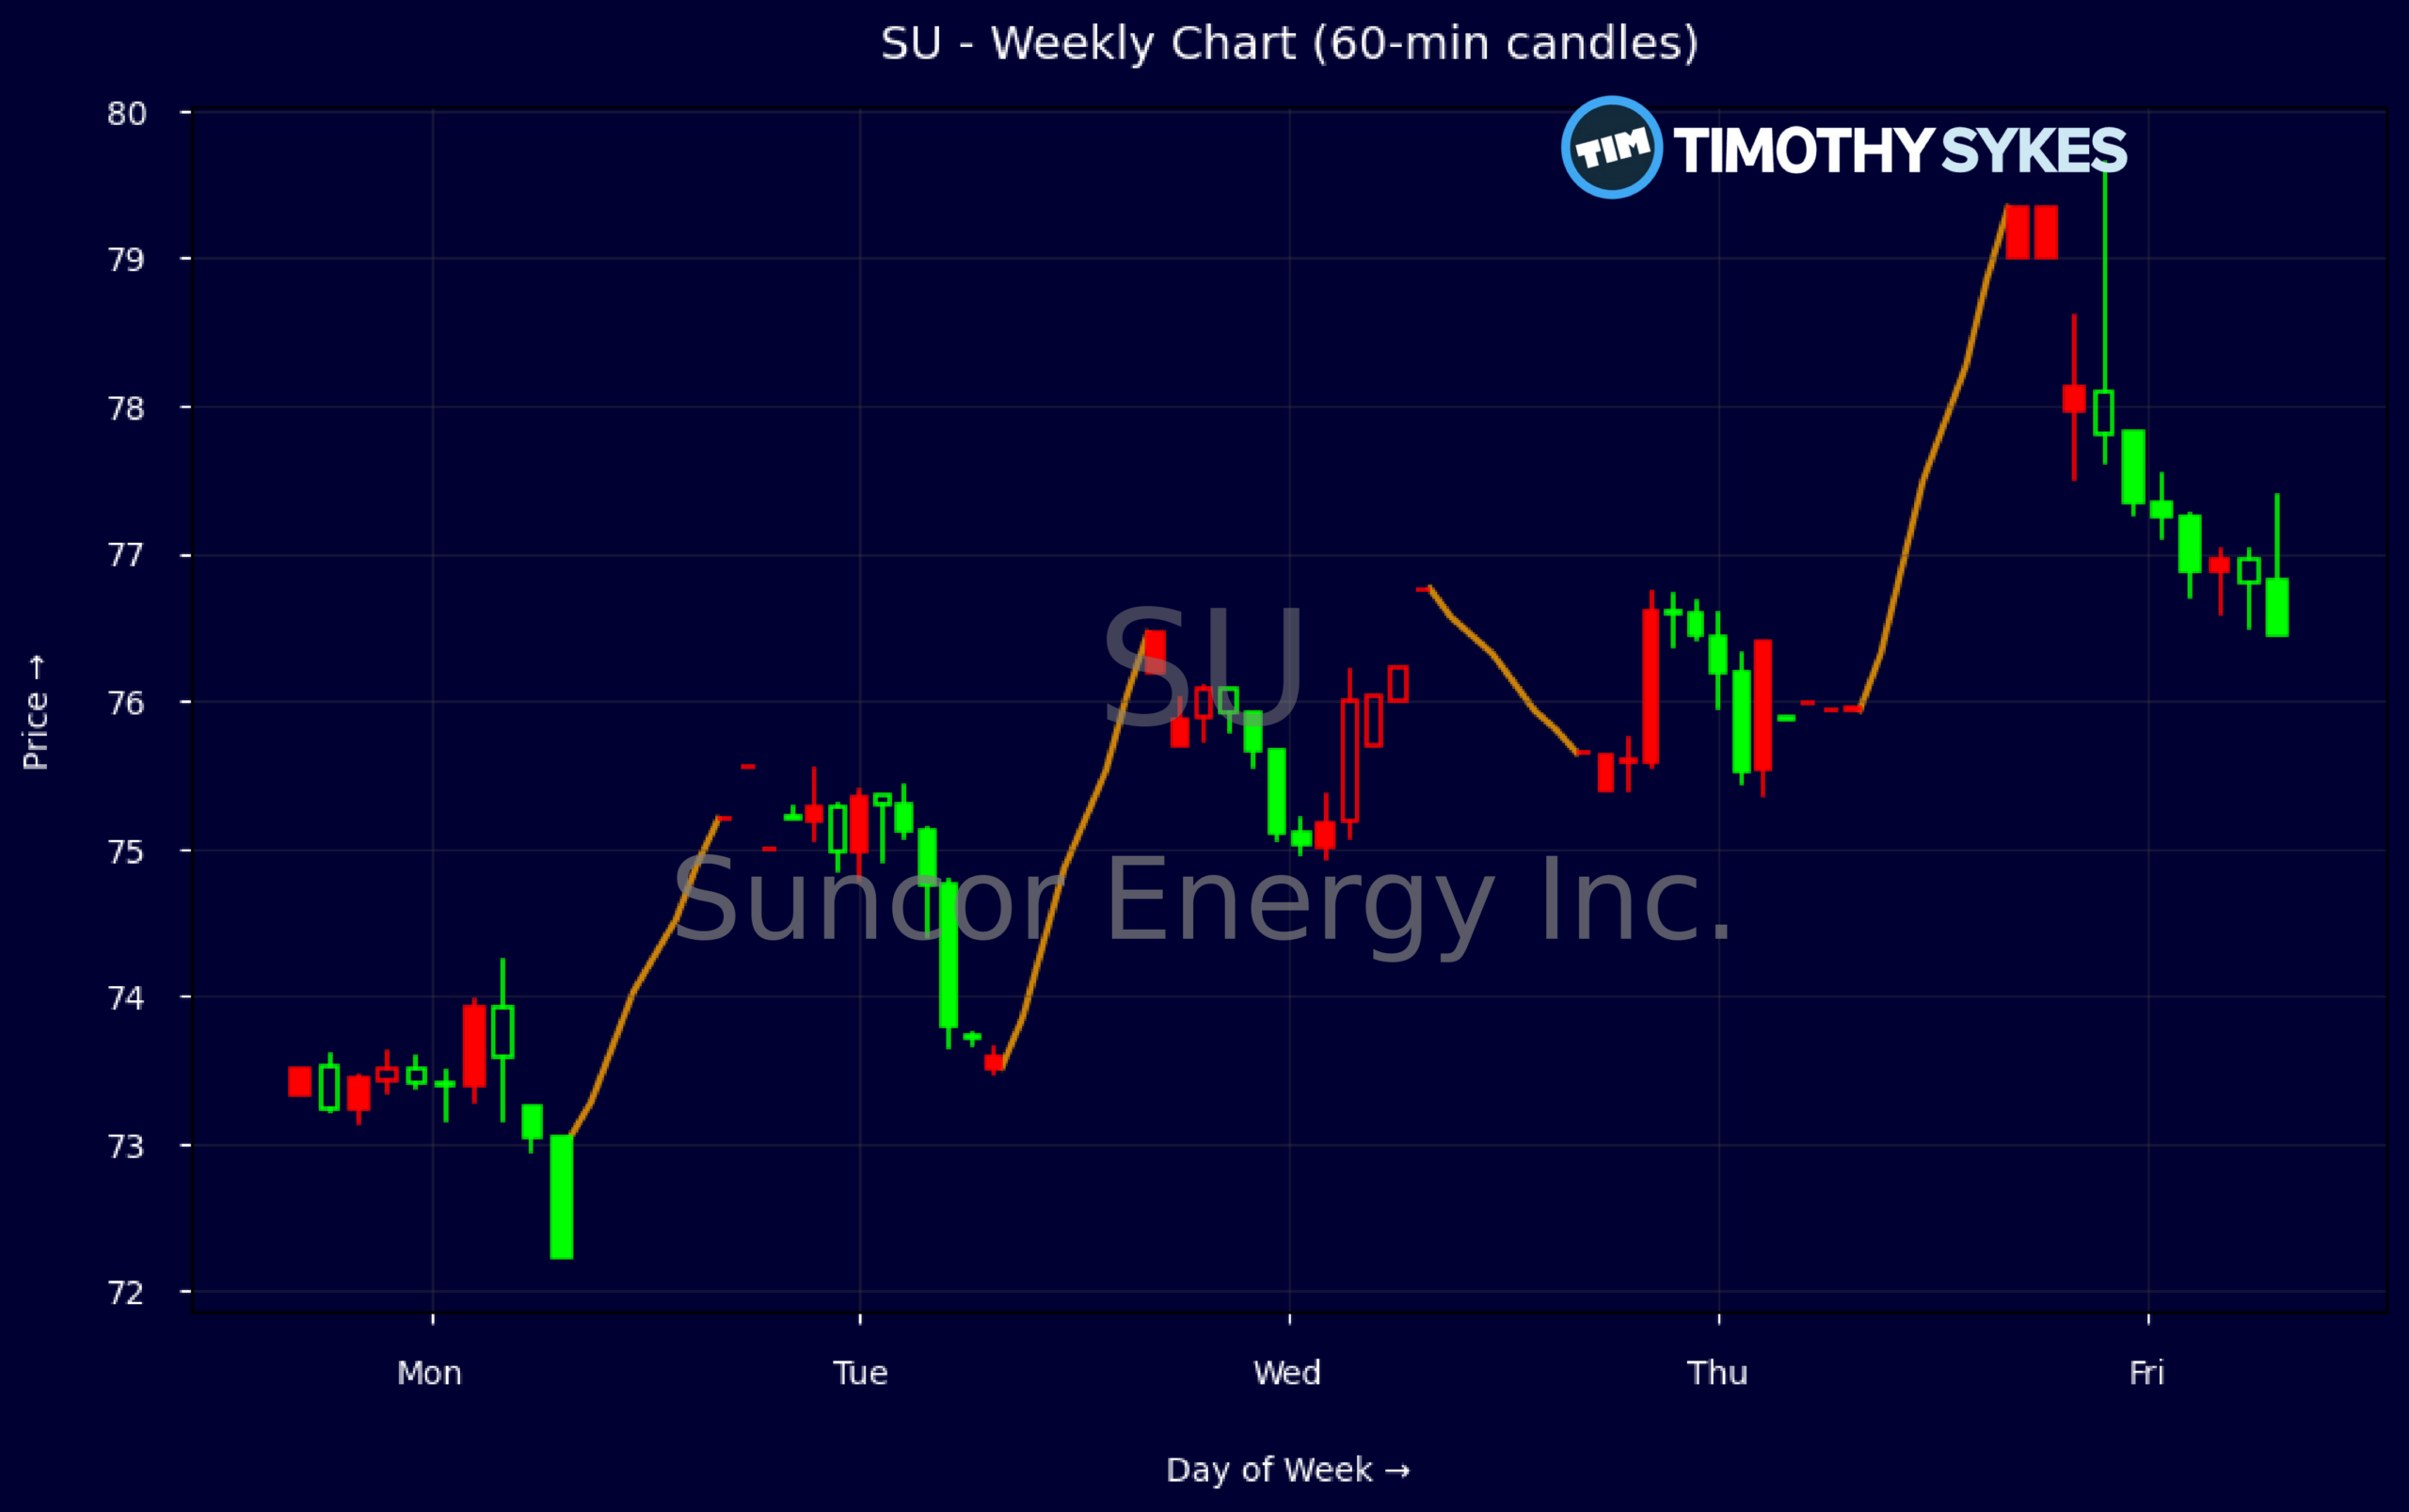
Technically, the dominant trend is firmly bullish. The weekly sequence from 73.34 to 79.01 shows higher highs and higher lows, with strong upside extension on the latest bar, consistent with rising volume and aggressive institutional demand. Intraday 5‑minute candles show repeated dip‑buying around 75–76 and no meaningful selling tail into the close. Actionable level: 75.50–76.00 is now key support; above it, momentum traders can target a near‑term push into the low‑80s.
Catalysts and outlook are strongly favorable versus the broader Energy and Fossil Fuels group. Suncor is monetizing non‑core offshore assets for up to C$1.55B while offloading ~C$1.9B in abandonment liabilities, tightening strategic focus on high‑margin oil sands. Concurrently, buybacks ramp to C$750M/month, amplifying CFPS growth. With consensus targets clustered at C$110–120 and current price ~C$76, I see an attractive risk‑reward skew; fair value is C$110 with support at C$75 and resistance at C$90, then C$105.
More Breaking News
Quick Financial Overview
Suncor Energy Inc. is pairing a strategic portfolio cleanup with aggressive capital returns. The sale of its Terra Nova, White Rose and West White Rose stakes to Ithaca Energy for up to CA$1.55B moves non-core offshore risk off the books and hands Ithaca sizable future spending and abandonment liabilities. For traders, that means a leaner asset base and more flexibility in how cash is deployed, a clear positive backdrop for SU’s equity story.
Financially, Suncor is throwing off solid cash. Quarterly revenue of about $19.01B supports EBITDA of roughly $6.89B and net income of $3.73B, with an EBIT margin above 20% and profit margin near 15%. Operating cash flow of $5.66B and free cash flow of $4.31B in the latest quarter give room to fund CA$750M per month in buybacks and a dividend yielding a bit over 2%. Leverage looks controlled with total debt to equity of 0.3 and interest coverage of 24.8.
On valuation, a P/E around 13.7 and price-to-cash-flow near 9.4 sit in a reasonable band for an integrated oil name with returns on equity above 19%. The weekly chart shows SU grinding higher from about CA$73 early in the week to a close near CA$79, with intraday action printing a strong range from roughly CA$76.50 to CA$79.65 before settling near CA$78.05. That tells you dip-buyers are active, absorbing supply on pullbacks. With the stock around CA$76–79 and major banks’ average targets near CA$107–110, the Street is still pricing in sizable upside, though that is a reference point, not a trading guarantee.
Conclusion
Smart Money Focuses On Cash, Catalysts, And Risk
Suncor Energy Inc. is lining up several elements traders like to see: asset simplification, strong free cash flow, and an accelerated buyback that can tighten the float over time. The Ithaca Energy deal recycles up to CA$1.55B out of non-core offshore projects, strips away about CA$1.4B of abandonment and lease liabilities, and lets management lean harder into the oil sands, where SU already has scale. That combination backs the bullish cluster of price target hikes from UBS, RBC, CIBC, Raymond James and Jefferies.
At the same time, SU is not a one-way bet. The Supreme Court climate case alongside ExxonMobil keeps a legal and ESG cloud over the name, and the modest share dip on the deal headline shows the market still questions pricing, timing, or macro risk. Weekly and intraday charts signal firm buying interest on weakness, but traders should anchor plans around clear levels, volatility, and their own risk limits rather than analyst targets alone.
For short-term and swing-focused traders, SU now trades as a cash-rich, catalyst-driven story with a visible capital return engine and an elevated but defined headline risk. As millionaire penny stock trader and teacher Tim Sykes says, “Preparation plus patience leads to big profits.” As I tell my students, “The edge isn’t in predicting the future – it’s in reading the tape, knowing the catalysts, and sizing the risk so one trade never defines your career.”
This is stock news, not investment advice. Timothy Sykes News delivers real-time stock market news focused on key catalysts driving short-term price movements. Our content is tailored for active traders and investors seeking to capitalize on rapid price fluctuations, particularly in volatile sectors like penny stocks. Readers come to us for detailed coverage on earnings reports, mergers, FDA approvals, new contracts, and unusual trading volumes that can trigger significant short-term price action. Some users utilize our news to explain sudden stock movements, while others rely on it for diligent research into potential investment opportunities.
Dive deeper into the world of trading with Timothy Sykes, renowned for his expertise in penny stocks. Explore his top picks and discover the strategies that have propelled him to success with these articles:
- Penny Stocks Trading Guide
- Best Penny Stocks Under $1 to Buy Today
- Top 8 Penny Stocks to Watch on Robinhood
Once you’ve got some stocks on watch, elevate your trading game with StocksToTrade the ultimate platform for traders. With specialized tools for swing and day trading, StocksToTrade will guide you through the market’s twists and turns.
Dig into StocksToTrade’s watchlists here:





Leave a reply