
timothy sykes logo
SoFi Technologies Inc. Falls 2% Thumbnail

SoFi Technologies Inc. Falls 2%

TIMOTHY SYKES•UPDATED NOV. 17, 2026, 10:50 AM ET

SoFi shares fell 2%, most likely on broader bank-stock selling tied to growth concerns and higher interest rates.
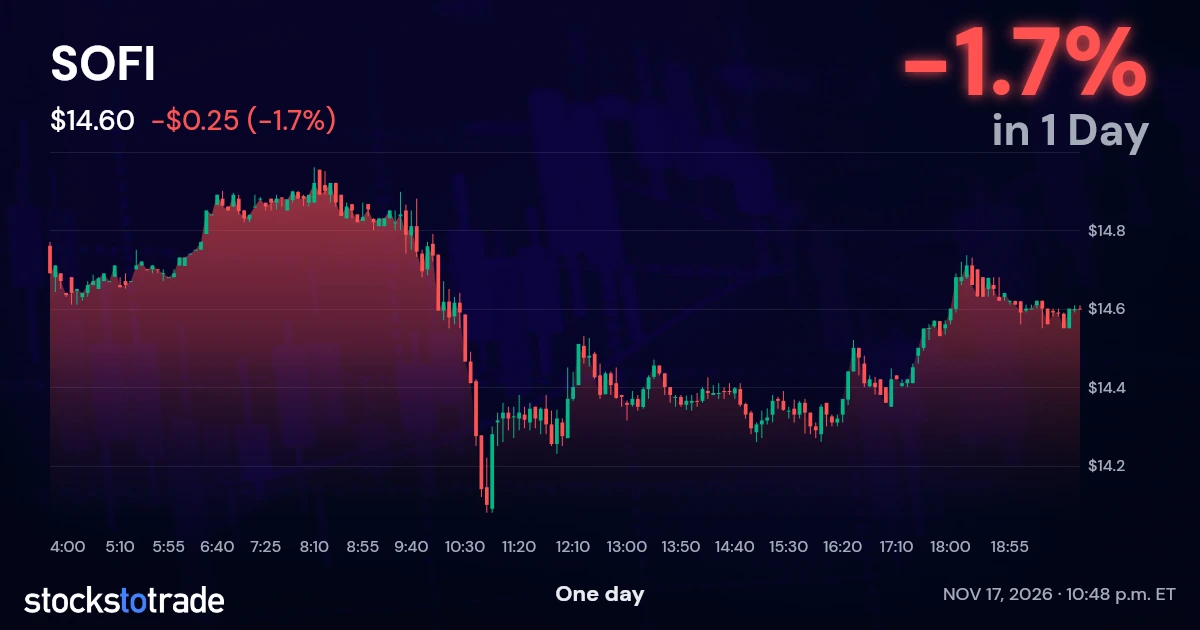
SOFI Candlestick Chart

Why SoFi Stock Fell 2% Today

SoFi Technologies Inc. last traded at $14.60 in after-hours trading, meaning trading after the regular session, down 2% from the prior close. Bank stocks also fell amid growth worries and higher interest rates, giving SoFi’s decline a broader market backdrop. No fresh company announcement establishes a separate trigger.

SoFi Shares Fade After Early High

Shares reached a high in the high $14s in premarket trading, meaning trading before the regular session, before falling toward the low $14s. That path shows the early strength did not last through the session.

SoFi Lending Concerns Predate Today’s Drop

We last covered SoFi in November, when shares fell 8% after an analyst lowered its estimate of their future value. That earlier assessment raised concerns about consumer lending, interest rates and growth in loans the company holds. Holding more loans can increase interest income, but also leaves more money exposed if borrowers stop paying.

SoFi Faces Broader Bank Selling

the Financial Select Sector SPDR Fund (XLF), a fund holding major financial companies, was down 2%, showing that selling extended beyond SoFi. Higher borrowing costs can discourage customers from taking loans, which limits lenders’ opportunities to earn interest.

Quick Financial Overview

SoFi is profitable and is a large-cap, meaning a company with a substantial stock-market value of $18.95B. It reported $2.81B in cash and cash equivalents, meaning cash the company can spend, as of September 30, 2026.

What SoFi Technologies Inc. Does

SoFi offers loans, bank accounts and investment accounts through a digital platform. Offering these services together gives customers more reasons to keep their financial business with the company.

SoFi Revenue and Quarterly Profit

Quarterly revenue was $1.39B, with net income of $241.0M. Those results show the business generates a profit, even while its shares face selling pressure.

SoFi Operating Cash Flow Used $3.01B

Normal business, including lending, used $3.01B in cash, implying about three months of spending covered if that cash-use rate continued. For a lender, cash going into loans differs from money spent running an unprofitable business. That calculation alone does not establish a need to sell new shares.

SoFi Stock Retreats From the mid $16s

SoFi traded around the mid $16s five sessions ago, putting today’s decline inside an existing retreat. The stock also recorded a daily move this large as recently as the prior session. Today’s move therefore does not stand out as an isolated break from its recent behavior.

SoFi Earnings Date

The next earnings entry is Friday, consensus $0.20, with consensus meaning analysts’ combined estimate of profit per share. The calendar date still needs confirmation.

Conclusion

Friday’s listed earnings checkpoint puts the focus on loan performance and management’s outlook. Stable borrower payments alongside continued growth would support the business case, while weaker repayment trends would give investors a concrete reason to reassess it.

This is stock news, not investment advice. Timothy Sykes News delivers real-time stock market news focused on key catalysts driving short-term price movements. Our content is tailored for active traders and investors seeking to capitalize on rapid price fluctuations, particularly in volatile sectors like penny stocks. Readers come to us for detailed coverage on earnings reports, mergers, FDA approvals, new contracts, and unusual trading volumes that can trigger significant short-term price action. Some users utilize our news to explain sudden stock movements, while others rely on it for diligent research into potential investment opportunities.

Dive deeper into the world of trading with Timothy Sykes, renowned for his expertise in penny stocks. Explore his top picks and discover the strategies that have propelled him to success with these articles:

Once you’ve got some stocks on watch, elevate your trading game with StocksToTrade the ultimate platform for traders. With specialized tools for swing and day trading, StocksToTrade will guide you through the market’s twists and turns.
Dig into StocksToTrade’s watchlists here:



How much has this post helped you?


Leave a reply

* Results are not typical and will vary from person to person. Making money trading stocks takes time, dedication, and hard work. There are inherent risks involved with investing in the stock market, including the loss of your investment. Past performance in the market is not indicative of future results. Any investment is at your own risk. See Terms of Service here

The available research on day trading suggests that most active traders lose money. Fees and overtrading are major contributors to these losses.

A 2000 study called “Trading is Hazardous to Your Wealth: The Common Stock Investment Performance of Individual Investors” evaluated 66,465 U.S. households that held stocks from 1991 to 1996. The households that traded most averaged an 11.4% annual return during a period where the overall market gained 17.9%. These lower returns were attributed to overconfidence.

A 2014 paper (revised 2019) titled “Learning Fast or Slow?” analyzed the complete transaction history of the Taiwan Stock Exchange between 1992 and 2006. It looked at the ongoing performance of day traders in this sample, and found that 97% of day traders can expect to lose money from trading, and more than 90% of all day trading volume can be traced to investors who predictably lose money. Additionally, it tied the behavior of gamblers and drivers who get more speeding tickets to overtrading, and cited studies showing that legalized gambling has an inverse effect on trading volume.

A 2019 research study (revised 2020) called “Day Trading for a Living?” observed 19,646 Brazilian futures contract traders who started day trading from 2013 to 2015, and recorded two years of their trading activity. The study authors found that 97% of traders with more than 300 days actively trading lost money, and only 1.1% earned more than the Brazilian minimum wage ($16 USD per day). They hypothesized that the greater returns shown in previous studies did not differentiate between frequent day traders and those who traded rarely, and that more frequent trading activity decreases the chance of profitability.

These studies show the wide variance of the available data on day trading profitability. One thing that seems clear from the research is that most day traders lose money .

Millionaire Media 66 W Flagler St. Ste. 900 Miami, FL 33130 United States (888) 878-3621 This is for information purposes only as Millionaire Media LLC nor Timothy Sykes is registered as a securities broker-dealer or an investment adviser. No information herein is intended as securities brokerage, investment, tax, accounting or legal advice, as an offer or solicitation of an offer to sell or buy, or as an endorsement, recommendation or sponsorship of any company, security or fund. Millionaire Media LLC and Timothy Sykes cannot and does not assess, verify or guarantee the adequacy, accuracy or completeness of any information, the suitability or profitability of any particular investment, or the potential value of any investment or informational source. The reader bears responsibility for his/her own investment research and decisions, should seek the advice of a qualified securities professional before making any investment, and investigate and fully understand any and all risks before investing. Millionaire Media LLC and Timothy Sykes in no way warrants the solvency, financial condition, or investment advisability of any of the securities mentioned in communications or websites. In addition, Millionaire Media LLC and Timothy Sykes accepts no liability whatsoever for any direct or consequential loss arising from any use of this information. This information is not intended to be used as the sole basis of any investment decision, nor should it be construed as advice designed to meet the investment needs of any particular investor. Past performance is not necessarily indicative of future returns.

Citations for Disclaimer

Barber, Brad M. and Odean, Terrance, Trading is Hazardous to Your Wealth: The Common Stock Investment Performance of Individual Investors. Available at SSRN: “Day Trading for a Living?”

Barber, Brad M. and Lee, Yi-Tsung and Liu, Yu-Jane and Odean, Terrance and Zhang, Ke, Learning Fast or Slow? (May 28, 2019). Forthcoming: Review of Asset Pricing Studies, Available at SSRN: “https://ssrn.com/abstract=2535636”

Chague, Fernando and De-Losso, Rodrigo and Giovannetti, Bruno, Day Trading for a Living? (June 11, 2020). Available at SSRN: “https://ssrn.com/abstract=3423101”