

SoFi Technologies Inc. stocks have been trading down by -4.57 percent amid bearish analyst sentiment and growing regulatory concerns.
Key Takeaways
- Keefe Bruyette Woods cut its SoFi Technologies price target to $15 from $16 and reiterated an Underperform rating.
- The firm cited fair value accounting dynamics, rising interest rates, and rapid balance sheet growth as factors creating an estimated greater-than-$1B headwind in Q3.
- Keefe Bruyette expects these dynamics to drive elevated loan growth but reduced capital levels for SoFi.
- An insider or large holder has filed a Form 144, signaling an intention to sell restricted or control securities of SoFi Technologies under SEC Rule 144.
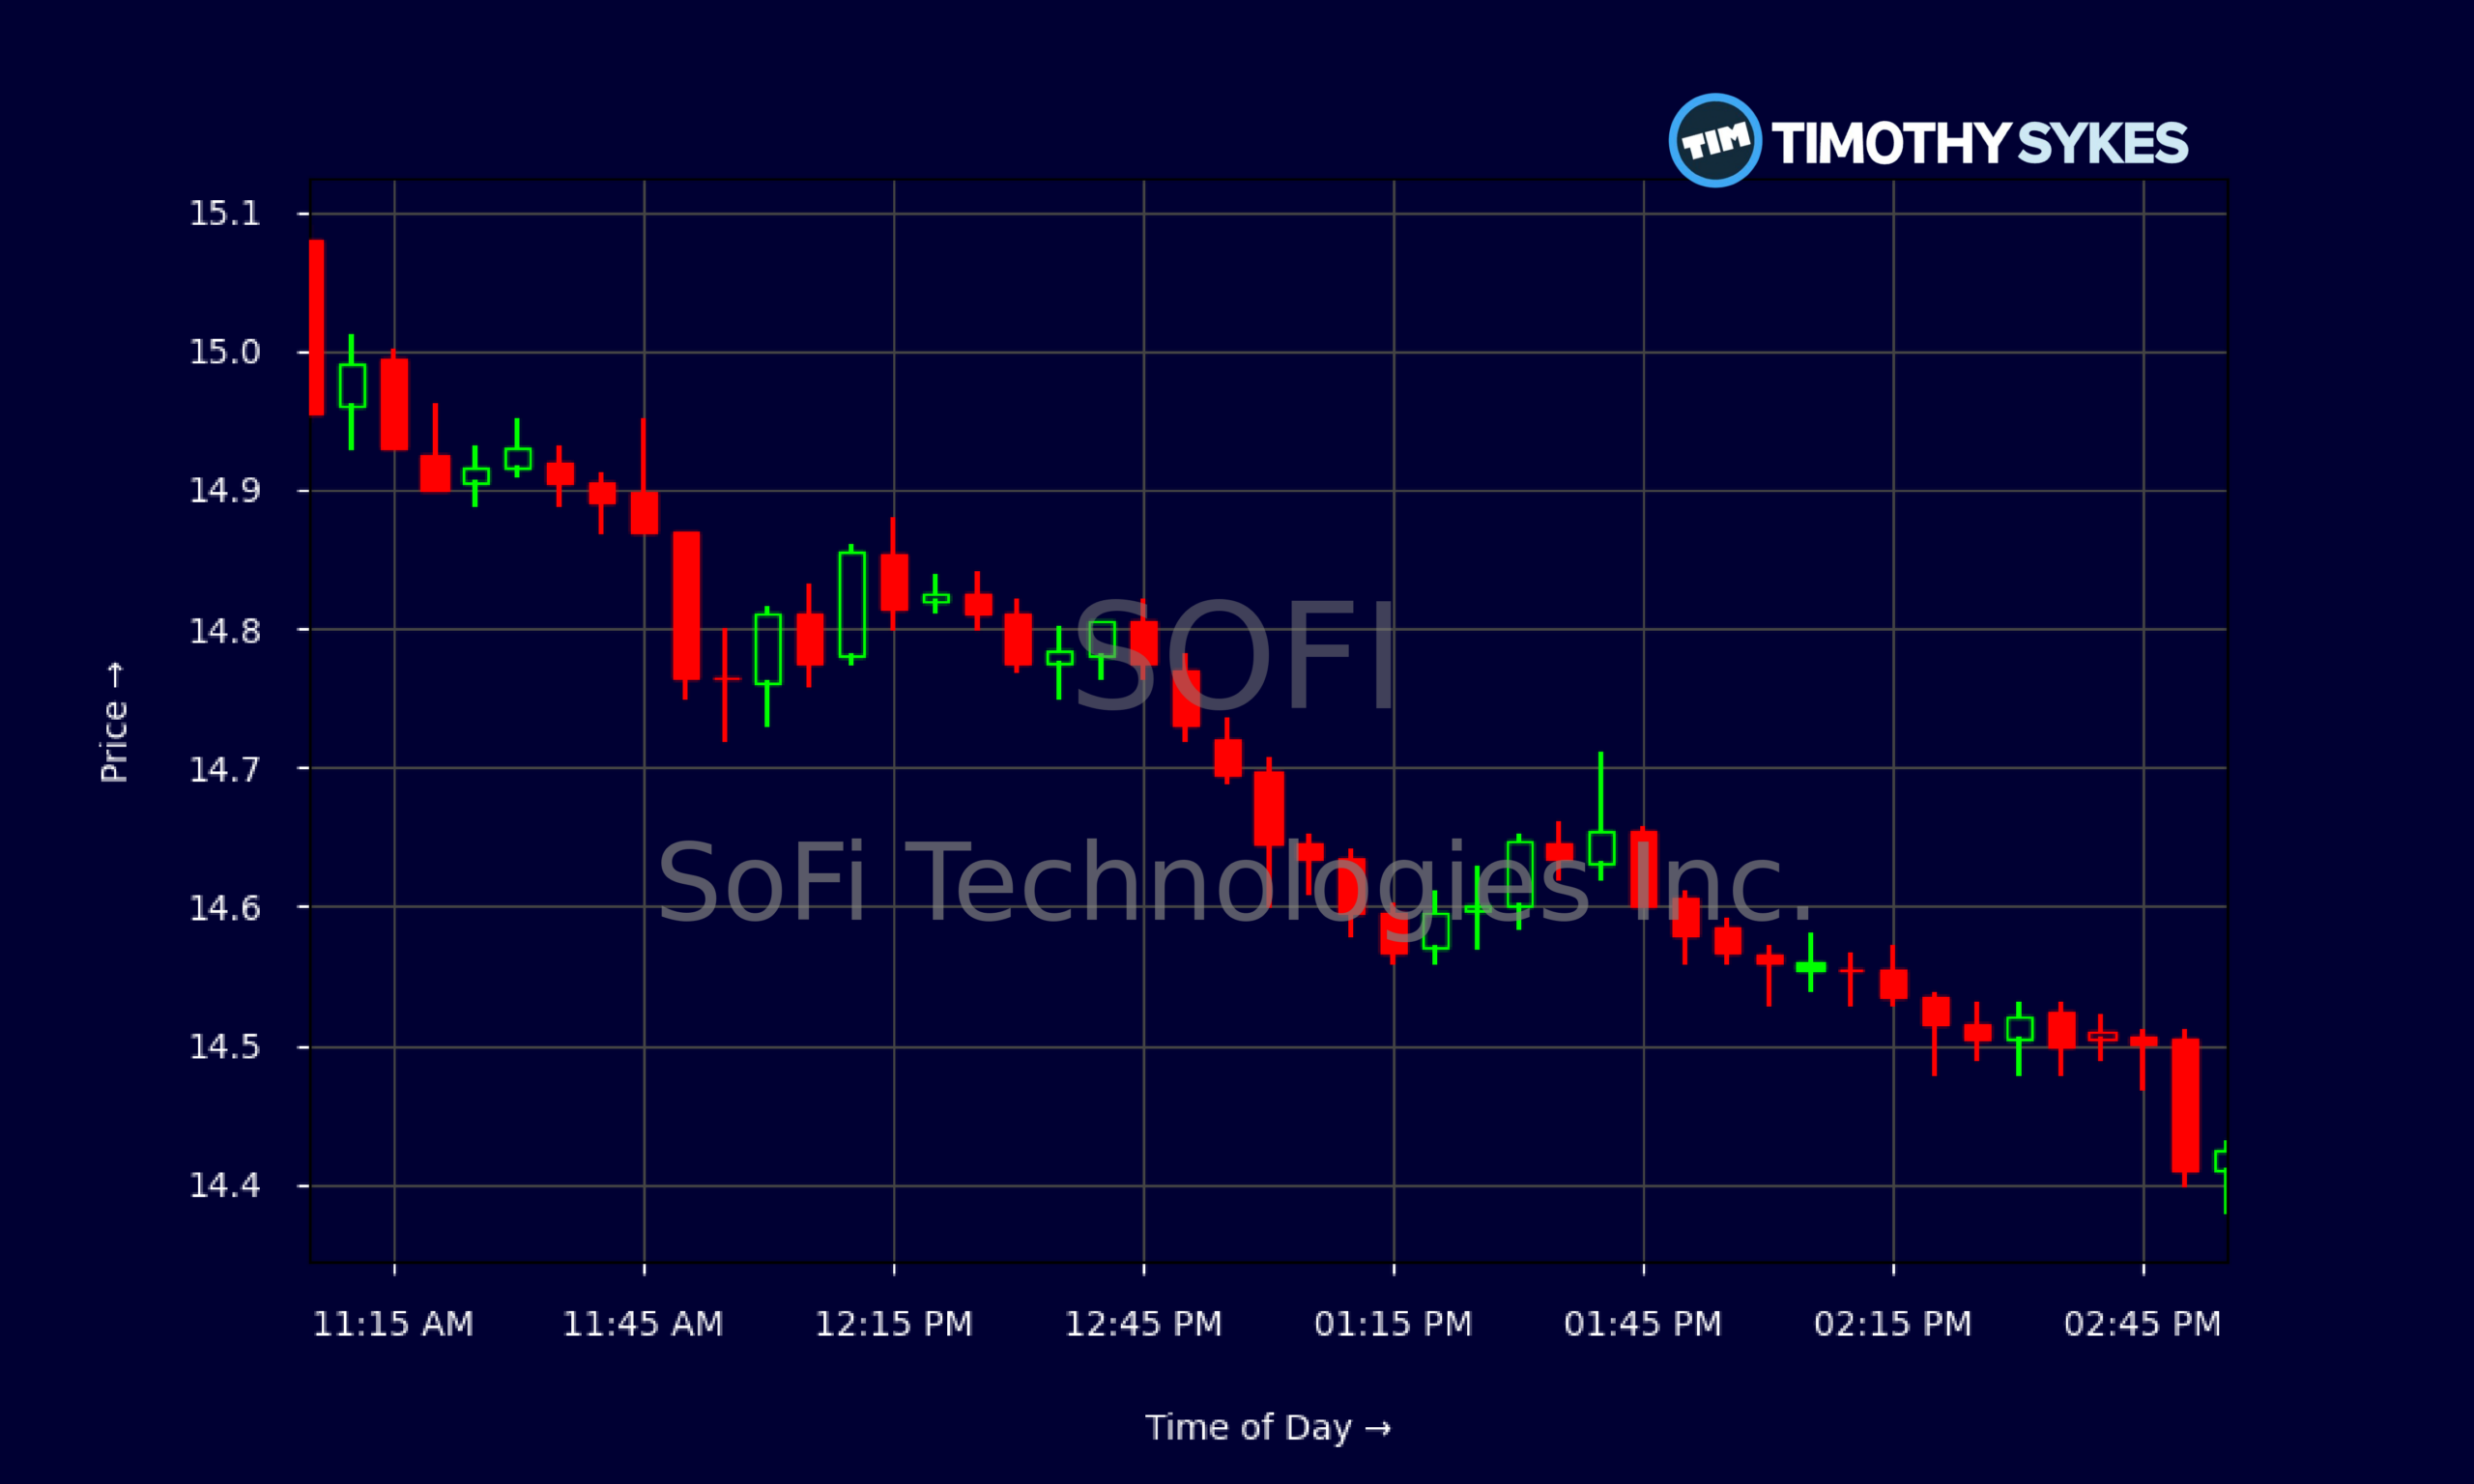
Live Update At 15:02:14 EDT: On Friday, October 16, 2026 SoFi Technologies Inc. stock [NASDAQ: SOFI] is trending down by -4.57%! Discover the key drivers behind this movement as well as our expert analysis in the detailed breakdown below.
Quick Financial Overview
SOFI has been grinding lower on the chart. Over the last few weeks, the stock slipped from around the $17 area on 2026/09/21 to roughly $14.40 by 2026/10/16. That’s a clear downtrend, with lower highs and lower closes stacking up. For short-term traders, SOFI is now trading well below recent resistance near $16, showing pressure every time the stock tries to bounce.
Intraday action on 2026/10/16 tells the same story. SOFI opened near $15.07 in the premarket, briefly pushed above $15.50 right after the open, then faded most of the day, closing near the lows around $14.40. That’s classic distribution — strength sold into, not bought.
More Breaking News
Fundamentally, SoFi Technologies is still posting strong top-line growth, with revenue over $3.6B and three‑year revenue growth above 30%. But the cash-flow picture is ugly. SOFI’s latest quarterly data show operating cash flow around -$3.9B and free cash flow about -$4.0B, while loans and deposits keep growing. The company is profitable on paper, with a price-to-earnings ratio near 32 and net margins around 15%, but heavy loan growth and leverage (about 5.5x) keep risk high. Traders need to respect that mix of rapid expansion and strained cash.
Why Traders Are Watching SOFI Now
SOFI is back on watch lists because the story just shifted from “growth machine” to “show-me mode.” Keefe Bruyette Woods cut its SoFi Technologies price target to $15 from $16 and kept an Underperform rating, and that matters. When a bank-focused research shop waves a caution flag on a digital lender’s balance sheet, traders should listen.
Their call is not about user growth or app downloads. It’s about the plumbing underneath. Keefe Bruyette points to fair value accounting, rising interest rates, and rapid balance sheet growth as reasons for more than $1B in expected Q3 headwinds. Translation for traders: as SOFI books more loans and marks them on its balance sheet, small changes in rates or assumptions can swing reported earnings and capital ratios hard.
That’s exactly what the chart is hinting at. SoFi Technologies traded near $16–$17 just weeks ago; now SOFI is defending the mid‑$14s. Each bounce toward $15.50–$16 is getting sold. Add in the Form 144 filing from an insider or large holder planning to sell restricted shares, and you get another overhang. Planned selling under SEC Rule 144 does not always crush a stock, but it tells traders that someone close to the story is happy to lighten up at current levels.
So while SOFI still shows strong revenue and decent reported profitability, the combination of an Underperform rating, a lowered $15 target, and insider sale plans stacks the deck toward caution. Active traders should treat this as a name where sentiment flipped and where the crowd will be quick to punish any soft Q3 numbers or capital headlines.
Conclusion
SOFI is a classic momentum-to-reality story right now. The company has grown into a full‑stack digital bank, with total assets above $60B and deposits around $45B. Revenue is ramping and SoFi Technologies is finally printing GAAP profits. On the surface, that looks like a clean bull case. But trading is about what matters next, not what just happened.
Keefe Bruyette’s reduced $15 price target and repeated Underperform call tell traders that the next chapter is all about balance sheet quality and capital. With net loans near $48B, rapid deposit growth, and negative free cash flow, SoFi Technologies is leaning hard on funding markets and accounting assumptions. Rising rates only tighten that vise. If Q3 numbers show that the greater‑than‑$1B headwind is real, SOFI’s current valuation at more than 4.7x sales and roughly 1.8x book will get stress‑tested fast.
For active traders, that means two things: be precise on entries and ruthless on exits. As Tim Sykes likes to say, “Cut losses quickly, because big losses always start out small.” In the same spirit, As millionaire penny stock trader and teacher Tim Sykes, says, “Small gains add up over time; focus on building wealth gradually, not chasing jackpots.”. SOFI is a liquid, crowded name where headlines move the tape. Use the volatility for education and research, map your levels ahead of time, and never confuse a trading setup with long‑term advice.
This is stock news, not investment advice. Timothy Sykes News delivers real-time stock market news focused on key catalysts driving short-term price movements. Our content is tailored for active traders and investors seeking to capitalize on rapid price fluctuations, particularly in volatile sectors like penny stocks. Readers come to us for detailed coverage on earnings reports, mergers, FDA approvals, new contracts, and unusual trading volumes that can trigger significant short-term price action. Some users utilize our news to explain sudden stock movements, while others rely on it for diligent research into potential investment opportunities.
Dive deeper into the world of trading with Timothy Sykes, renowned for his expertise in penny stocks. Explore his top picks and discover the strategies that have propelled him to success with these articles:
- Penny Stocks Trading Guide
- Best Penny Stocks Under $1 to Buy Today
- Top 8 Penny Stocks to Watch on Robinhood
Once you’ve got some stocks on watch, elevate your trading game with StocksToTrade the ultimate platform for traders. With specialized tools for swing and day trading, StocksToTrade will guide you through the market’s twists and turns.
Dig into StocksToTrade’s watchlists here:





Leave a reply