

Exascale Labs Holdings Inc. stocks have been trading up by 19.85 percent after transformative AI partnership news ignited investor optimism.
Key Takeaways
- XLAB has dropped sharply from late-September highs above $2.90 to around the mid-$1 range, but intraday charts show active trading and tight consolidations.
- Exascale Labs Holdings Inc. posted roughly $7.0M in revenue with a steep negative pretax margin, underscoring an early-stage, high-burn profile.
- XLAB carries negative book value and heavy current liabilities, yet holds over $4.2M in cash, giving traders a defined runway to track.
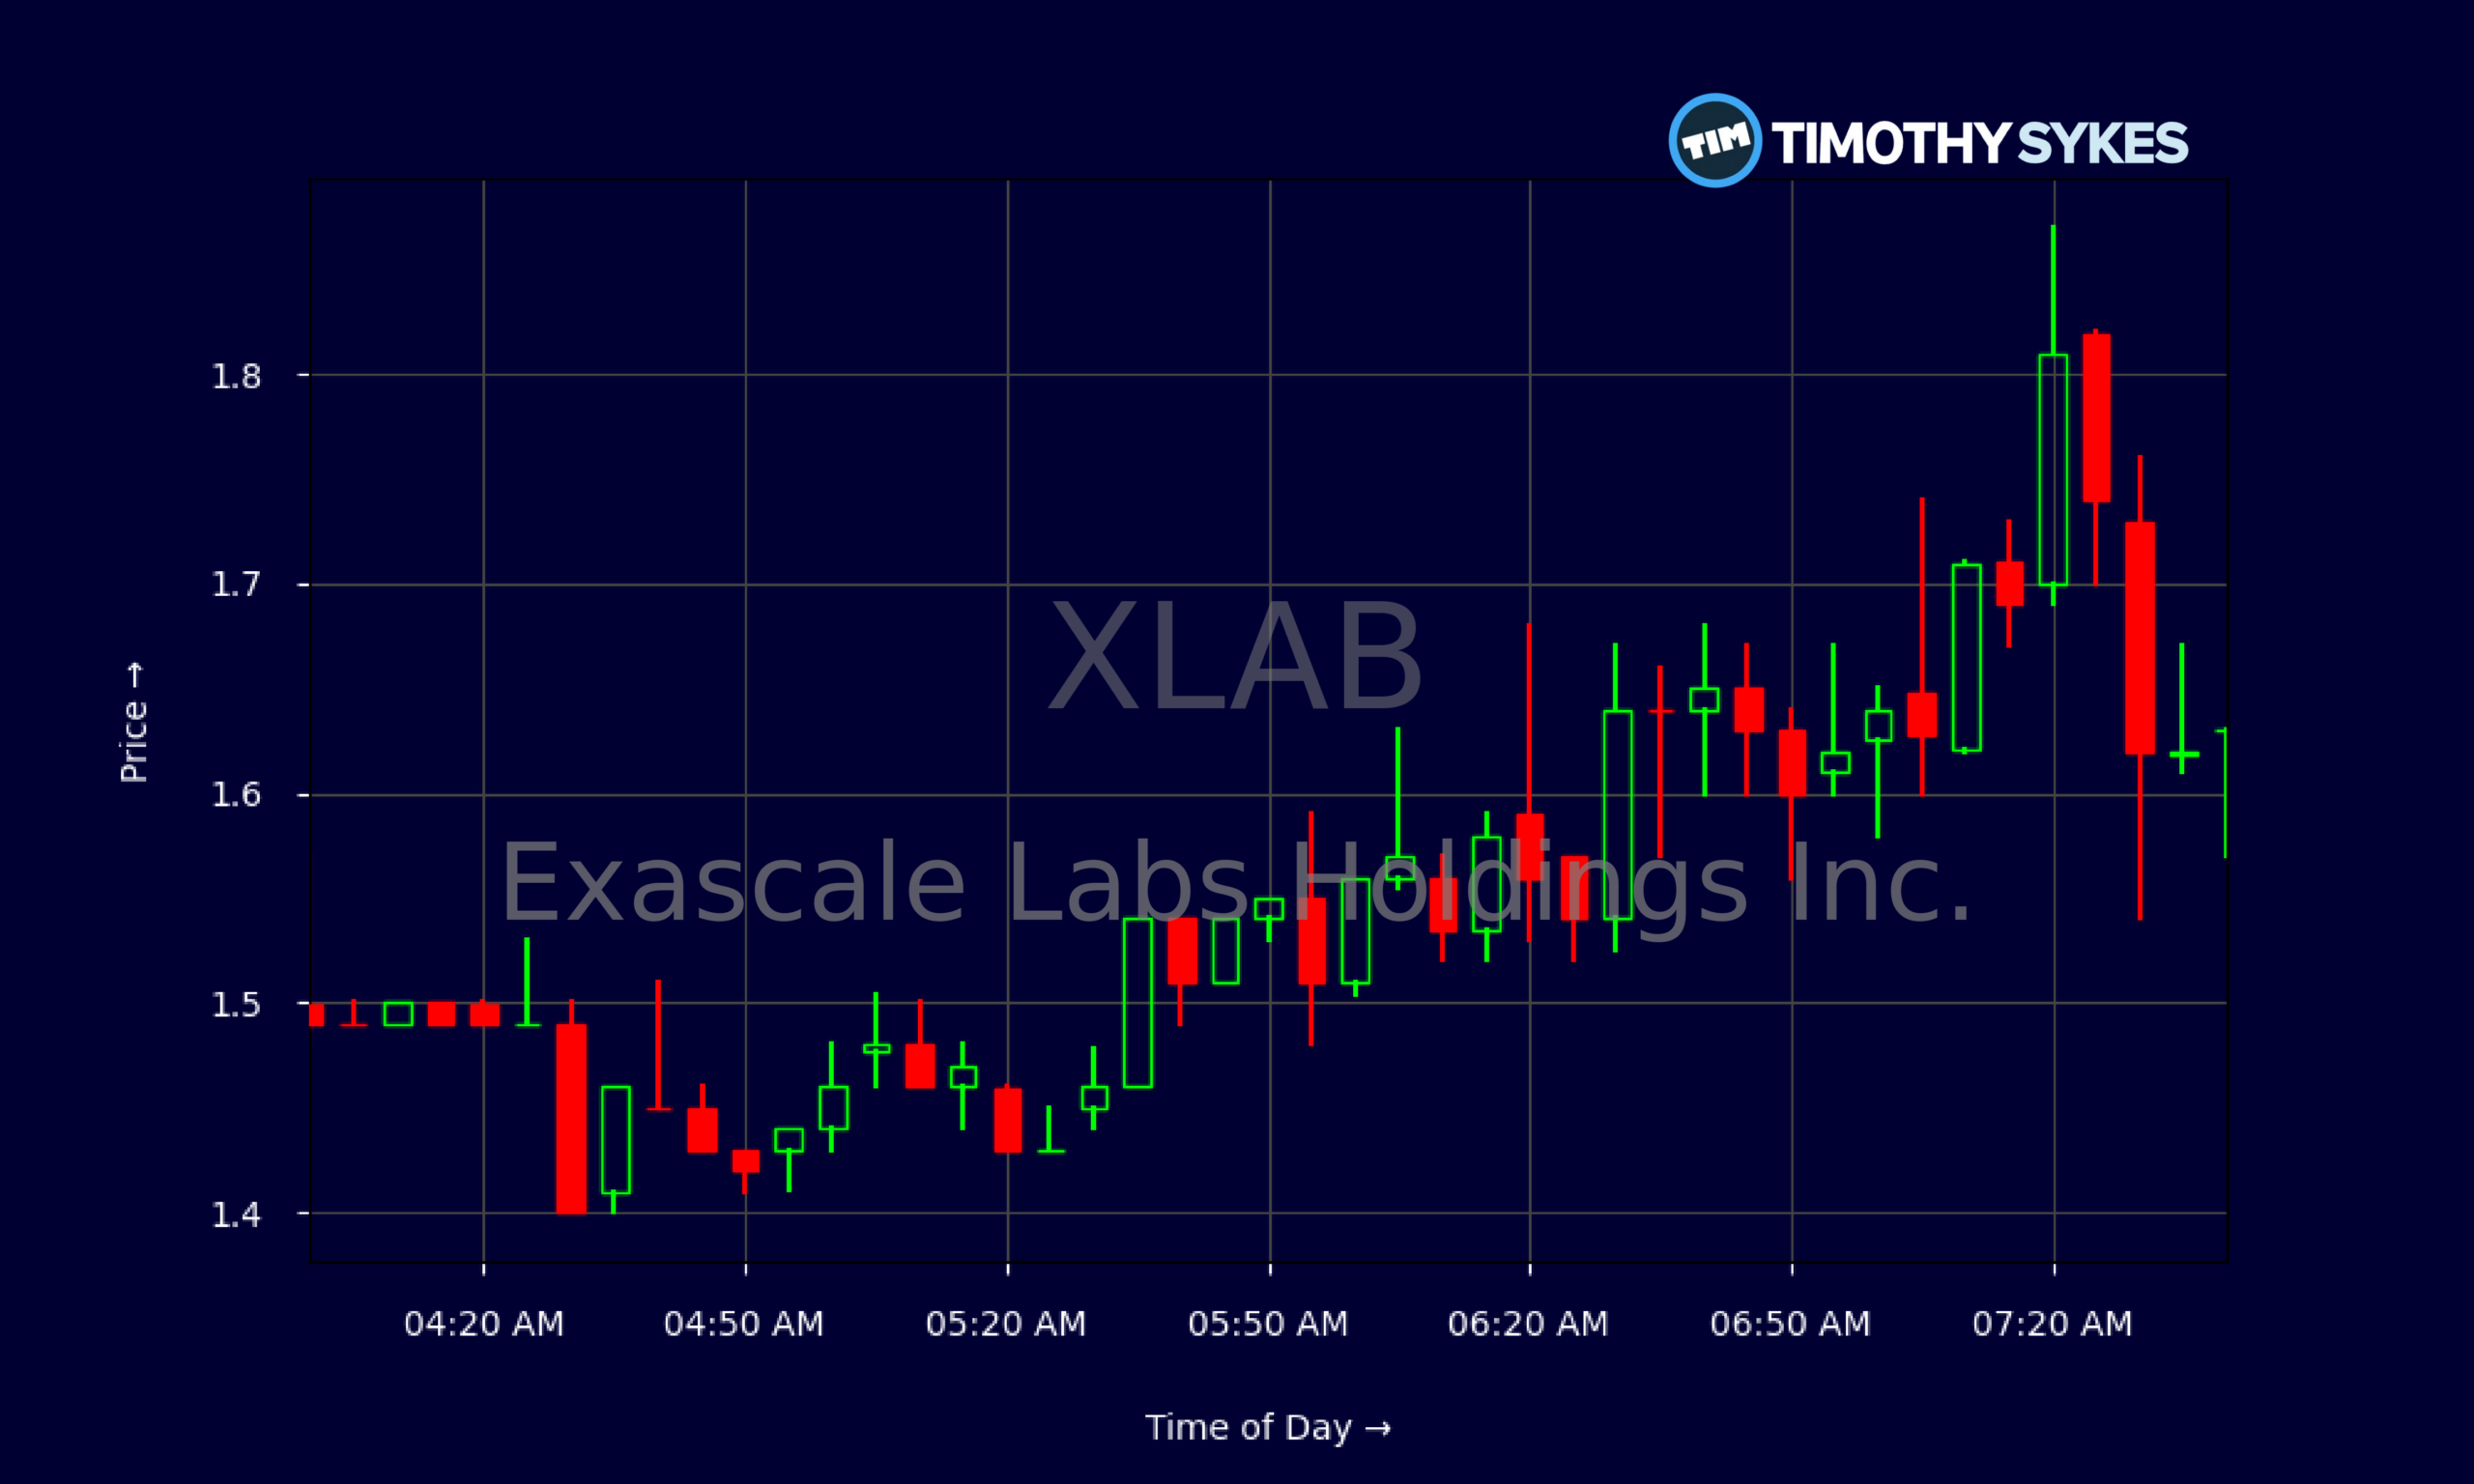
- Intraday XLAB action between $1.40 and $1.80 shows clear support and resistance zones that short-term traders are leaning on.
Live Update At 07:47:05 EDT: On Friday, October 16, 2026 Exascale Labs Holdings Inc. stock [NASDAQ: XLAB] is trending up by 19.85%! Discover the key drivers behind this movement as well as our expert analysis in the detailed breakdown below.
Quick Financial Overview
Exascale Labs Holdings Inc., trading under ticker XLAB, looks like a classic speculative growth story on the numbers. Recent revenue sits near $7.0M, but the pretax profit margin is roughly -70%. That tells traders XLAB is spending heavily to build the business and is a long way from steady profitability.
On the balance sheet, XLAB shows about $7.3M in total assets against roughly $20.3M in total liabilities. Stockholders’ equity is around -$13.0M, which is why the price-to-book ratio screens as negative. In plain English, the market is not paying for current assets; it is paying for future potential.
More Breaking News
The cash position matters here. XLAB reports about $4.2M in cash and roughly $7.2M in total cash at quarter end, backed by strong operating cash flow in the latest period and a sizable capital raise from common stock issuance. Working capital is still negative, which keeps Exascale Labs on the speculative side of the spectrum. For traders, XLAB is a name where price action and liquidity matter more than traditional value metrics.
Why Traders Are Watching XLAB’s Volatile Tape
XLAB price action over the past few weeks reads like a momentum trader’s case study. Exascale Labs Holdings Inc. traded as high as the $2.80–$3.00 area in late September, then steadily bled down toward the low $1s. That is a drawdown of more than 50%, the type of move that washes out weak hands and resets the chart.
Look at the daily candles. XLAB went from closing at $2.80–$2.90 to finishes around $1.36–$1.40. Along the way, Exascale Labs printed multiple wide-range days with highs above $1.50 and lows below $1.00. That kind of range tells traders there is real emotion in this tape — fear on the way down, and quick bounces as dip buyers test the waters.
Zoom into the intraday 5-minute chart and the picture tightens. XLAB has been cycling between roughly $1.40 on the downside and $1.80 on the upside in premarket and early trading. Each push into the $1.70s–$1.80s has met selling, while flushes into the mid-$1.40s keep finding support. For active traders, those are clear levels to trade against.
At the same time, Exascale Labs’ fundamentals frame the risk. Negative equity, heavy current liabilities, and a deep loss profile mean XLAB depends on continued access to capital markets and strong execution. But the strong recent operating cash flow and sizeable stock issuance show management is still able to raise and deploy cash. This mix — fragile balance sheet, decent liquidity, and wild price swings — is exactly why momentum traders keep XLAB on watch.
Conclusion
XLAB sits in that gray zone where traditional long-term metrics look ugly, but the chart keeps serving up setups. Exascale Labs Holdings Inc. has real revenue and a meaningful cash pile, yet carries negative book value and steep losses. That combination often fuels both sharp squeezes and brutal flushes as sentiment swings.
For short-term traders, the key is treating XLAB as a trading vehicle, not a story to fall in love with. The recent move from nearly $3.00 down into the $1s shows how fast sentiment can reverse. At the same time, the intraday action between $1.40 and $1.80 shows that XLAB still has enough volume and volatility to reward disciplined trading.
The path forward likely hinges on how long Exascale Labs can keep funding growth and whether revenue keeps building off that $7.0M base. Until the fundamentals turn, XLAB will trade more on momentum and liquidity than on earnings models. That is exactly where strict rules matter. As Tim Sykes always says, “Cut losses quickly — that’s the rule that keeps you in the game.” Just as important, as millionaire penny stock trader and teacher Tim Sykes, says, “There is always another play around the corner; don’t chase just because you feel FOMO.”. For traders eyeing XLAB, respecting risk levels and letting the chart, not hope, drive decisions is non‑negotiable. This analysis is for educational and research purposes only and is not investment advice.
This is stock news, not investment advice. Timothy Sykes News delivers real-time stock market news focused on key catalysts driving short-term price movements. Our content is tailored for active traders and investors seeking to capitalize on rapid price fluctuations, particularly in volatile sectors like penny stocks. Readers come to us for detailed coverage on earnings reports, mergers, FDA approvals, new contracts, and unusual trading volumes that can trigger significant short-term price action. Some users utilize our news to explain sudden stock movements, while others rely on it for diligent research into potential investment opportunities.
Dive deeper into the world of trading with Timothy Sykes, renowned for his expertise in penny stocks. Explore his top picks and discover the strategies that have propelled him to success with these articles:
- Penny Stocks Trading Guide
- Best Penny Stocks Under $1 to Buy Today
- Top 8 Penny Stocks to Watch on Robinhood
Once you’ve got some stocks on watch, elevate your trading game with StocksToTrade the ultimate platform for traders. With specialized tools for swing and day trading, StocksToTrade will guide you through the market’s twists and turns.
Dig into StocksToTrade’s watchlists here:



Leave a reply