

Snap Inc. stocks have been trading down by -14.95 percent amid reports of weakening digital ad demand pressuring revenue growth.
Key Takeaways
- UBS raised its price target on Snap from $5.70 to $7 while staying Neutral, signaling cautious confidence despite advertising headwinds.
- Snap reported Q3 daily active users of 495 million, slightly missing the 498.5 million FactSet estimate and raising questions on engagement momentum.
- A U.S. appeals court cleared Florida to enforce a law barring children under 14 from social media platforms like Snapchat, spotlighting regulatory risk.
- A Form 144 filing flagged insider plans to sell Snap Inc. shares, hinting at added share supply and potential pressure on SNAP.
- Tech stocks broadly sold off, with key ETFs down 1.8%–2.6%, adding macro downside pressure to names such as SNAP.
Live Update At 14:02:07 EST: On Thursday, November 05, 2026 Snap Inc. stock [NYSE: SNAP] is trending down by -14.95%! Discover the key drivers behind this movement as well as our expert analysis in the detailed breakdown below.
Quick Financial Overview
SNAP is trading like a name stuck between turnaround hopes and real structural pressure. The daily chart shows a steady slide from the $6.30–$6.50 area in mid-October 2026 down to about $5.04 on 2026/11/05. That’s roughly a 20% drawdown in just a few weeks. Each bounce toward $6 on Snap Inc. keeps getting rejected, which tells traders sellers are still in control.
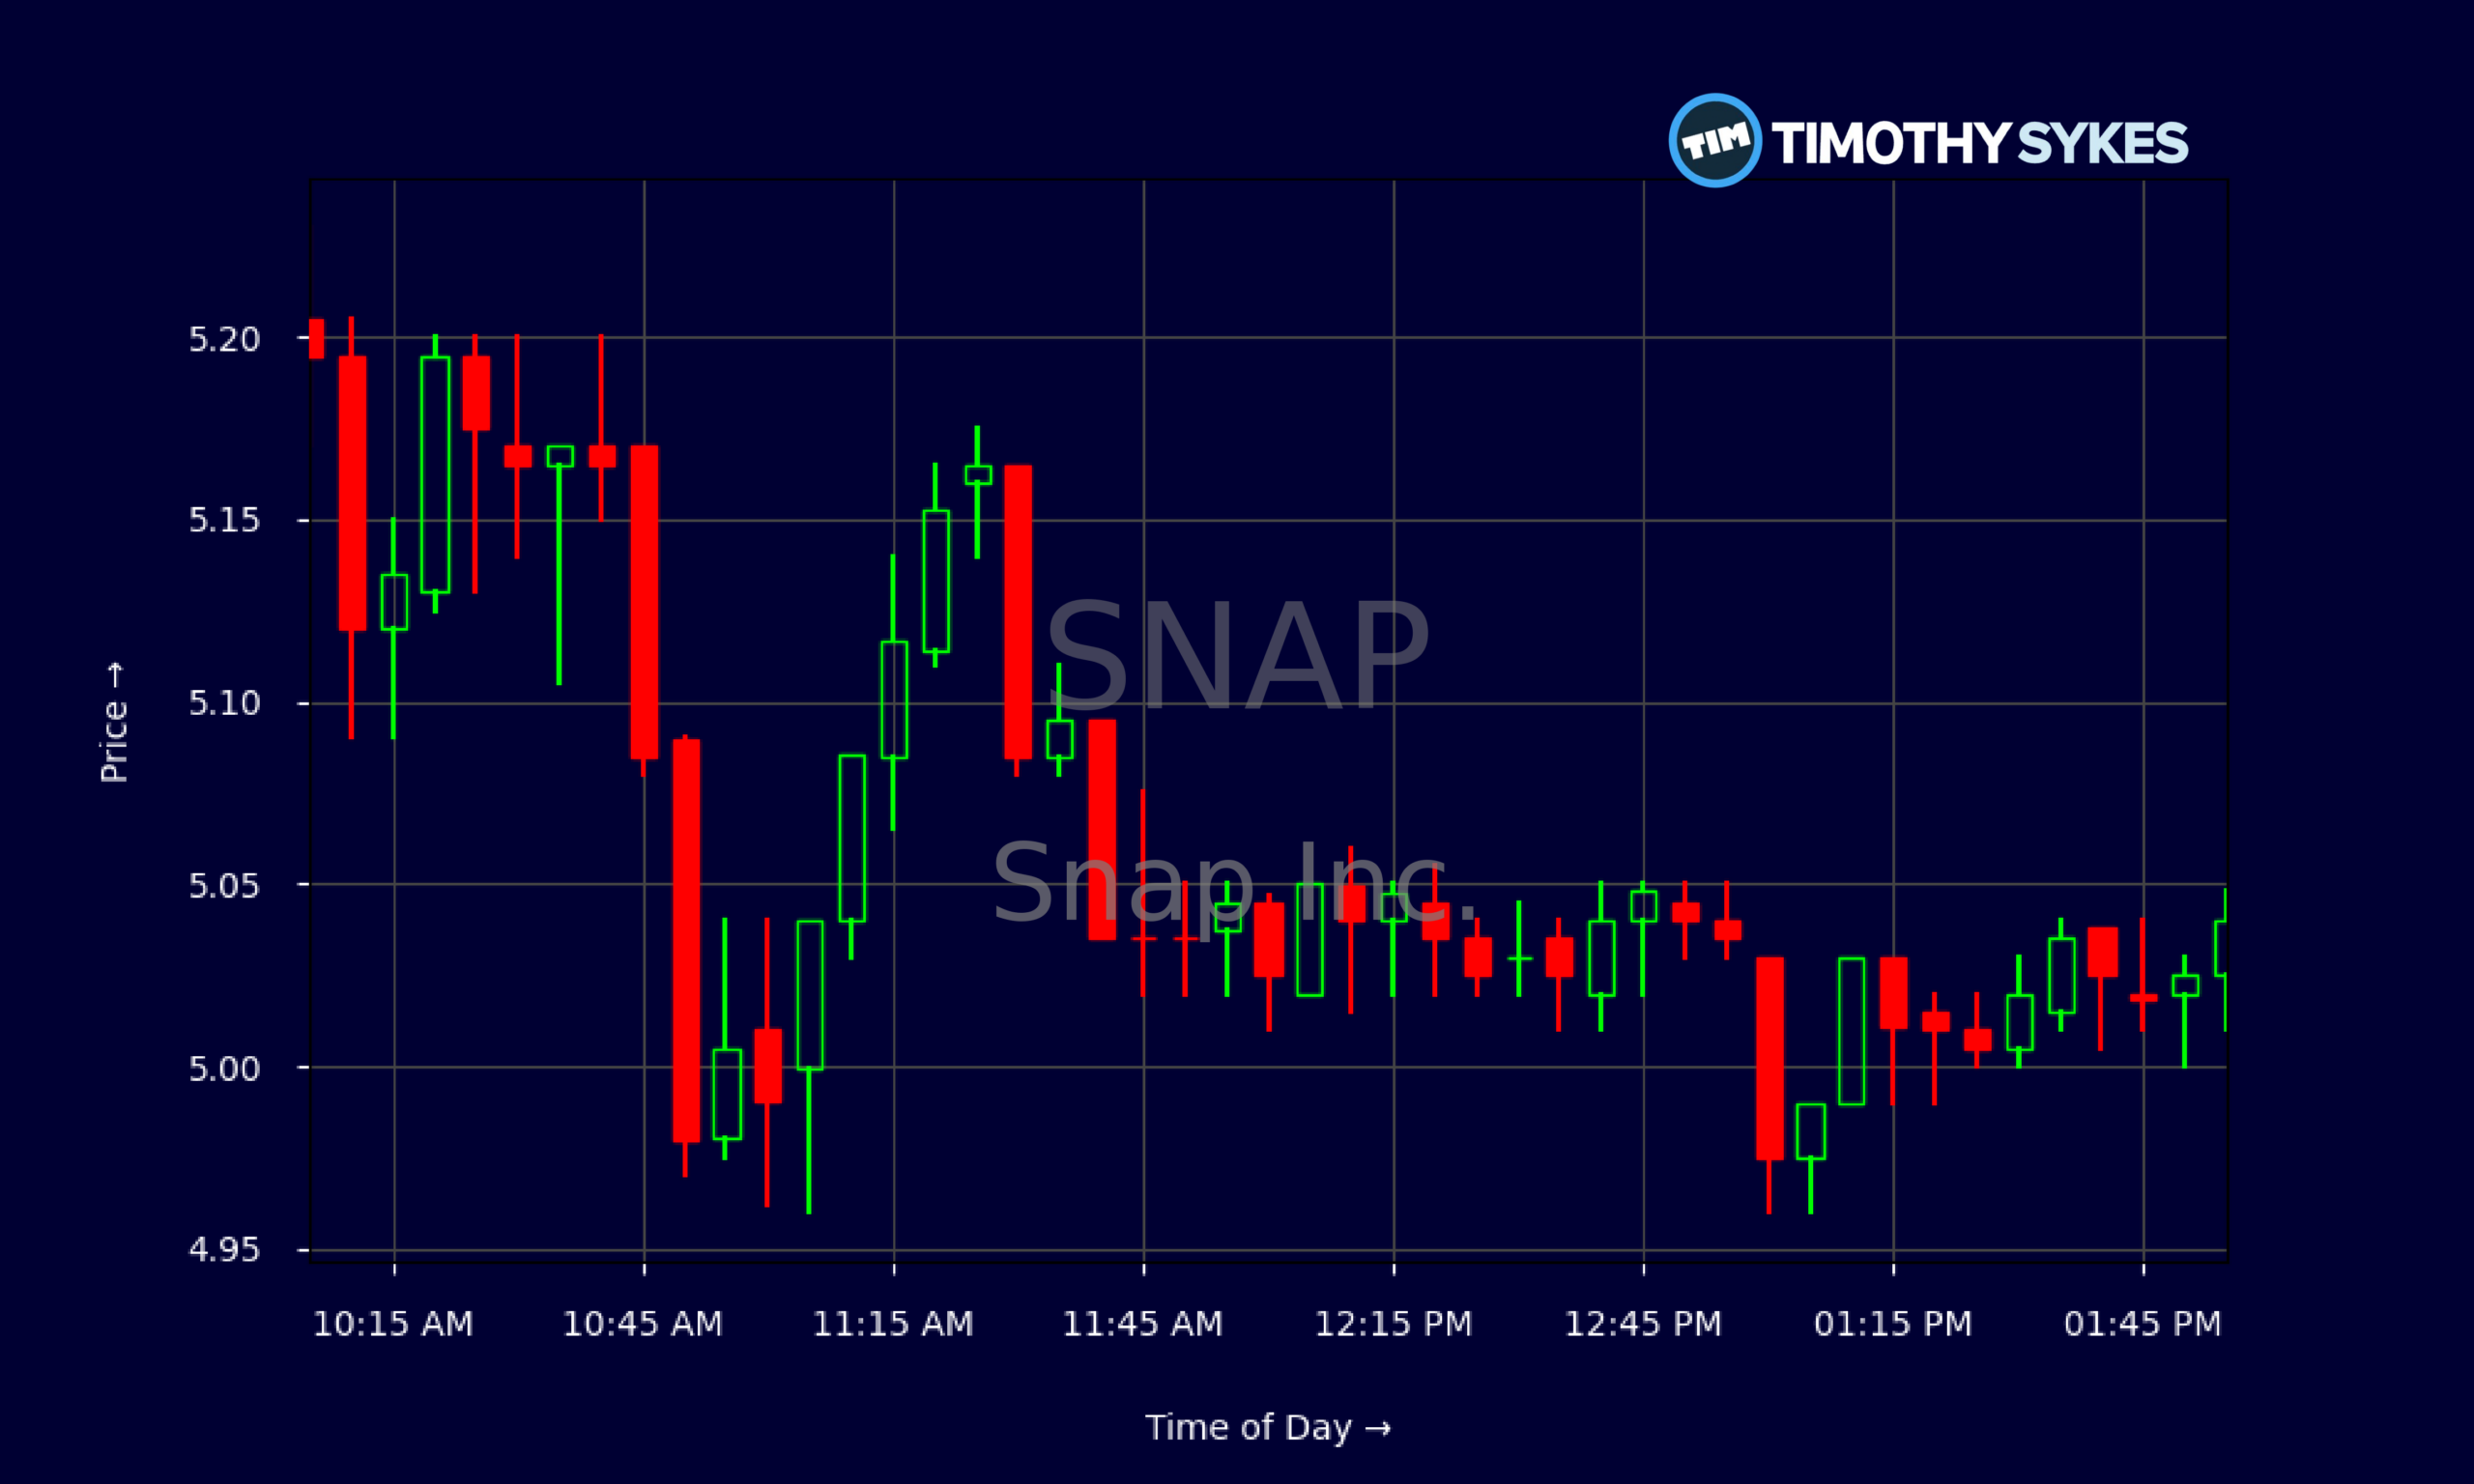
Intraday, SNAP’s 5‑minute tape around $5 shows tight, choppy action. The stock opened near $5.30, pushed briefly toward $5.56, then faded all the way under $5 before stabilizing just above $5 into the afternoon. That intraday pattern — early spike, relentless fade, flat base — is classic distribution, not accumulation.
More Breaking News
On the fundamentals, Snap Inc. prints strong gross margins around 78.4%, so the core ad product has real pricing power. But profit margins remain negative, with return on equity deep in the red and leverage elevated, signaled by total debt to equity of 2.19. Cash flow is improving — about $120.5M in free cash flow last quarter — yet the company still posts a net loss of about $164M. For traders, that mix screams “show-me story”: SNAP has runway, but the market wants proof of durable growth before rewarding the stock with a richer multiple.
Why Traders Are Watching SNAP
SNAP is sitting at the crossroads of three powerful themes: slowing user momentum, rising regulation, and a shaky tech tape. That’s exactly the kind of pressure cooker active traders look for.
First, the growth narrative. Snap Inc. reported Q3 daily active users of 495 million, just under the 498.5 million FactSet consensus. On paper, that miss looks tiny. On a trading screen, it’s not. Platform names like SNAP trade on the belief that user engagement stays one step ahead of expectations. Even a slight lag feeds the story that growth may be decelerating, which naturally clouds the outlook for ad pricing and revenue expansion.
Second, regulation just got more real. A U.S. appeals court let Florida enforce a law blocking kids under 14 from social media platforms such as Snapchat and targeting “addictive” features like autoplay and infinite scroll. That strikes at Snap Inc.’s engagement design. If other states follow, SNAP needs to rework core product mechanics or risk losing a chunk of its youngest cohort. Traders know regulatory headlines can trigger sharp repricing well before any financial impact shows up in the numbers.
Third, sentiment around the name is not helped by insider behavior. A Form 144 disclosed an insider’s planned sale of Snap shares, signaling fresh supply coming to market. For short-term traders, insider selling often acts like an invisible ceiling; every rally into that supply zone can stall out faster than the chart “should.”
All of this plays out against a weak tech backdrop. Major tech and semiconductor ETFs dropped 1.8%–2.6% in late Monday trading, and SNAP is trading inside that risk-off wave. So even a modest user miss and cautious UBS price-target tweak — up to $7 with a Neutral stance — can hit harder when the whole sector is under pressure.
Conclusion
Right now, SNAP is a classic battleground chart. On one side, you have a digital ad platform with nearly $5.9B in annual revenue, strong gross margins, and improving free cash flow. UBS nudging its price target from $5.70 to $7 shows that Wall Street is not writing off Snap Inc. Instead, the firm is quietly acknowledging some progress, while still refusing to go all-in with anything more than Neutral.
On the other side, the headwinds are hard to ignore. SNAP missed Q3 daily active user expectations by a few million, Florida’s social media law raises the specter of broader restrictions on Snapchat’s youngest users, and a planned insider share sale hints at limited short-term confidence. Layer sector-wide tech selling on top, and you have a name where every bounce is suspect until proven otherwise.
For active traders, that kind of tension creates opportunity — both long and short — but only for those who stay disciplined. SNAP around $5 is not a “close your eyes and hope” setup; it’s a ticker that demands a plan, risk levels, and quick execution. As Tim Sykes loves to remind his community, “The market doesn’t care about your opinions, only your discipline — cut losses quickly and let the best setups come to you.” As millionaire penny stock trader and teacher Tim Sykes, says, “It’s better to go home at zero than to go home in the red.”. This discussion of Snap Inc. is strictly for educational and research purposes, but the core lesson is universal: respect the trend, respect the news, and never marry a stock, especially one like SNAP in the middle of a fight for its next chapter.
This is stock news, not investment advice. Timothy Sykes News delivers real-time stock market news focused on key catalysts driving short-term price movements. Our content is tailored for active traders and investors seeking to capitalize on rapid price fluctuations, particularly in volatile sectors like penny stocks. Readers come to us for detailed coverage on earnings reports, mergers, FDA approvals, new contracts, and unusual trading volumes that can trigger significant short-term price action. Some users utilize our news to explain sudden stock movements, while others rely on it for diligent research into potential investment opportunities.
Dive deeper into the world of trading with Timothy Sykes, renowned for his expertise in penny stocks. Explore his top picks and discover the strategies that have propelled him to success with these articles:
- Penny Stocks Trading Guide
- Best Penny Stocks Under $1 to Buy Today
- Top 8 Penny Stocks to Watch on Robinhood
Once you’ve got some stocks on watch, elevate your trading game with StocksToTrade the ultimate platform for traders. With specialized tools for swing and day trading, StocksToTrade will guide you through the market’s twists and turns.
Dig into StocksToTrade’s watchlists here:





Leave a reply